In probability theory and statistics, a normal distribution or Gaussian distribution is a type of continuous probability distribution for a real-valued random variable. The general form of its probability density function is

In probability theory and statistics, the multivariate normal distribution, multivariate Gaussian distribution, or joint normal distribution is a generalization of the one-dimensional (univariate) normal distribution to higher dimensions. One definition is that a random vector is said to be k-variate normally distributed if every linear combination of its k components has a univariate normal distribution. Its importance derives mainly from the multivariate central limit theorem. The multivariate normal distribution is often used to describe, at least approximately, any set of (possibly) correlated real-valued random variables, each of which clusters around a mean value.

In probability theory and statistics, a covariance matrix is a square matrix giving the covariance between each pair of elements of a given random vector.
In statistics, the matrix normal distribution or matrix Gaussian distribution is a probability distribution that is a generalization of the multivariate normal distribution to matrix-valued random variables.
In statistics, propagation of uncertainty is the effect of variables' uncertainties on the uncertainty of a function based on them. When the variables are the values of experimental measurements they have uncertainties due to measurement limitations which propagate due to the combination of variables in the function.
In statistics, sometimes the covariance matrix of a multivariate random variable is not known but has to be estimated. Estimation of covariance matrices then deals with the question of how to approximate the actual covariance matrix on the basis of a sample from the multivariate distribution. Simple cases, where observations are complete, can be dealt with by using the sample covariance matrix. The sample covariance matrix (SCM) is an unbiased and efficient estimator of the covariance matrix if the space of covariance matrices is viewed as an extrinsic convex cone in Rp×p; however, measured using the intrinsic geometry of positive-definite matrices, the SCM is a biased and inefficient estimator. In addition, if the random variable has a normal distribution, the sample covariance matrix has a Wishart distribution and a slightly differently scaled version of it is the maximum likelihood estimate. Cases involving missing data, heteroscedasticity, or autocorrelated residuals require deeper considerations. Another issue is the robustness to outliers, to which sample covariance matrices are highly sensitive.
In directional statistics, the von Mises–Fisher distribution, is a probability distribution on the -sphere in . If the distribution reduces to the von Mises distribution on the circle.
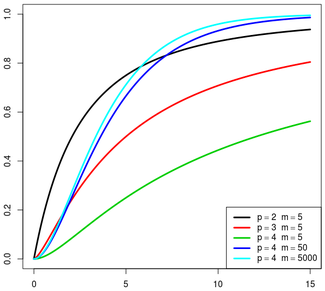
The sensitivity index or discriminability index or detectability index is a dimensionless statistic used in signal detection theory. A higher index indicates that the signal can be more readily detected.
Bayesian linear regression is a type of conditional modeling in which the mean of one variable is described by a linear combination of other variables, with the goal of obtaining the posterior probability of the regression coefficients and ultimately allowing the out-of-sample prediction of the regressandconditional on observed values of the regressors. The simplest and most widely used version of this model is the normal linear model, in which given is distributed Gaussian. In this model, and under a particular choice of prior probabilities for the parameters—so-called conjugate priors—the posterior can be found analytically. With more arbitrarily chosen priors, the posteriors generally have to be approximated.
In statistics, the multivariate t-distribution is a multivariate probability distribution. It is a generalization to random vectors of the Student's t-distribution, which is a distribution applicable to univariate random variables. While the case of a random matrix could be treated within this structure, the matrix t-distribution is distinct and makes particular use of the matrix structure.
In probability and statistics, the class of exponential dispersion models (EDM), also called exponential dispersion family (EDF), is a set of probability distributions that represents a generalisation of the natural exponential family. Exponential dispersion models play an important role in statistical theory, in particular in generalized linear models because they have a special structure which enables deductions to be made about appropriate statistical inference.

In probability theory and statistics, the normal-inverse-gamma distribution is a four-parameter family of multivariate continuous probability distributions. It is the conjugate prior of a normal distribution with unknown mean and variance.
In probability theory, the family of complex normal distributions, denoted or , characterizes complex random variables whose real and imaginary parts are jointly normal. The complex normal family has three parameters: location parameter μ, covariance matrix , and the relation matrix . The standard complex normal is the univariate distribution with , , and .
In probability theory and statistics, the negative multinomial distribution is a generalization of the negative binomial distribution (NB(x0, p)) to more than two outcomes.

In probability theory, a logit-normal distribution is a probability distribution of a random variable whose logit has a normal distribution. If Y is a random variable with a normal distribution, and t is the standard logistic function, then X = t(Y) has a logit-normal distribution; likewise, if X is logit-normally distributed, then Y = logit(X)= log (X/(1-X)) is normally distributed. It is also known as the logistic normal distribution, which often refers to a multinomial logit version (e.g.).
In statistics, inverse-variance weighting is a method of aggregating two or more random variables to minimize the variance of the weighted average. Each random variable is weighted in inverse proportion to its variance.
In probability theory and statistics, the normal-Wishart distribution is a multivariate four-parameter family of continuous probability distributions. It is the conjugate prior of a multivariate normal distribution with unknown mean and precision matrix.
In probability theory and statistics, the normal-inverse-Wishart distribution is a multivariate four-parameter family of continuous probability distributions. It is the conjugate prior of a multivariate normal distribution with unknown mean and covariance matrix.
In statistics, the matrix t-distribution is the generalization of the multivariate t-distribution from vectors to matrices. The matrix t-distribution shares the same relationship with the multivariate t-distribution that the matrix normal distribution shares with the multivariate normal distribution. For example, the matrix t-distribution is the compound distribution that results from sampling from a matrix normal distribution having sampled the covariance matrix of the matrix normal from an inverse Wishart distribution.
In the mathematical theory of probability, multivariate Laplace distributions are extensions of the Laplace distribution and the asymmetric Laplace distribution to multiple variables. The marginal distributions of symmetric multivariate Laplace distribution variables are Laplace distributions. The marginal distributions of asymmetric multivariate Laplace distribution variables are asymmetric Laplace distributions.