General elections were held in the Netherlands on 1 July 1925. The General League of Roman Catholic Electoral Associations remained the largest party in the House of Representatives, winning 30 of the 100 seats.

General elections were held in the Netherlands on 3 July 1929. The Roman Catholic State Party remained the largest party in the House of Representatives, winning 30 of the 100 seats.

General elections were held in the Netherlands on 17 May 1946, the first after World War II. The Catholic People's Party, a continuation of the pre-war Roman Catholic State Party, remained the largest party in the House of Representatives, winning 32 of the 100 seats.

General elections were held in the Netherlands on 7 July 1948. The Catholic People's Party remained the largest party in the House of Representatives, winning 32 of the 100 seats.

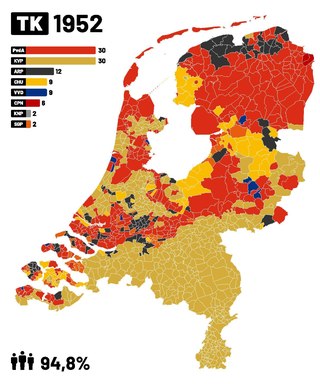
General elections were held in the Netherlands on 25 June 1952. The Catholic People's Party and the Labour Party both won 30 of the 100 seats in the House of Representatives. It was the first time since 1913 that the Catholic People's Party and its predecessors had not received a plurality of the vote.

General elections were held in the Netherlands on 13 June 1956. For the first time, the Labour Party (PvdA) emerged as the largest party, winning 50 of the 150 seats in the House of Representatives.

Federal elections were held in Germany on 10 January 1874. The National Liberal Party remained the largest party in the Reichstag, with 147 of the 397 seats. Voter turnout was 61.2%.

General elections were held in Belgium on 4 June 1950. The result was a victory for the Christian Social Party, which won 108 of the 212 seats in the Chamber of Representatives and 54 of the 106 seats in the Senate. Voter turnout was 92.6%. This election was the last one in Belgian history where a single party achieved an absolute majority. Elections for the nine provincial councils were also held.

General elections were held in Belgium on 11 April 1954. The dominant Christian Social Party won 95 of the 212 seats in the Chamber of Representatives and 49 of the 106 seats in the Senate. Voter turnout was 93.2%. Elections for the nine provincial councils were also held.

General elections were held in Belgium on 1 June 1958. The result was a victory for the Christian Social Party, which won 104 of the 212 seats in the Chamber of Representatives and 53 of the 106 seats in the Senate. Voter turnout was 93.6% in the Chamber election and 93.7% in the Senate election. Elections for the nine provincial councils were also held.

General elections were held in Belgium on 27 November 1932. The Catholic Party won 79 of the 187 seats in the Chamber of Representatives and 42 of the 93 seats in the Senate. Voter turnout was 94.3%.
General elections were held in Belgium on 16 November 1919. Although the Belgian Labour Party received the most votes in the Chamber of Representatives elections, the Catholic Party remained the largest party in both the Chamber and the Senate. Voter turnout was 88.5% in the Chamber elections.

General elections were held in Belgium on 20 November 1921. The Catholic Party, emerged as the largest party, winning 70 of the 186 seats in the Chamber of Representatives. Voter turnout was 91%.

General elections were held in Belgium on 5 April 1925. The result was a victory for the Belgian Labour Party, which won 78 of the 187 seats in the Chamber of Representatives. Voter turnout was 92.8% in the Chamber election and 92.7% in the Senate election.

Full general elections were held in Belgium on 14 October 1894, with run-off elections held on 21 October 1894.
Partial general elections were held in Belgium on 25 May 1902. The result was a victory for the Catholic Party, which won 54 of the 85 seats up for election in the Chamber of Representatives. Voter turnout was 95.7%.
Partial general elections were held in Belgium on 22 May 1910. The result was a victory for the Catholic Party, which won 49 of the 87 seats up for election in the Chamber of Representatives.

General elections were held in Belgium on 24 May 1936. The result was a victory for the Belgian Labour Party, which won 70 of the 202 seats in the Chamber of Representatives and 39 of the 101 seats in the Senate. Voter turnout was 94.7%.

General elections were held in Italy on 27 January 1861, with a second round on 3 February. The newly elected Parliament first convened in Turin on 4 March 1861, where, thirteen days later, it declared the unification of the country as the Kingdom of Italy.
General elections were held in Italy on 6 November 1904, with a second round of voting on 13 November. The "ministerial" left-wing bloc remained the largest in Parliament, winning 339 of the 508 seats. The papal ban on Catholics voting was relaxed for the first time, and three Catholics were elected.


