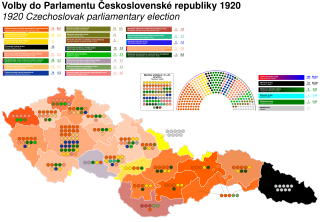
Parliamentary elections were held in Czechoslovakia on 18 and 25 April 1920. Members of the Chamber of Deputies were elected on 18 April and members of the Senate on 25 April. The elections had initially been planned for mid- or late 1919, but had been postponed.

General elections were held in Belgium on 17 February 1946. The result was a victory for the Christian Social Party, which won 92 of the 202 seats in the Chamber of Representatives and 51 of the 101 seats in the Senate. Voter turnout was 90.3%.

General elections were held in Belgium on 26 June 1949. Several reforms took effect prior to the elections; they were the first after the introduction of universal women's suffrage; the number of seats in the Chamber of Representatives was increased from 202 to 212, and from now on, elections for the nine provincial councils were held simultaneously with parliamentary elections. The number of Chamber seats and the simultaneous provincial and parliamentary elections would remain unchanged until state reforms in 1993.
General elections were held in Belgium on 4 June 1950. The result was a victory for the Christian Social Party, which won 108 of the 212 seats in the Chamber of Representatives and 54 of the 106 seats in the Senate. Voter turnout was 92.6%. This election was the last one in Belgian history where a single party achieved an absolute majority. Elections for the nine provincial councils were also held.
General elections were held in Belgium on 1 June 1958. The result was a victory for the Christian Social Party, which won 104 of the 212 seats in the Chamber of Representatives and 53 of the 106 seats in the Senate. Voter turnout was 93.6% in the Chamber election and 93.7% in the Senate election. Elections for the nine provincial councils were also held.

General elections were held in Belgium on 26 March 1961. The result was a victory for the Christian Social Party, which won 96 of the 212 seats in the Chamber of Representatives and 47 of the 106 seats in the Senate. Voter turnout was 92.3%. Elections for the nine provincial councils were also held.

General elections were held in Belgium on 23 May 1965. The result was a victory for the Christian Social Party, which won 77 of the 212 seats in the Chamber of Representatives and 44 of the 106 seats in the Senate. Voter turnout was 91.6%. Elections for the nine provincial councils were also held.

General elections were held in Belgium on 7 November 1971. The result was a victory for the Christian People's Party, which won 40 of the 212 seats in the Chamber of Representatives and 34 of the 106 seats in the Senate. Voter turnout was 91.5%. Elections to the nine provincial councils were also held.
General elections were held in Belgium on 8 November 1981. Voter turnout was 94.5% in the Chamber election and 94.6% in the Senate election. Elections were also held for the nine provincial councils and for the Council of the German Cultural Community. They were the first elections after the voting age was lowered from 21 to 18. This contributed to the success of the socialist parties and the green parties.

General elections were held in Belgium on 17 December 1978. The Christian People's Party emerged as the largest party, with 57 of the 212 seats in the Chamber of Representatives and 29 of the 106 seats in the Senate. Voter turnout was 94.8%. Elections were also held for the nine provincial councils and for the Council of the German Cultural Community.

General elections were held in Belgium on 20 November 1921. The Catholic Party, emerged as the largest party, winning 70 of the 186 seats in the Chamber of Representatives. Voter turnout was 91%.

General elections were held in Belgium on 5 April 1925. The result was a victory for the Belgian Labour Party, which won 78 of the 187 seats in the Chamber of Representatives. Voter turnout was 92.8% in the Chamber election and 92.7% in the Senate election.

Full general elections were held in Belgium on 14 October 1894, with run-off elections held on 21 October 1894.
Full general elections were held in Belgium on 27 May 1900. They were the first elections under a proportional system instead of a majority system, with Belgium becoming the first country in the world to adopt proportional representation for parliamentary elections. Single-member constituencies were replaced with multi-member constituencies of between three and eighteen seats.
Partial general elections were held in Belgium on 25 May 1902. The result was a victory for the Catholic Party, which won 54 of the 85 seats up for election in the Chamber of Representatives. Voter turnout was 95.7%.
Full general elections were held in Belgium on 2 June, 1912.

General elections were held in Belgium on 24 May 1936. The result was a victory for the Belgian Labour Party, which won 70 of the 202 seats in the Chamber of Representatives and 39 of the 101 seats in the Senate. Voter turnout was 94.7%.
General elections were held in Romania between 1 and 3 March 1922. In the first stage between 1 and 3 March, seats in the Senate were elected. In the second stage between 5 and 7 March the Chamber of Deputies was elected, and in the third and final stage from 9 to 11 March, additional Senate seats were elected. The result was a victory for the governing National Liberal Party, which won 222 of the 372 seats in the Chamber of Deputies and 111 of the 148 seats in the Senate. Both houses were combined to form a Constitutional Assembly, which approved the 1923 constitution.
General elections were held in Romania in June 1939. The Chamber of Deputies was elected on 1 June, and the Senate on the following day. They were the first elections since the introduction of the royal dictatorship of King Carol II under the 1938 constitution. Voters were presented with a single list from the National Renaissance Front, which had been the only legally permitted party in Romania since December.
Sweden held a general election in September 1920. The election was the last before universal suffrage was introduced the following year. The Social Democratic Party remained the largest party, winning 75 of the 230 seats in the Second Chamber of the Riksdag. In spite of this, the non-socialist parties got a sizeable majority in the chamber.

