| | First party | Second party | Third party |
|---|
| | |  |  | | Leader | Edmond Leburton | Leo Tindemans | Frans Grootjans |
|---|
| Party | Socialist | CVP | Open Vld |
|---|
| Leader since | Candidate for PM | Candidate for PM | 1973 |
|---|
| Last election | 25 seats, 10.40% [a] | 40 seats, 18.32% | 16 seats, 7.42% |
|---|
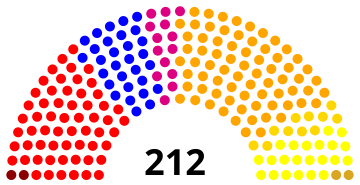
| Seats won | 59 | 50 | 30 |
|---|
| Seat change |  34 34 | 10 | 14 |
|---|
| Popular vote | 1,401,725 | 1,222,646 | 798,818 |
|---|
| Percentage | 26.66% | 23.25% | 15.19% |
|---|
| Swing | 16.26% | 4.91% | 7.77% |
|---|
| | | Fourth party | Fifth party | Sixth party |
|---|
| | |  | | | Leader | Frans Van der Elst | Charles-Ferdinand Nothomb | André Lagasse |
|---|
| Party | VU | cdH | DéFI |
|---|
| Leader since | 1955 | 1972 | 1972 |
|---|
| Last election | 21 seats, 11.11% | 15 seats, 6.20% | 12 seats, 5.43% |
|---|
| Seats won | 22 | 22 | 14 |
|---|
| Seat change | 1 | 7 | 2 |
|---|
| Popular vote | 536,287 | 478,209 | 301,303 |
|---|
| Percentage | 10.20% | 9.09% | 5.73% |
|---|
| Swing |  0.91% 0.91% | 2.89% | 0.30% |
|---|
|