Flemish Parliament
| |||||||||||||||||||||||||||||||||||||||||||||||||||||||||||||||||||||||||||||||||||||||||||||
All 124 seats in the Flemish Parliament 63 seats needed for a majority | |||||||||||||||||||||||||||||||||||||||||||||||||||||||||||||||||||||||||||||||||||||||||||||
|---|---|---|---|---|---|---|---|---|---|---|---|---|---|---|---|---|---|---|---|---|---|---|---|---|---|---|---|---|---|---|---|---|---|---|---|---|---|---|---|---|---|---|---|---|---|---|---|---|---|---|---|---|---|---|---|---|---|---|---|---|---|---|---|---|---|---|---|---|---|---|---|---|---|---|---|---|---|---|---|---|---|---|---|---|---|---|---|---|---|---|---|---|---|
| Turnout | 92.67% | ||||||||||||||||||||||||||||||||||||||||||||||||||||||||||||||||||||||||||||||||||||||||||||
| |||||||||||||||||||||||||||||||||||||||||||||||||||||||||||||||||||||||||||||||||||||||||||||
| |||||||||||||||||||||||||||||||||||||||||||||||||||||||||||||||||||||||||||||||||||||||||||||


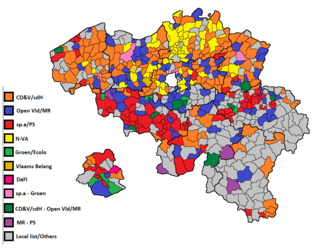
All 124 members of the Flemish Parliament were elected. The five Flemish Region provinces (West Flanders, East Flanders, Antwerp, Flemish Brabant and Limburg) each are a constituency, plus the Brussels-Capital Region where those voting for a Dutch-language party can also vote in the Flemish election.
The incumbent Peeters II Government was made up of a coalition of CD&V, N-VA and sp.a. Minister-President Kris Peeters (CD&V) consistently polled as one of the most popular politicians in Flanders. He is a candidate to succeed himself as Minister-President. Other parties did not put forward an explicit candidate to be Minister-President.
Since the elections coincide with the federal elections, a lot of the campaigning and debates have been about federal matters. Nonetheless, the sixth state reform has transferred a lot of powers from the federal state to the regional level, such as child benefits.
Other major election topics include the reform of the secondary education, and mobility around Antwerp, in particular the Oosterweel Link.
Opinion polls
| Date | Polling Firm | | VB | | | | | | Others | Lead |
|---|---|---|---|---|---|---|---|---|---|---|
| 25 May 2014 | Flemish Elections | 20.5 | 5.9 | 14.0 | 14.2 | 31.9 | 8.7 | 2.5 | 2.3 | 11.4 |
| 16 May | De Standaard | 20.0 | 8.4 | 14.4 | 13.1 | 31.8 | 9.5 | 2.6 | 0.2 | 11.8 |
| 25 Apr | De Standaard | 20.0 | 6.7 | 14.5 | 12.7 | 33.2 | 9.1 | 1.7 | 2.1 | 13.2 |
| 23 Apr | Le Soir | 17.6 | 10.3 | 13.5 | 13.5 | 32.8 | 8.7 | 3.4 | 0.2 | 15.2 |
| 15 Apr | La Libre Belgique | 16.9 | 9.9 | 13.6 | 13.5 | 32.9 | 7.6 | 4.1 | 1.5 | 16.0 |
| 21 Feb | La Libre Belgique | 17.6 | 9.8 | 14.6 | 12.8 | 32.3 | 7.3 | 3.7 | 1.9 | 14.7 |
| 13 Feb | Le Soir | 18.5 | 7.6 | 13.3 | 13.3 | 32.3 | 8.4 | 2.7 | 3.9 | 13.8 |
| 2014 | ||||||||||
| 24 Nov | La Libre Belgique | 17.9 | 9.9 | 14.1 | 12.4 | 30.8 | 8.0 | 2.0 | 4.9 | 12.9 |
| 21 Nov | Le Soir | 17.4 | 9.6 | 13.1 | 14.4 | 31.2 | 8.9 | 3.0 | 2.4 | 13.8 |
| 2 Sep | La Libre Belgique | 17.3 | 11.3 | 12.0 | 11.8 | 35.5 | 6.9 | 1.5 | 3.7 | 18.2 |
| 16 Jun | Le Soir | 15.7 | 9.4 | 13.9 | 13.2 | 35.0 | 7.7 | - | 5.1 | 19.3 |
| 25 May | La Libre Belgique | 15.9 | 12.9 | 14.1 | 12.9 | 32.8 | 6.5 | 2.5 | 2.4 | 16.9 |
| 25 May | De Standaard | 17.4 | 10.6 | 14.7 | 10.1 | 32.1 | 9.5 | 2.5 | 3.1 | 14.7 |
| 24 Mar | Le Soir | 16.7 | 10.5 | 13.6 | 12.3 | 33.6 | 7.7 | 2.8 | 2.8 | 16.9 |
| 16 Mar | Het Laatste Nieuws | 15.1 | 11.3 | 14.7 | 12.1 | 33.8 | 8.4 | - | 4.6 | 18.7 |
| 22 Feb | La Libre Belgique | 14.1 | 6.8 | 14.9 | 10.0 | 39.0 | 8.7 | 2.4 | 4.1 | 24.1 |
| 2013 | ||||||||||
| 30 Nov | La Libre Belgique | 16.5 | 10.7 | 14.4 | 9.6 | 35.4 | 8.0 | 3.6 | 1.8 | 18.9 |
| 14 Oct 2012 | Provincial elections | 21.4 | 8.9 | 13.6 | 14.6 | 28.5 | 8.3 | 2.1 | 2.5 | 7.1 |
| 14 Sep | De Standaard | 18.5 | 9.5 | 14.5 | 10.7 | 36.3 | 7.9 | - | 2.6 | 17.8 |
| 5 Sep | La Libre Belgique | 13.4 | 10.0 | 13.5 | 11.6 | 40.1 | 7.5 | 2.7 | 1.2 | 26.6 |
| 2012 | ||||||||||
| 2 Dec | La Libre Belgique | 12.6 | 8.4 | 13.9 | 12.6 | 39.8 | 7.5 | - | 5.2 | 25.9 |
| 2011 | ||||||||||
| 10 Jun 2010 | Federal Elections | 17.6 | 12.6 | 15.0 | 14.0 | 28.2 | 7.1 | 1.3 | 4.1 | 10.6 |
| 2 Apr | De Standaard | 22.2 | 14.0 | 15.9 | 17.6 | 14.8 | 8.1 | - | 7.4 | 4.6 |
| 2010 | ||||||||||
| 9 Oct | De Standaard | 24.4 | 12.8 | 15.0 | 16.7 | 13.5 | 8.5 | - | 9.1 | 7.7 |
| 7 Jun 2009 | Flemish Elections | 22.9 | 15.3 | 15.3 | 15.0 | 13.1 | 6.8 | 1.0 | 10.7 | 7.6 |
Main candidates
Results

The winner is by far the N-VA, especially compared to the 2009 regional elections but also to the 2010 federal elections. Groen also gained votes, whereas CD&V, sp.a, Open Vld and especially Vlaams Belang lost votes. LDD did not compete and is no longer in parliament.
The Union of Francophones (UF) narrowly reached the 5% election threshold in Flemish Brabant, thereby keeping their only seat.
The incumbent government parties N-VA, CD&V and sp.a would have a large majority; it was however not expected that sp.a and N-VA will be together in a coalition.
Initially, N-VA and CD&V were negotiating to form a Flemish Government. However, since Open Vld was needed for a federal coalition and they wanted to be in both or neither governments, they joined the Flemish negotiations. On 25 July 2014, the new Bourgeois Government was sworn in, led by Minister-President Geert Bourgeois (N-VA). Outgoing Minister-President Kris Peeters (CD&V) became minister in the federal Michel Government.
 | ||||||||
|---|---|---|---|---|---|---|---|---|
| Party | Votes | % | Seats | |||||
| Flanders | Brussels | Total | +/- | |||||
| New Flemish Alliance | 1,339,943 | 31.88 | 42 | 1 | 43 | |||
| Christian Democratic and Flemish | 860,685 | 20.48 | 26 | 1 | 27 | |||
| Open Flemish Liberals and Democrats | 594,464 | 14.15 | 17 | 2 | 19 | |||
| Socialist Party Differently | 587,901 | 13.99 | 17 | 1 | 18 | |||
| Green | 365,779 | 8.70 | 9 | 1 | 10 | |||
| Flemish Interest | 248,840 | 5.92 | 6 | 0 | 6 | |||
| Workers' Party of Belgium+ | 106,114 | 2.53 | 0 | 0 | 0 | |||
| Union of Francophones | 34,741 | 0.83 | 1 | 0 | 1 | |||
| Pirate Party | 25,986 | 0.62 | 0 | 0 | 0 | |||
| Gezonde Evenwichtige Nieuwe Open Eerlijke Groepering | 10,612 | 0.25 | 0 | 0 | 0 | |||
| ROSSEM | 9,937 | 0.24 | 0 | 0 | 0 | |||
| Recht Op Een Leven | 5,228 | 0.12 | 0 | 0 | 0 | |||
| Vlaamse Christen Partij | 5,026 | 0.12 | 0 | 0 | 0 | |||
| Maakbare Maatschappij | 3,227 | 0.08 | 0 | 0 | 0 | |||
| Sociaal Democraten & Progressieven | 2,853 | 0.07 | 0 | 0 | 0 | |||
| Vrijheid, Intimiteit, Thuis, Arbeid en Liefde | 617 | 0.01 | 0 | 0 | 0 | |||
| Pensio(e)n Plus | 482 | 0.01 | 0 | 0 | 0 | |||
| Total | 4,202,435 | 100.00 | 118 | 6 | 124 | – | ||
| Valid votes | 4,202,435 | 95.03 | ||||||
| Invalid/blank votes | 219,601 | 4.97 | ||||||
| Total votes | 4,422,036 | 100.00 | ||||||
| Registered voters/turnout | 4,779,144 | 92.53 | ||||||
| Source: Belgian Elections | ||||||||
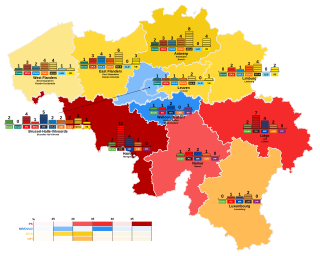
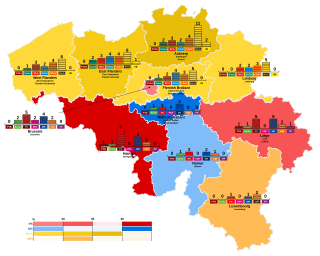
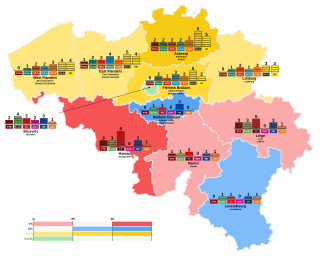
In detail
The candidate receiving the most preference votes was Liesbeth Homans (N-VA) in Antwerp, with 159,965 votes, ahead of Kris Peeters (CD&V).
The highest percentage of votes in a municipality (apart from the French-speaking list in the Brussels Periphery) was achieved by N-VA in Schilde (near Antwerp city) with 51,27% of the votes.
| Party | Total | Antwerp | Brussels | East Flanders | Flemish Brabant | Limburg | West Flanders | ||||||||||||||
|---|---|---|---|---|---|---|---|---|---|---|---|---|---|---|---|---|---|---|---|---|---|
| Votes | Perc. | Seats | Votes | Perc. | Seats | Votes | Perc. | Seats | Votes | Perc. | Seats | Votes | Perc. | Seats | Votes | Perc. | Seats | Votes | Perc. | Seats | |
| N-VA | 1,339,943 | 31.88 | 43 | 411,001 | 36.46 | 14 | 9,508 | 18.31 | 1 | 300,638 | 30.65 | 9 | 204,139 | 29.43 | 7 | 176,512 | 32.15 | 5 | 238,148 | 29.78 | 7 |
| CD&V | 860,685 | 20.48 | 27 | 225,891 | 20.04 | 7 | 6,284 | 12.10 | 1 | 179,572 | 18.31 | 5 | 118,669 | 17.11 | 4 | 127,656 | 23.25 | 4 | 202,622 | 25.34 | 6 |
| Open Vld | 594,464 | 14.15 | 19 | 108,209 | 9.60 | 3 | 12,461 | 24.00 | 2 | 169,726 | 17.30 | 5 | 133,362 | 19.23 | 4 | 66,269 | 12.07 | 2 | 104,442 | 13.06 | 3 |
| sp.a | 587,901 | 13.99 | 18 | 128,760 | 11.42 | 4 | 9,558 | 18.41 | 1 | 139,640 | 14.24 | 4 | 85,105 | 12.27 | 2 | 94,721 | 17.25 | 3 | 130,119 | 16.27 | 4 |
| Groen | 365,779 | 8.70 | 10 | 111,234 | 9.87 | 3 | 10,660 | 20.53 | 1 | 88,977 | 9.07 | 2 | 64,836 | 9.35 | 2 | 32,713 | 5.96 | 1 | 57,361 | 7.17 | 1 |
| Vlaams Belang | 248,840 | 5.92 | 6 | 79,588 | 7.06 | 2 | 2,960 | 5.70 | 0 | 62,881 | 6.41 | 2 | 30,531 | 4.40 | 0 | 32,392 | 5.90 | 1 | 40,488 | 5.06 | 1 |
| PVDA+ | 106,114 | 2.53 | 0 | 43,694 | 3.88 | 0 | — | 23,029 | 2.35 | 0 | 12,212 | 1.76 | 0 | 14,257 | 2.60 | 0 | 12,922 | 1.62 | 0 | ||
| UF | 34,741 | 0.83 | 1 | — | — | — | 34,471 | 5.01 | 1 | — | — | ||||||||||
| Piratenpartij | 25,986 | 0.62 | 0 | 7,514 | 0.67 | 0 | — | 7,142 | 0.73 | 0 | 5,572 | 0.80 | 0 | — | 5,758 | 0.72 | 0 | ||||
| GENOEG | 10,612 | 0.25 | 0 | 3,521 | 0.31 | 0 | — | 2,177 | 0.22 | 0 | 1,398 | 0.20 | 0 | 1,475 | 0.27 | 0 | 1,449 | 0.18 | 0 | ||
| R.O.S.S.E.M. | 9,937 | 0.24 | 0 | 2,733 | 0.24 | 0 | — | 2,236 | 0.23 | 0 | 1,302 | 0.19 | 0 | 1,259 | 0.23 | 0 | 2,407 | 0.30 | 0 | ||
| ROEL | 5,228 | 0.12 | 0 | 1,306 | 0.12 | 0 | — | 1,017 | 0.10 | 0 | 674 | 0.10 | 0 | 872 | 0.16 | 0 | 1,359 | 0.17 | 0 | ||
| VCP | 5,026 | 0.12 | 0 | 682 | 0.06 | 0 | — | 909 | 0.09 | 0 | 1,007 | 0.15 | 0 | 979 | 0.18 | 0 | 1,449 | 0,18 | 0 | ||
| MAMA | 3,227 | 0.08 | 0 | 3,227 | 0.29 | 0 | — | — | — | — | — | ||||||||||
| SD&P | 2,853 | 0.07 | 0 | — | — | 2,853 | 0.29 | 0 | — | — | — | ||||||||||
| V.I.T.A.L. | 617 | 0.01 | 0 | — | — | — | — | — | 617 | 0.08 | 0 | ||||||||||
| PENSIO(E)N PLUS | 482 | 0.01 | 0 | — | 482 | 0.93 | 0 | — | — | — | — | ||||||||||
| Total | 4,202,435 | 100.00 | 124 | 1,127,360 | 100.00 | 33 | 51,919 | 100.00 | 6 | 980,797 | 100.00 | 27 | 693,548 | 100.00 | 20 | 549,105 | 100.00 | 16 | 799,733 | 100.00 | 22 |