1961 Belgian general election

Last updated

1961 Belgian general election
Flag of Belgium (civil).svg
  1958 26 March 1961 1965  

212 seats in the Chamber of Representatives
 First partySecond partyThird party
  Theo Lefevre 1964b.jpg Leo Collard 1968.jpg No image.png
Leader Théo Lefèvre Léo Collard Roger Motz
Party Christian Social Socialist Liberal
Leader sinceCandidate for PM19591958
Last election104 seats, 46.50%80 seats, 35.79%20 seats, 11.05%
Seats won968420
Seat changeDecrease2.svg 8Increase2.svg 4Steady2.svg
Popular vote2,182,6421,933,424649,376
Percentage41.46%36.72%12.33%
SwingDecrease2.svg 5.04%Increase2.svg 0.93%Increase2.svg 1.28%

 Fourth partyFifth partySixth party
  No image.png No image.png No image.png
LeaderFrans Van der Elst Ernest Burnelle Jean-Marie Evrard
Party VU PVDA-PTB RN
Leader since195519541959
Last election1 seat, 1.98%2 seats, 1.89%New
Seats won551
Seat changeIncrease2.svg 4Increase2.svg 3New
Popular vote182,407162,23842,450
Percentage3.46%3.08%0.81%
SwingIncrease2.svg 1.48%Increase2.svg 1.19%New

1961 Belgian legislative election results map.svg
Chamber seat distribution by constituency

Government before election

G. Eyskens IV
CVP/PSC-Lib

Government after election

Lefèvre
CVP/PSC-BSP/PSB

General elections were held in Belgium on 26 March 1961. [1] The result was a victory for the Christian Social Party, which won 96 of the 212 seats in the Chamber of Representatives and 47 of the 106 seats in the Senate. [2] Voter turnout was 92.3%. [3] Elections for the nine provincial councils were also held.

Contents

Prior to the elections, the centre-right government of the Christian Social and Liberal Party led by Gaston Eyskens pushed through austerity measures with a law known as the Eenheidswet or Loi Unique, despite heavy strikes in the preceding weeks, especially in Wallonia. After the elections, the Christian Democrats formed a new government with the Socialist Party instead of the Liberal Party, with Théo Lefèvre as Prime Minister.

Results

Chamber of Deputies

Belgian Chamber 1961.svg
PartyVotes%Seats+/–
Christian Social Party 2,182,64241.4696–8
Belgian Socialist Party 1,933,42436.7284+4
Liberal Party 649,37612.33200
People's Union 182,4073.465+4
Communist Party of Belgium 162,2383.085+3
National Rally 42,4500.811New
Independent Party33,1740.630New
National Union of Independents12,2520.230New
National Party4,3750.080New
Liberal dissidents3,9560.080New
Walloon Unity3,4660.070New
Alleenstaande3,1010.060New
Zelfstandig2,3070.040New
Francophone Bloc1,8240.030New
Gekavemus6040.010New
Independent Workers5510.010New
Universal People4800.010New
EC Group1540.000New
Independents46,2440.881+1
Total5,265,025100.002120
Valid votes5,265,02594.46
Invalid/blank votes308,8155.54
Total votes5,573,840100.00
Registered voters/turnout6,036,16592.34
Source: Belgian Elections

Senate

Belgium Senate 1961.svg
PartyVotes%Seats+/–
Christian Social Party 2,200,32342.1247–6
Belgian Socialist Party 1,924,60536.8445+5
Liberal Party 637,92212.2111+1
Communist Party of Belgium 163,5763.1310
People's Union 159,0963.052+2
National Movement26,2110.500New
Independent Party21,4210.410New
National Union of Independents13,2840.250New
Liberal dissidents7,7110.150New
National Rally 5,4250.100New
National Party4,4570.090New
Walloon Unity3,4780.070New
Francophone Bloc1,9470.040New
Other parties18,4050.350
Independents36,6460.7000
Total5,224,507100.001060
Valid votes5,224,50793.73
Invalid/blank votes349,4756.27
Total votes5,573,982100.00
Registered voters/turnout6,036,16592.34
Source: Nohlen & Stöver, Belgian Elections

Related Research Articles

<span class="mw-page-title-main">1994 Danish general election</span>

General elections were held in Denmark on 21 September 1994. The coalition of the Social Democratic Party, the Danish Social Liberal Party and the Centre Democrats led by Poul Nyrup Rasmussen remained in power despite the Christian People's Party, which had been part of the government, failing to cross the 2% threshold and losing all four seats. Voter turnout was 84.3% in Denmark proper, 62.3% in the Faroe Islands and 56.7% in Greenland.

<span class="mw-page-title-main">1918 Dutch general election</span> Election of the members of the House of Representatives

General elections were held in the Netherlands on 3 July 1918. They were the first elections held after a series of reforms that introduced universal male suffrage and pure proportional representation, replacing the previous system using first-past-the-post voting in single member constituencies. This change was known as the Great Pacification, which also included the introduction of state financing of religious schools, and led to the start of consociational democracy.

<span class="mw-page-title-main">1922 Dutch general election</span>

General elections were held in the Netherlands on 5 July 1922. They were the first elections held under universal suffrage, which became reality after the acceptance of a proposal by Henri Marchant in 1919 that gave women full voting rights. Almost all major parties had a woman elected. The number of female representatives increased from one to seven. Only the Anti-Revolutionary Party principally excluded women from the House of Representatives. Another amendment to the electoral law increased the electoral threshold from 0.5% to 0.75%, after six parties had won seats with less than 0.75% of the vote in the previous elections.

<span class="mw-page-title-main">1988 Danish general election</span>

General elections were held in Denmark on 10 May 1988, just seven months after the last elections. Prime Minister Poul Schlüter chose to call for an election after the Conservative People's Party-led government fell short of a majority in a foreign policy issue after they failed to come to an agreement with the Social Democrats. In a parliamentary debate, Prime Minister Poul Schlüter accused Svend Auken of breaking a political deal between the two of them whilst Auken accused Schlüter of lying to the public.

<span class="mw-page-title-main">1973 Danish general election</span>

General elections were held in Denmark on 4 December 1973 and in the Faroe Islands on 13 December. It has since been referred to as the Landslide Election, as five new or previously unrepresented parties won seats, and more than half the members of the parliament were replaced. The Social Democratic Party, which had led a minority government until this election, lost a third of their seats. After the election Poul Hartling, the leader of the liberal Venstre, formed the smallest minority government in Denmark's history with only 22 seats, supported by the Progress Party, the Conservative People's Party, the Social Liberal Party, the Centre Democrats and the Christian People's Party.

Parliamentary elections were held in Norway on 9 and 10 September 1973. The Labour Party remained the largest party, winning 62 of the 155 seats in the Storting.

<span class="mw-page-title-main">1965 Norwegian parliamentary election</span>

Parliamentary elections were held in Norway on 12 and 13 September 1965. The Labour Party remained the largest party, winning 68 of the 150 seats. However, the four non-socialist parties succeeded in winning a majority between them and forming a government. Per Borten, the leader of the Centre Party, became Prime Minister.

<span class="mw-page-title-main">1961 Norwegian parliamentary election</span>

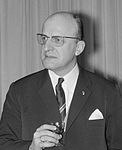
Parliamentary elections were held in Norway on 11 September 1961. The result was a victory for the Labour Party, which won 74 of the 150 seats in the Storting. Although it lost the absolute majority it had held since 1945, the Labour Party was able to continue in government.

<span class="mw-page-title-main">1912 German federal election</span>

Federal elections were held in Germany on 12 January 1912. Although the Social Democratic Party (SPD) had received the most votes in every election since 1890, it had never won the most seats, and in the 1907 elections, it had won fewer than half the seats won by the Centre Party despite receiving over a million more votes. However, the 1912 elections saw the SPD retain its position as the most voted-for party and become the largest party in the Reichstag, winning 110 of the 397 seats.

<span class="mw-page-title-main">1985 Swedish general election</span>

General elections were held in Sweden on 15 September 1985. The Swedish Social Democratic Party remained the largest party in the Riksdag, winning 159 of the 349 seats. Its leader, Olof Palme, kept his position as Prime Minister. He would retain this position successfully until his assassination in 1986.

<span class="mw-page-title-main">2002 Macedonian parliamentary election</span>

Parliamentary elections were held in Macedonia on 15 September 2002. The result was a victory for the Together for Macedonia, an alliance of the Social Democratic Union of Macedonia, the Liberal Democratic Party, the Democratic Party of Turks, the Democratic League of Bosniaks, the United Party of Romas in Macedonia, the Democratic Party of Serbs, the Democratic Union of the Vlachs of Macedonia, the Workers-Peasant Party, the Socialist Christian Party of Macedonia and the Green Party of Macedonia, which won 60 of the 120 seats in the Assembly.

General elections were held in Luxembourg on 21 October 1945. They were the first elections held after the German occupation during World War II. As a result of the war, the political alliances of the interwar period had been ended. In their place were new parties; the Christian Social People's Party, the Luxembourg Socialist Workers' Party, and the Patriotic and Democratic Group in place of the Party of the Right, Socialist Party, and Radical Liberal Party respectively. It is regarded as a realigning election, as the election established the party political order, with four established parties, that would be maintained until 1974.

<span class="mw-page-title-main">April 1920 Danish Folketing election</span>

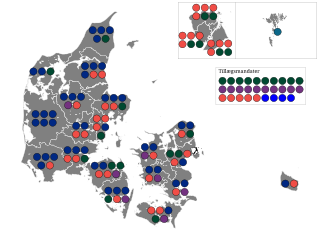
Folketing elections were held in Denmark on 26 April 1920, except in the Faroe Islands, where they were held on 20 May. The election campaign was the most aggressive and bitter in Denmark in the 20th century. Voter turnout was 80.6% in Denmark proper and 58.8% in the Faroe Islands.

<span class="mw-page-title-main">1946 Belgian general election</span>

General elections were held in Belgium on 17 February 1946. The result was a victory for the Christian Social Party, which won 92 of the 202 seats in the Chamber of Representatives and 51 of the 101 seats in the Senate. Voter turnout was 90.3%.

<span class="mw-page-title-main">1954 Belgian general election</span>

General elections were held in Belgium on 11 April 1954. The dominant Christian Social Party won 95 of the 212 seats in the Chamber of Representatives and 49 of the 106 seats in the Senate. Voter turnout was 93.2%. Elections for the nine provincial councils were also held.

<span class="mw-page-title-main">1958 Belgian general election</span>

General elections were held in Belgium on 1 June 1958. The result was a victory for the Christian Social Party, which won 104 of the 212 seats in the Chamber of Representatives and 53 of the 106 seats in the Senate. Voter turnout was 93.6% in the Chamber election and 93.7% in the Senate election. Elections for the nine provincial councils were also held.

<span class="mw-page-title-main">1965 Belgian general election</span>

General elections were held in Belgium on 23 May 1965. The result was a victory for the Christian Social Party, which won 77 of the 212 seats in the Chamber of Representatives and 44 of the 106 seats in the Senate. Voter turnout was 91.6%. Elections for the nine provincial councils were also held.

<span class="mw-page-title-main">1968 Belgian general election</span>

General elections were held in Belgium on 31 March 1968. The Christian Social Party remained the largest party. Voter turnout was 90.0%. Elections for the nine provincial councils were also held.

<span class="mw-page-title-main">1898 Belgian general election</span>

Partial legislative elections were held in Belgium on 22 May 1898, with run-off elections held on 29 May. Under the alternating system, elections for the Chamber of Representatives were held in only four out of the nine provinces: Hainaut, Limburg, Liège and East Flanders. Thus, only 75 seats out of the 152 seats in the Chamber of Representatives were up for election. The Catholic Party retained their absolute majority.

Parliamentary elections were held in Hungary on 25 and 26 January 1920. However, they were only held in 164 districts. After the Treaty of Trianon was signed, the 44 districts previously occupied by Romania voted between 13 June and 5 July, whilst the 11 districts occupied by Serbia did not vote until 30 and 31 October 1921. The election was held with compulsory voting. In protest at this and other changes to the franchise that left 60% of the voting age population unable to vote, the Hungarian Social Democratic Party boycotted the elections, and called for its supporters to cast invalid votes, resulting in an unusually high number of blank or invalid votes – 12% in the January elections and over 20% in Budapest and other major cities.

References

  1. Dieter Nohlen & Philip Stöver (2010) Elections in Europe: A data handbook, p289 ISBN   978-3-8329-5609-7
  2. Nohlen & Stöver, pp309-311
  3. Nohlen & Stöver, p291