| |||||||||||||||||||||||||||||||||||||||||||||||||||||||||||||||||
| |||||||||||||||||||||||||||||||||||||||||||||||||||||||||||||||||
All 100 seats in the House of Representatives 51 seats needed for a majority | |||||||||||||||||||||||||||||||||||||||||||||||||||||||||||||||||
Turnout | 92.68% ( 1.33pp) | ||||||||||||||||||||||||||||||||||||||||||||||||||||||||||||||||
---|---|---|---|---|---|---|---|---|---|---|---|---|---|---|---|---|---|---|---|---|---|---|---|---|---|---|---|---|---|---|---|---|---|---|---|---|---|---|---|---|---|---|---|---|---|---|---|---|---|---|---|---|---|---|---|---|---|---|---|---|---|---|---|---|---|
This lists parties that won seats. See the complete results below.
|
Part of the Politics series |
Politicsportal |
General elections were held in the Netherlands on 3 July 1929. [1] The Roman Catholic State Party remained the largest party in the House of Representatives, winning 30 of the 100 seats. [2]
Party | Votes | % | Seats | +/– | |
---|---|---|---|---|---|
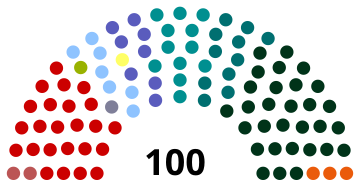
Roman Catholic State Party | 1,001,589 | 29.64 | 30 | 0 | |
Social Democratic Workers' Party | 804,714 | 23.81 | 24 | 0 | |
Anti-Revolutionary Party | 391,832 | 11.59 | 12 | –1 | |
Christian Historical Union | 354,548 | 10.49 | 11 | 0 | |
Liberal State Party | 249,105 | 7.37 | 8 | –1 | |
Free-thinking Democratic League | 208,979 | 6.18 | 7 | 0 | |
Reformed Political Party | 76,709 | 2.27 | 3 | +1 | |
Communist Party Holland | 67,541 | 2.00 | 2 | +1 | |
Middle Party for City and Country | 39,955 | 1.18 | 1 | New | |
Hervormd Gereformeerde Staatspartij | 35,931 | 1.06 | 1 | 0 | |
Farmers' League Left | 34,805 | 1.03 | 1 | 0 | |
Roman Catholic People's Party | 23,804 | 0.70 | 0 | –1 | |
Revolutionary Socialist Party | 21,812 | 0.65 | 0 | New | |
Federative Union | 17,509 | 0.52 | 0 | New | |
Christian Democratic Union | 12,780 | 0.38 | 0 | 0 | |
Democratic Party | 9,083 | 0.27 | 0 | 0 | |
Small Middle Class Party | 4,295 | 0.13 | 0 | New | |
National Farmers' League | 4,218 | 0.12 | 0 | New | |
Union of Nationalists | 3,685 | 0.11 | 0 | New | |
Roman Catholic Farmers' Party | 3,369 | 0.10 | 0 | New | |
General Welfare Party | 2,256 | 0.07 | 0 | New | |
Social Democratic People's Party | 2,156 | 0.06 | 0 | New | |
Christian Workers Party | 1,724 | 0.05 | 0 | New | |
Van Nunen List | 1,133 | 0.03 | 0 | New | |
Anti-Compulsory Voting Party | 1,125 | 0.03 | 0 | New | |
Social Economic People's Party | 940 | 0.03 | 0 | New | |
Main and Manual Workers | 845 | 0.03 | 0 | New | |
Invalids' Party | 715 | 0.02 | 0 | New | |
Verweij List | 623 | 0.02 | 0 | New | |
People's Party | 449 | 0.01 | 0 | New | |
Kiesvereniging Algemeen Belang | 417 | 0.01 | 0 | New | |
Neutral People's Party | 342 | 0.01 | 0 | New | |
Siedenburg List | 314 | 0.01 | 0 | New | |
Free Christian Party | 103 | 0.00 | 0 | New | |
International People's Party | 98 | 0.00 | 0 | New | |
Total | 3,379,503 | 100.00 | 100 | 0 | |
Valid votes | 3,379,503 | 95.41 | |||
Invalid/blank votes | 162,482 | 4.59 | |||
Total votes | 3,541,985 | 100.00 | |||
Registered voters/turnout | 3,821,612 | 92.68 | |||
Source: Nederlandse verkiezingsuitslagen [3] |
General elections were held in the Netherlands on 25 June 1952. The Catholic People's Party and the Labour Party both won 30 of the 100 seats in the House of Representatives. It was the first time since 1913 that the Catholic People's Party and its predecessors had not received a plurality of the vote.
General elections were held in the Netherlands on 13 June 1956. For the first time, the Labour Party (PvdA) emerged as the largest party, winning 50 of the 150 seats in the House of Representatives.
Early parliamentary elections were held in Austria on 24 November 2002, after internal divisions in the Freedom Party of Austria (FPÖ) culminating in the Knittelfeld Putsch led to the resignation of several leading FPÖ members. The Austrian People's Party (ÖVP) emerged as the largest party, winning 79 of the 183 seats, the first time it had been the largest party in the National Council since 1966. It continued its coalition government with the FPÖ, which lost almost two-thirds of its seats. Voter turnout was 84%.
The Greens of Andorra is a green political party in Andorra.
General elections were held in Sweden on 17 and 18 September 1932. The Swedish Social Democratic Party remained the largest party, winning 104 of the 230 seats in the Andra kammaren of the Riksdag. The party returned to government after six years in opposition, marking the beginning of 44 years of near-uninterrupted rule. This was also the first time the socialist parties received an overall majority of the elected parties' popular vote, although the Hansson cabinet still required cross-aisle co-operation to govern since the centre-right parties won 118 out of 230 seats.
General elections were held in Sweden on 20 September 1964. The Swedish Social Democratic Party remained the largest party, winning 113 of the 233 seats in the Andra kammaren of the Riksdag. Tage Erlander's Social Democratic government was returned to power.
Senate elections were held in Greece on 21 April 1929. The Senate was a new institution introduced with the Greek Constitution of 1927 and these were the first elections for it. The result was a victory for the Liberal Party, which won 64 of the 92 directly-elected seats. It was regarded as a public approval of the policies of Prime Minister Eleftherios Venizelos.
General elections were held in Luxembourg on 18 June 1989. The Christian Social People's Party remained the largest party, winning 22 of the 60 seats in the Chamber of Deputies. It continued the coalition government with the Luxembourg Socialist Workers' Party.
Folketing elections were held in Denmark on 24 April 1929, except in the Faroe Islands where they were held on 29 May. The Social Democratic Party remained the largest in the Folketing, with 61 of the 149 seats. Voter turnout was 79.7% in Denmark proper and 58.0% in the Faroes. Social Democrat Thorvald Stauning returned to the Prime Ministership by forming a coalition government with the Social Liberals, a position he would hold until 1942.
General elections were held in Belgium on 17 February 1946. The result was a victory for the Christian Social Party, which won 92 of the 202 seats in the Chamber of Representatives and 51 of the 101 seats in the Senate. Voter turnout was 90.3%.
General elections were held in Belgium on 26 March 1961. The result was a victory for the Christian Social Party, which won 96 of the 212 seats in the Chamber of Representatives and 47 of the 106 seats in the Senate. Voter turnout was 92.3%. Elections for the nine provincial councils were also held.
General elections were held in Malta between 12 and 14 June 1971. The Malta Labour Party emerged as the largest party, winning 28 of the 55 seats.
Early general elections were held in Sweden 5 and 13 September 1914, the second that year. Although the General Electoral League received the most votes, the Swedish Social Democratic Party emerged as the largest party, winning 87 of the 230 seats in the Andra kammaren, and have managed to remain so in every subsequent Swedish election.
General elections were held in Belgium on 26 May 1929. The result was a victory for the Catholic Party, which won 71 of the 187 seats in the Chamber of Representatives. Voter turnout was 94.0%.
General elections were held in Liechtenstein on 15 February 1953. The Progressive Citizens' Party won eight of the 15 seats in the Landtag, but remained in coalition with the Patriotic Union. This was the first and only election contested by the Workers' and Peasants' Party.
General elections were held in Liechtenstein on 25 March 1962. The Progressive Citizens' Party won eight of the 15 seats in the Landtag, but remained in coalition with the Patriotic Union. This was the first election contested by the Christian Social Party.
General elections were held in Portugal on 28 April 1918, following a coup by Sidónio Pais in December 1917. The elections were boycotted by the Democratic Party, the Evolutionist Party and the Republican Union, who had won over 90% of the seats in the 1915 elections.
The German-Baltic Party was a political party in Estonia representing the German minority.
The Landlords' Party, also known as the House Owners' Party, was a political party in Estonia.
The Estonian Socialist Workers' Party was a political party in Estonia.