| ||||||||||||||||||||||
324 seats to the Bihar Legislative Assembly 163 seats needed for a majority  | ||||||||||||||||||||||
|---|---|---|---|---|---|---|---|---|---|---|---|---|---|---|---|---|---|---|---|---|---|---|
| Registered | 43,880,751 | |||||||||||||||||||||
| Turnout | 56.27% | |||||||||||||||||||||
  | ||||||||||||||||||||||
  | ||||||||||||||||||||||
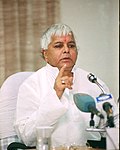
Bihar Legislative Assembly election, 1985 was held in March 1985 to elect members to the Bihar Legislative Assembly. The Indian National Congress won a majority of seats and the popular vote and Bindeshwari Dubey became the new Chief Minister of Bihar. [1]
|   | |||||||||
|---|---|---|---|---|---|---|---|---|---|
| Party | Party Flag | Seats Contested | Seats Won | Popular Vote | Percentage | ||||
| Indian National Congress | 323 | 196 | 9,558,562 | 39.30% | |||||
| Lok Dal |   | 261 | 46 | 3,573,173 | 14.69% | ||||
| Bharatiya Janata Party | 234 | 16 | 1,833,275 | 7.54% | |||||
| Janata Party |   | 229 | 13 | 1,754,705 | 7.21% | ||||
| Communist Party of India |   | 167 | 12 | 2,154,066 | 8.86% | ||||
| Jharkhand Mukti Morcha |   | 57 | 9 | 443,822 | 1.82% | ||||
| Communist Party of India (Marxist) |   | 44 | 1 | 392,375 | 1.61% | ||||
| Indian Congress (Socialist) |   | 59 | 1 | 160,159 | 0.66% | ||||
| Socialist Unity Centre of India |   | 1 | 1 | 17,890 | 0.07% | ||||
| Independents |   | 2804 | 29 | 4,349,057 | 17.88% | ||||
| Total | 4237 | 324 | 24,323,868 | ||||||
Source: [2]