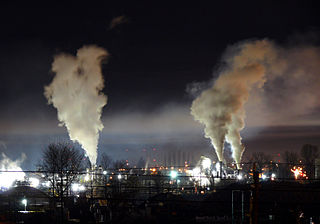
Smog, or smoke fog, is a type of intense air pollution. The word "smog" was coined in the early 20th century, and is a portmanteau of the words smoke and fog to refer to smoky fog due to its opacity, and odor. The word was then intended to refer to what was sometimes known as pea soup fog, a familiar and serious problem in London from the 19th century to the mid-20th century, where it was commonly known as a London particular or London fog. This kind of visible air pollution is composed of nitrogen oxides, sulfur oxide, ozone, smoke and other particulates. Man-made smog is derived from coal combustion emissions, vehicular emissions, industrial emissions, forest and agricultural fires and photochemical reactions of these emissions.

Ground-level ozone (O3), also known as surface-level ozone and tropospheric ozone, is a trace gas in the troposphere (the lowest level of the Earth's atmosphere), with an average concentration of 20–30 parts per billion by volume (ppbv), with close to 100 ppbv in polluted areas. Ozone is also an important constituent of the stratosphere, where the ozone layer (2 to 8 parts per million ozone) exists which is located between 10 and 50 kilometers above the Earth's surface. The troposphere extends from the ground up to a variable height of approximately 14 kilometers above sea level. Ozone is least concentrated in the ground layer (or planetary boundary layer) of the troposphere. Ground-level or tropospheric ozone is created by chemical reactions between NOx gases (oxides of nitrogen produced by combustion) and volatile organic compounds (VOCs). The combination of these chemicals in the presence of sunlight form ozone. Its concentration increases as height above sea level increases, with a maximum concentration at the tropopause. About 90% of total ozone in the atmosphere is in the stratosphere, and 10% is in the troposphere. Although tropospheric ozone is less concentrated than stratospheric ozone, it is of concern because of its health effects. Ozone in the troposphere is considered a greenhouse gas, and as such contribute to global warming. as reported in IPCC reports. Actually, tropospheric ozone is considered the third most important greenhouse gas after CO2 and CH4, as indicated by estimates of its radiative forcing.

Air pollution is a concern in British Columbia, Canada because of its effects on health and visibility. Air quality is influenced in British Columbia(BC) by numerous mountain ranges and valleys, which complicate atmospheric pollution dispersion and can lead to high concentrations of pollutants such as particulate matter from wood smoke.

The U.S. National Ambient Air Quality Standards are limits on atmospheric concentration of six pollutants that cause smog, acid rain, and other health hazards. Established by the United States Environmental Protection Agency (EPA) under authority of the Clean Air Act, NAAQS is applied for outdoor air throughout the country.

An air quality index (AQI) is an indicator developed by government agencies to communicate to the public how polluted the air currently is or how polluted it is forecast to become. As air pollution levels rise, so does the AQI, along with the associated public health risk. Children, the elderly and individuals with respiratory or cardiovascular problems are typically the first groups affected by poor air quality. When the AQI is high, governmental bodies generally encourage people to reduce physical activity outdoors, or even avoid going out altogether. When wildfires result in a high AQI, the use of a mask outdoors and an air purifier indoors are also encouraged.

The Pollutant Standards Index (PSI) is a type of air quality index used in Singapore, which is a number used to indicate the level of pollutants in air. Initially PSI was based on five air pollutants, but since 1 April 2014 it has also included fine particulate matter (PM2.5).

Air pollution in Hong Kong is considered a serious problem. In 2004, visibility was less than eight kilometers for 30 per cent of the year. Cases of asthma and bronchial infections have soared due to reduced air quality. However, in recent years, the hours of reduced visibility in Hong Kong have decreased by significant amounts compared to the previous ten years.

Air pollution is the contamination of air due to the presence of substances called pollutants in the atmosphere that are harmful to the health of humans and other living beings, or cause damage to the climate or to materials. It is also the contamination of the indoor or outdoor environment either by chemical, physical, or biological agents that alters the natural features of the atmosphere. There are many different types of air pollutants, such as gases, particulates and biological molecules. Air pollution can cause diseases, allergies, and even death to humans; it can also cause harm to other living organisms such as animals and crops, and may damage the natural environment or built environment. Air pollution can be caused by both human activities and natural phenomena.
Air pollution is the introduction of chemicals, particulate matter, or biological materials into the atmosphere that cause harm or discomfort to humans or other living organisms, or damage ecosystems. Health problems attributed to air pollution include premature death, cancer, organ failure, infections, behavioral changes, and other diseases. These health effects are not equally distributed across the U.S. population; there are demographic disparities by race, ethnicity, socioeconomic status, and education. Air pollution can derive from natural sources, such as wildfires and volcanoes, or from anthropogenic sources. Anthropogenic air pollution has affected the United States since the beginning of the Industrial Revolution.
The Índice Metropolitano de la Calidad del Aire or IMECA, in English meaning the Metropolitan Index of Air Quality, is the reference value system for the levels of air pollution in the Mexico City Metropolitan Area, within the Valley of Mexico.

Air quality laws govern the emission of air pollutants into the atmosphere. A specialized subset of air quality laws regulate the quality of air inside buildings. Air quality laws are often designed specifically to protect human health by limiting or eliminating airborne pollutant concentrations. Other initiatives are designed to address broader ecological problems, such as limitations on chemicals that affect the ozone layer, and emissions trading programs to address acid rain or climate change. Regulatory efforts include identifying and categorising air pollutants, setting limits on acceptable emissions levels, and dictating necessary or appropriate mitigation technologies.

Air Pollution in Mexico City has been of concern to the city's population and health officials for decades. In the 20th century, Mexico City's population rapidly increased as industrialization brought thousands of migrants from all over the world. Such a rapid and unexpected growth led to the UN declaring Mexico City as the most polluted city in the world in 1992. This was partly due to Mexico City's high altitude, which causes its oxygen levels to be 25% lower. Carbon-based fuels also do not combust completely. Other factors include the proliferation of vehicles, rapid industrial growth, and the population boom. The Mexican government has several active plans to reduce emission levels which require citizen participation, vehicular restrictions, increase of green areas, and expanded bicycle accessibility.
Air pollution is the release of pollutants into the air that are detrimental to human health and the Earth. In Canada, air pollution is regulated by standards set by the Canadian Council of Ministers of the Environment (CCME), an inter-governmental body of federal, provincial and territorial Ministers responsible for the environment. Air pollution from the United States and to lesser extent Canada; caused by metal smelting, coal-burning for utilities, and vehicle emissions has resulted in acid rain, has severely impacted Canadian waterways, forest growth, and agricultural productivity.

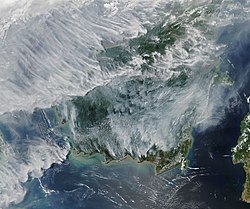
Air pollution has been an ongoing problem in many countries in the Southeast Asia region, and Malaysia is one of the worst affected. Haze has been a major issue for the country, driven by slash and burn practices by farmers and peat fires blown by the wind from Indonesia.
The Air Quality Health Index (AQHI) is a scale designed in Canada to help understand the impact of air quality on health. It is a health protection tool used to make decisions to reduce short-term exposure to air pollution by adjusting activity levels during increased levels of air pollution. The Air Quality Health Index also provides advice on how to improve air quality by proposing behavioral change to reduce the environmental footprint. This index pays particular attention to people who are sensitive to air pollution. It provides them with advice on how to protect their health during air quality levels associated with low, moderate, high and very high health risks.
The first Canadian National Ambient Air Quality Objectives were developed in the mid-1970s. These objectives were set for various air pollutants. The NAAQO had three levels indicating severity and also evaluated effect levels.

Air pollution measurement is the process of collecting and measuring the components of air pollution, notably gases and particulates. The earliest devices used to measure pollution include rain gauges, Ringelmann charts for measuring smoke, and simple soot and dust collectors known as deposit gauges. Modern air pollution measurement is largely automated and carried out using many different devices and techniques. These range from simple absorbent test tubes known as diffusion tubes through to highly sophisticated chemical and physical sensors that give almost real-time pollution measurements, which are used to generate air quality indexes.
Tehran, the capital city of Iran, suffers from severe air pollution, and it is located near three major fault lines, while being the most populous region of the country. The officials have created financial incentives to encourage around 5 million citizens to leave the city. On December 16, 2019 Tehran had its highest air pollution index of 181.

The World Health Organization guidelines were most recently updated in 2021. The guidelines offer guidance about these air pollutants: particulate matter (PM), ozone (O3), nitrogen dioxide (NO2), sulfur dioxide (SO2) and carbon monoxide (CO). The WHO first released the air quality guidelines in 1987, then updated them in 1997. The reports provide guidelines intending to give guidelines to reduce the health effects of air pollution.
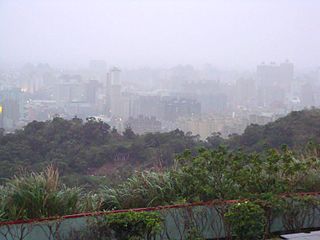
Air pollution in Taiwan is mostly derived from sources of domestic combustion, primarily the burning of fossil fuels. Taiwan's topography has been noted to be a contributing factor to its air pollution problem, leading to poor dispersal and trapping pollutants. Taipei, Taiwan's capital and largest city for example, is surrounded by mountains, and other industrial centers along the northern and western coasts of Taiwan are surrounded by high mountains.