Elections to Allerdale Borough Council were held on 3 May 2007. The whole council was up for election and the council stayed under no overall control.
Allerdale is a non-metropolitan district of Cumbria, England, with borough status. Its council is based in Workington and the borough has a population of 93,492 according to the 2001 census, increasing to 96,422 at the 2011 Census.
Party | Seats | Gains | Losses | Net gain/loss | Seats % | Votes % | Votes | +/− | |
---|---|---|---|---|---|---|---|---|---|
Labour | 21 | 1 | 7 | -6 | 37.5 | 45.3 | 17,350 | +1.3% | |
Conservative | 19 | 5 | 1 | +4 | 33.9 | 21.1 | 8,076 | +1.5% | |
Independent | 12 | 4 | 1 | +3 | 21.4 | 25.5 | 9,775 | +2.4% | |
Liberal Democrat | 4 | 1 | 2 | -1 | 7.1 | 4.1 | 1,579 | -8.3% | |
BNP | 0 | 0 | 0 | 0 | 0 | 2.9 | 1,102 | +2.1% | |
Green | 0 | 0 | 0 | 0 | 0 | 1.1 | 405 | +1.1% |
9 Conservative, 4 Labour, 1 Independent and 1 Liberal Democrat candidates were unopposed.
Party | Candidate | Votes | % | ± | |
---|---|---|---|---|---|
Labour | Alan Smith | 874 | |||
Conservative | Samuel Standage | 767 | |||
Conservative | Stephen Coates | 745 | |||
Labour | Christine Smith | 695 | |||
Conservative | Alan Tyson | 666 | |||
Labour | Jonathon Nagle | 642 | |||
Turnout | 4,389 | 49 | +13 | ||
Labour hold | Swing | ||||
Conservative hold | Swing | ||||
Conservative gain from Labour | Swing | ||||
Party | Candidate | Votes | % | ± | |
---|---|---|---|---|---|
Independent | David Wilson | 490 | |||
Independent | Audrey Tinnion | 483 | |||
Labour | Gerald Sewell | 424 | |||
Labour | Henry Barker | 318 | |||
Turnout | 1,715 | 38 | -2 | ||
Independent hold | Swing | ||||
Independent gain from Labour | Swing | ||||
Party | Candidate | Votes | % | ± | |
---|---|---|---|---|---|
Independent | Joseph Mumberson | uncontested | |||
Independent hold | Swing |
Party | Candidate | Votes | % | ± | |
---|---|---|---|---|---|
Conservative | Eric Nicholson | 659 | |||
Labour | John Ardron | 638 | |||
Conservative | Adrian Davis-Johnston | 637 | |||
Labour | Ken McDonald | 523 | |||
BNP | Nigel Williamson | 137 | |||
Turnout | 2,594 | 47 | |||
Conservative gain from Labour | Swing | ||||
Labour hold | Swing |
Party | Candidate | Votes | % | ± | |
---|---|---|---|---|---|
Conservative | Margaret Jackson | 673 | |||
Conservative | Les Lytollis | 571 | |||
Labour | Isabel Burns | 360 | |||
Labour | Phil Graham | 320 | |||
Turnout | 1,924 | 36 | +4 | ||
Conservative hold | Swing | ||||
Conservative hold | Swing |
Party | Candidate | Votes | % | ± | |
---|---|---|---|---|---|
Liberal Democrat | Heather McIntosh | 290 | 51.6 | +18.6 | |
Labour | Maureen Rourke | 272 | 48.4 | -18.6 | |
Majority | 18 | 3.2 | |||
Turnout | 562 | 49 | +3 | ||
Liberal Democrat gain from Labour | Swing | ||||
Party | Candidate | Votes | % | ± | |
---|---|---|---|---|---|
Conservative | Joseph Milburn | 458 | 68.3 | ||
Green | Jill Perry | 213 | 31.7 | ||
Majority | 245 | 36.6 | |||
Turnout | 671 | 53 | +4 | ||
Conservative hold | Swing |
Party | Candidate | Votes | % | ± | |
---|---|---|---|---|---|
Conservative | Chris Garrard | uncontested | |||
Conservative hold | Swing |
Party | Candidate | Votes | % | ± | |
---|---|---|---|---|---|
Conservative | Timothy Heslop | uncontested | |||
Conservative hold | Swing |
Party | Candidate | Votes | % | ± | |
---|---|---|---|---|---|
Labour | Louise Bell | 401 | |||
Labour | John Colhoun | 338 | |||
Conservative | Tony North | 229 | |||
Independent | David Thomas | 197 | |||
Green | Geoff Smith | 192 | |||
Turnout | 1,357 | 36 | |||
Labour hold | Swing | ||||
Labour hold | Swing |
Party | Candidate | Votes | % | ± | |
---|---|---|---|---|---|
Labour | Janice Wood | 635 | |||
Labour | Martin Wood | 580 | |||
BNP | Martin Wingfield | 342 | |||
Turnout | 1,557 | 35 | |||
Labour hold | Swing | ||||
Labour hold | Swing |
Party | Candidate | Votes | % | ± | |
---|---|---|---|---|---|
Labour | Carl Holding | 610 | |||
Labour | Carni McCarron-Holmes | 572 | |||
BNP | Tina Wingfield | 276 | |||
Turnout | 1,458 | 37 | |||
Labour hold | Swing | ||||
Labour hold | Swing |
Party | Candidate | Votes | % | ± | |
---|---|---|---|---|---|
Labour | Peter Kendall | uncontested | |||
Labour hold | Swing |
Party | Candidate | Votes | % | ± | |
---|---|---|---|---|---|
Liberal Democrat | Ian Francis | 610 | |||
Liberal Democrat | Allan Caine | 594 | |||
Labour | Merjorie Rae | 534 | |||
Independent | Hilary Harrington | 363 | |||
Turnout | 2,101 | 40 | +6 | ||
Liberal Democrat hold | Swing | ||||
Liberal Democrat hold | Swing |
Party | Candidate | Votes | % | ± | |
---|---|---|---|---|---|
Conservative | Tony Markley | 324 | 73.1 | +35.8 | |
Labour | Mark Hayhurst | 119 | 26.7 | +1.6 | |
Majority | 205 | 46.4 | +34.2 | ||
Turnout | 443 | 34 | +4 | ||
Conservative hold | Swing |
Party | Candidate | Votes | % | ± | |
---|---|---|---|---|---|
Labour | Denstone Kemp | uncontested | |||
Conservative | Ron Munby | uncontested | |||
Liberal Democrat | David Robinson | uncontested | |||
Labour hold | Swing | ||||
Conservative hold | Swing | ||||
Liberal Democrat hold | Swing |
Party | Candidate | Votes | % | ± | |
---|---|---|---|---|---|
Conservative | Vaughan Hodgson | uncontested | |||
Conservative gain from Liberal Democrat | Swing | ||||
Party | Candidate | Votes | % | ± | |
---|---|---|---|---|---|
Labour | Peter Bales | 602 | |||
Labour | Nik Hardy | 546 | |||
Independent | Joseph Robertson | 522 | |||
Labour | Phil Tibble | 403 | |||
Turnout | 2,073 | 55 | +31 | ||
Labour hold | Swing | ||||
Independent gain from Labour | Swing | ||||
Party | Candidate | Votes | % | ± | |
---|---|---|---|---|---|
Labour | Barbara Cannon | 507 | |||
Labour | Carole Armstrong | 439 | |||
Labour | Bill Bacon | 432 | |||
Independent | John Bracken | 430 | |||
Turnout | 1,808 | 27 | +2 | ||
Labour hold | Swing | ||||
Labour hold | Swing |
Party | Candidate | Votes | % | ± | |
---|---|---|---|---|---|
Labour | Jeffrey Gardner | uncontested | |||
Labour | Angela Kendall | uncontested | |||
Labour hold | Swing | ||||
Labour hold | Swing |
Party | Candidate | Votes | % | ± | |
---|---|---|---|---|---|
Independent | Trevor Fee | 1,074 | |||
Independent | Joseph Sandwith | 941 | |||
Independent | Miriam Gainford | 777 | |||
Labour | Jim Musgrave | 478 | |||
Labour | Celia Tibble | 468 | |||
Turnout | 3,738 | 40 | +3 | ||
Independent hold | Swing | ||||
Independent gain from Labour | Swing | ||||
Party | Candidate | Votes | % | ± | |
---|---|---|---|---|---|
Independent | Bill Jefferson | 683 | |||
Independent | Margaret Snaith | 597 | |||
Labour | Jonathon Wood | 185 | |||
Turnout | 1,465 | 37 | |||
Independent hold | Swing | ||||
Independent gain from Labour | Swing | ||||
Party | Candidate | Votes | % | ± | |
---|---|---|---|---|---|
Conservative | James Lister | uncontested | |||
Conservative hold | Swing |
Party | Candidate | Votes | % | ± | |
---|---|---|---|---|---|
Labour | Joe Holliday | 788 | |||
Conservative | Mike Davidson | 780 | |||
Conservative | John Heathcote | 698 | |||
Conservative | Richard Jones | 591 | |||
Labour | Joan Wright | 560 | |||
Labour | Konrad Hansen | 418 | |||
Turnout | 3,835 | 37 | +9 | ||
Labour gain from Conservative | Swing | ||||
Conservative hold | Swing | ||||
Conservative hold | Swing |
Party | Candidate | Votes | % | ± | |
---|---|---|---|---|---|
Labour | Ivor Humes | 648 | |||
Labour | Alan Barry | 639 | |||
Independent | Jean Macleod | 637 | |||
Labour | Mary Bainbridge | 612 | |||
Independent | Eddie Woodthorpe | 486 | |||
Turnout | 3,022 | 24 | -9 | ||
Labour hold | Swing | ||||
Independent hold | Swing |
Party | Candidate | Votes | % | ± | |
---|---|---|---|---|---|
Conservative | Robert Hardon | 278 | 57.6 | ||
Labour | Ted Routledge | 120 | 24.8 | ||
Liberal Democrat | Marl Lancaster | 85 | 17.6 | ||
Majority | 158 | 32.8 | |||
Turnout | 483 | 35 | |||
Conservative hold | Swing |
Party | Candidate | Votes | % | ± | |
---|---|---|---|---|---|
Conservative | Stuart Moffat | uncontested | |||
Conservative gain from Liberal Democrat | Swing | ||||
Party | Candidate | Votes | % | ± | |
---|---|---|---|---|---|
Conservative | Duncan Fairbairn | uncontested | |||
Conservative hold | Swing |
Party | Candidate | Votes | % | ± | |
---|---|---|---|---|---|
Conservative | John Hunter | uncontested | |||
Conservative gain from Independent | Swing | ||||
Party | Candidate | Votes | % | ± | |
---|---|---|---|---|---|
Conservative | Jacqueline Mounsey | uncontested | |||
Conservative hold | Swing |
Party | Candidate | Votes | % | ± | |
---|---|---|---|---|---|
Independent | George Scott | 821 | |||
Independent | Binky Armstrong | 756 | |||
Labour | John Crouch | 650 | |||
Independent | Alan Hortin | 518 | |||
BNP | Paul Stafford | 347 | |||
Turnout | 3,092 | 34 | -1 | ||
Independent hold | Swing | ||||
Labour hold | Swing |
The English Democrats is an English nationalist political party in England.
The Borough of Copeland is a local government district and borough in western Cumbria, England. Its council is based in Whitehaven. It was formed on 1 April 1974 by the merger of the Borough of Whitehaven, Ennerdale Rural District and Millom Rural District. The population of the Non-Metropolitan district at the 2011 Census was 70,603.
Workington is a constituency represented in the House of Commons of the Parliament of the United Kingdom. It elects one Member of Parliament (MP) by the first-past-the-post system of election.
Allerdale Borough Council in Cumbria, England is elected every four years. Since the last boundary changes in 1999, 56 councillors have been elected from 31 wards.
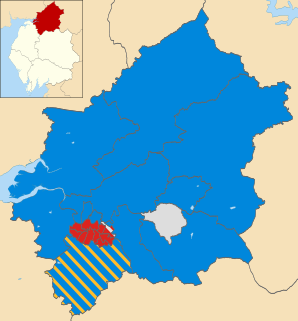
One third of Carlisle City Council in Cumbria, England is elected each year, followed by one year without election. Since the last boundary changes in 1999, 52 councillors have been elected from 22 wards.
Scotland has elections to several bodies: the Scottish Parliament, the United Kingdom Parliament, the European Parliament, local councils and community councils.
The 2007 UK local government elections were held on 3 May 2007. These elections took place in most of England and all of Scotland. There were no local government elections in Wales though the Welsh Assembly had a general election on the same day. There were no local government elections in Northern Ireland. Just over half of English councils and almost all the Scottish councils began the counts on Friday, rather than Thursday night, because of more complex arrangements regarding postal votes.
Elections to Allerdale Borough Council were held on 6 May 1999. The whole council was up for election with boundary changes since the last election in 1995 increasing the number of seats by 3. The Labour party kept overall control of the council. The election for Moorclose ward was postponed until the 1 July meaning 3 seats were vacant, see Allerdale local elections for the results.
Elections to Allerdale Borough Council were held on 1 May 2003. The whole council was up for election and the Labour party lost overall control of the council to no overall control.
Elections to West Lindsey District Council were held on 3 May 2007. One third of the council was up for election and the Liberal Democrat party held overall control of the council after what was seen as a straight fight with the Conservative party.
Cumbria County Council is the county council of Cumbria, a county in the North West of England. Established in 1974, following its first elections held a year before that, it is an elected local government body responsible for the most significant local services in the county, including county schools, county roads, and social services.
An election to Cumbria County Council took place on 2 May 2013 as part of the United Kingdom local elections, 2009. All 84 councillors were elected from various electoral divisions, which returned one or two county councillors each by first-past-the-post voting for a four-year term of office. They coincided with an election for the European Parliament. All 84 seats in the Council were up for election, and a total of 301 candidates stood. The total number of people registered to vote was 392,931. Prior to the election local Conservatives were leading a coalition with the Liberal Democrats with the Labour party as the council's official opposition.
The 2007 Halton Borough Council election took place on 3 May 2007 to elect members of Halton Unitary Council in Cheshire, England. One third of the council was up for election and the Labour party stayed in overall control of the council.
The 2011 United Kingdom local elections were held on Thursday 5 May 2011. In England, direct elections were held in all 36 Metropolitan boroughs, 194 Second-tier district authorities, 49 unitary authorities and various mayoral posts, meaning local elections took place in all parts of England with the exception of seven unitary authorities, and seven districts and boroughs. For the majority of English districts and the 25 unitary authorities that are elected "all out" these were the first elections since 2007. In Northern Ireland, there were elections to all 26 local councils. Elections also took place to most English parish councils.
Elections to Broxtowe Borough Council were held on 5 May 2011 to elect all 44 members to the Council.
The 2007 Sandwell Metropolitan Borough Council election took place on 3 May 2007 to elect members of Sandwell Metropolitan Borough Council in the West Midlands, England. One third of the council was up for election and the Labour party stayed in overall control of the council.
The 2011 Allerdale Borough Council election took place on 5 May 2011 to elect members of Allerdale Borough Council in Cumbria, England. The whole council was up for election and the council stayed under no overall control.
The 2007 Carlisle City Council election took place on 3 May 2007 to elect members of Carlisle District Council in Cumbria, England. One third of the council was up for election and the council stayed under no overall control.
The 2015 Allerdale Borough Council election took place on 7 May 2015 to elect members of Allerdale Borough Council in England. This was on the same day as other local elections.