
The economy of Gabon is characterized by strong links with France, large foreign investments, dependence on skilled foreign labor, and decline of agriculture. Gabon on paper enjoys a per capita income four times that of most nations of Africa, but its reliance on resource extraction industry fail to release much of the population from extreme poverty, as much of 30% of the population lives under the poverty threshold.

Petroleum or crude oil, also referred to as simply oil, is a naturally occurring yellowish-black liquid mixture of mainly hydrocarbons, and is found in geological formations. The name petroleum covers both naturally occurring unprocessed crude oil and petroleum products that consist of refined crude oil.

Oil sands, tar sands, crude bitumen, or bituminous sands, are a type of unconventional petroleum deposit. Oil sands are either loose sands or partially consolidated sandstone containing a naturally occurring mixture of sand, clay, and water, soaked with bitumen, a dense and extremely viscous form of petroleum.

The Hubbert peak theory says that for any given geographical area, from an individual oil-producing region to the planet as a whole, the rate of petroleum production tends to follow a bell-shaped curve. It is one of the primary theories on peak oil.

Peak oil is the theorized point in time when the maximum rate of global oil production will occur, after which oil production will begin an irreversible decline. The primary concern of peak oil is that global transportation heavily relies upon the use of gasoline and diesel fuel. Switching transportation to electric vehicles, biofuels, or more fuel-efficient forms of travel may help reduce oil demand.

From the mid-1980s to September 2003, the inflation-adjusted price of a barrel of crude oil on NYMEX was generally under US$25/barrel in 2008 dollars. During 2003, the price rose above $30, reached $60 by 11 August 2005, and peaked at $147.30 in July 2008. Commentators attributed these price increases to many factors, including Middle East tension, soaring demand from China, the falling value of the U.S. dollar, reports showing a decline in petroleum reserves, worries over peak oil, and financial speculation.
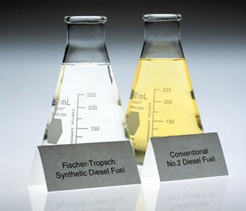
Synthetic fuel or synfuel is a liquid fuel, or sometimes gaseous fuel, obtained from syngas, a mixture of carbon monoxide and hydrogen, in which the syngas was derived from gasification of solid feedstocks such as coal or biomass or by reforming of natural gas.
Oil depletion is the decline in oil production of a well, oil field, or geographic area. The Hubbert peak theory makes predictions of production rates based on prior discovery rates and anticipated production rates. Hubbert curves predict that the production curves of non-renewing resources approximate a bell curve. Thus, according to this theory, when the peak of production is passed, production rates enter an irreversible decline.

Petroleum production in Canada is a major industry which is important to the overall economy of North America. Canada has the third largest oil reserves in the world and is the world's fourth largest oil producer and fourth largest oil exporter. In 2019 it produced an average of 750,000 cubic metres per day (4.7 Mbbl/d) of crude oil and equivalent. Of that amount, 64% was upgraded from unconventional oil sands, and the remainder light crude oil, heavy crude oil and natural-gas condensate. Most of the Canadian petroleum production is exported, approximately 600,000 cubic metres per day (3.8 Mbbl/d) in 2019, with 98% of the exports going to the United States. Canada is by far the largest single source of oil imports to the United States, providing 43% of US crude oil imports in 2015.
Renewable fuels are fuels produced from renewable resources. Examples include: biofuels, Hydrogen fuel, and fully synthetic fuel produced from ambient carbon dioxide and water. This is in contrast to non-renewable fuels such as natural gas, LPG (propane), petroleum and other fossil fuels and nuclear energy. Renewable fuels can include fuels that are synthesized from renewable energy sources, such as wind and solar. Renewable fuels have gained in popularity due to their sustainability, low contributions to the carbon cycle, and in some cases lower amounts of greenhouse gases. The geo-political ramifications of these fuels are also of interest, particularly to industrialized economies which desire independence from Middle Eastern oil.

United States energy independence is the concept of eliminating or substantially reducing import of petroleum to satisfy the nation's need for energy. Some proposals for achieving energy independence would permit imports from the neighboring nations of Canada and Mexico, in which case it would be called North American energy independence. Energy independence is espoused by those who want to leave the US unaffected by global energy supply disruptions and would restrict reliance upon politically unstable states for its energy security.
Peak gas is the point in time when the maximum global natural gas production rate will be reached, after which the rate of production will enter its terminal decline. Although demand is peaking in the United States and Europe, it continues to rise globally due to consumers in Asia, especially China. Natural gas is a fossil fuel formed from plant matter over the course of millions of years. Natural gas derived from fossil fuels is a non-renewable energy source; however, methane can be renewable in other forms such as biogas. Peak coal was in 2013, and peak oil is forecast to occur before peak gas. One forecast is for natural gas demand to peak in 2035.
Peak coal is the peak consumption or production of coal by a human community. Peak coal can be driven by peak demand or peak supply. Historically, it was widely believed that the supply-side would eventually drive peak coal due to the depletion of coal reserves. However, since the increasing global efforts to limit climate change, peak coal has been driven by demand. This is due in large part to the rapid expansion of natural gas and renewable energy. As of 2024 over 40% of all energy sector CO2 emissions are from coal, and many countries have pledged to phase-out coal.
Energy in Kazakhstan describes energy and electricity production, consumption and import in Kazakhstan and the politics of Kazakhstan related to energy.

Predicting the timing of peak oil involves estimation of future production from existing oil fields as well as future discoveries. The initial production model was Hubbert peak theory, first proposed in the 1950s. Since then, many experts have tried to forecast peak oil.
The Shell Scotford Upgrader is an oilsand upgrader, a facility which processes crude bitumen from oil sands into a wide range of synthetic crude oils. The upgrader is owned by Athabasca Oil Sands Project (AOSP), a joint venture of Shell Canada Energy (60%), Marathon Oil Sands L.P. (20%) and Chevron Canada Limited (20%). The facility is located in the industrial development of Scotford, just to the northeast of Fort Saskatchewan, Alberta in the Edmonton Capital Region.
Oil reserves in Canada were estimated at 172 billion barrels as of the start of 2015 . This figure includes the oil sands reserves that are estimated by government regulators to be economically producible at current prices using current technology. According to this figure, Canada's reserves are third only to Venezuela and Saudi Arabia. Over 95% of these reserves are in the oil sands deposits in the province of Alberta. Alberta contains nearly all of Canada's oil sands and much of its conventional oil reserves. The balance is concentrated in several other provinces and territories. Saskatchewan and offshore areas of Newfoundland in particular have substantial oil production and reserves. Alberta has 39% of Canada's remaining conventional oil reserves, offshore Newfoundland 28% and Saskatchewan 27%, but if oil sands are included, Alberta's share is over 98%.

Within the petroleum industry, proven crude oil reserves in the United States were 44.4 billion barrels (7.06×10⁹ m3) of crude oil as of the end of 2021, excluding the Strategic Petroleum Reserve.

EnergyinSaudi Arabia involves petroleum and natural gas production, consumption, and exports, and electricity production. Saudi Arabia is the world's leading oil producer and exporter. Saudi Arabia's economy is petroleum-based; oil accounts for 90% of the country's exports and nearly 75% of government revenue. The oil industry produces about 45% of Saudi Arabia's gross domestic product, against 40% from the private sector. Saudi Arabia has per capita GDP of $20,700. The economy is still very dependent on oil despite diversification, in particular in the petrochemical sector.
In the United States, synthetic fuels are of increasing importance due to the price of crude oil, and geopolitical and economic considerations.