Barcelona (Parliament of Catalonia constituency)

Last updated
Barcelona
Parliament of Catalonia
Electoral constituency
CatalanParliamentDistricts(Barcelona).png
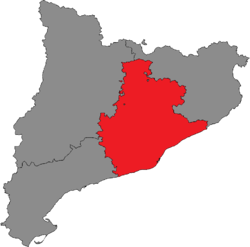
Location of Barcelona within Catalonia
Province Barcelona
Autonomous community Catalonia
Population Green Arrow Up Darker.svg 5,743,402 (2020) [1]
Electorate Green Arrow Up Darker.svg 4,195,466 (2021)
Major settlements Barcelona, Hospitalet de Llobregat, Badalona, Terrassa, Sabadell, Mataró, Santa Coloma de Gramanet
Current constituency
Created 1980
Seats85
Member(s)
  •   PSC (28)
  •   Cat–Junts+ (18)
  •   ERC (12)
  •   PP (11)
  •   Vox (7)
  •   Comuns Sumar (6)
  •   CUP (3)

Barcelona is one of the four constituencies (Spanish : circunscripciones) represented in the Parliament of Catalonia, the regional legislature of the autonomous community of Catalonia. The constituency currently elects 85 deputies. Its boundaries correspond to those of the Spanish province of Barcelona. The electoral system uses the D'Hondt method and a closed-list proportional representation, with a minimum threshold of three percent.

Contents

Electoral system

The constituency was created as per the Statute of Autonomy of Catalonia of 1979 and was first contested in the 1980 regional election. The Statute requires for an electoral law to be passed by a two-thirds supermajority in the Parliament of Catalonia, but transitory provisions provide for the four provinces in CataloniaBarcelona, Girona, Lleida and Tarragona—to be established as multi-member districts in the Parliament. Each constituency is allocated a fixed number of seats: 85 for Barcelona, 17 for Girona, 15 for Lleida and 18 for Tarragona. [2] [3]

Voting is on the basis of universal suffrage, which comprises all nationals over eighteen, registered in Catalonia and in full enjoyment of their political rights. Amendments to the electoral law in 2011 required for Catalans abroad to apply for voting before being permitted to vote, a system known as "begged" or expat vote (Spanish : Voto rogado) which was abolished in 2022. [4] [5] Seats are elected using the D'Hondt method and a closed list proportional representation, with an electoral threshold of three percent of valid votes—which includes blank ballots—being applied in each constituency. [2] [3] The use of the D'Hondt method may result in a higher effective threshold, depending on the district magnitude. [6]

The electoral law allows for parties and federations registered in the interior ministry, coalitions and groupings of electors to present lists of candidates. Parties and federations intending to form a coalition ahead of an election are required to inform the relevant Electoral Commission within ten days of the election call—fifteen before 1985—whereas groupings of electors need to secure the signature of at least one percent of the electorate in the constituencies for which they seek election—one-thousandth of the electorate, with a compulsory minimum of 500 signatures, until 1985—disallowing electors from signing for more than one list of candidates. [7] [8]

Deputies

Deputies 1980–present
Key to parties
   CUP
   JxSí
   PSUC
   ECP
   PSA–PA
   PSC
   CDS
   JuntsxCat
   Cs
   SI
   CiU
   CC–UCD
   PP
   CP
   AP
   Vox
ParliamentElectionDistribution
1st 1980
208222267
2nd 1984
5329417
3rd 1988
83283394
4th 1992
6627415
5th 1995
107223412
6th 1999
3736318
7th 2003
713292511
8th 2006
9112532710
9th 2010
8618333512
10th 2012
310121482612
11th 2015
732912178
12th 2017
37181317243
13/14th 2021
57192316537
15th 2024
36122818117

Elections

2024 regional election

Summary of the 12 May 2024 Parliament of Catalonia election results in Barcelona
Parties and alliancesPopular voteSeats
Votes %±pp Total+/−
Socialists' Party of Catalonia (PSC–PSOE)700,46329.90+4.8628+5
Together+Carles Puigdemont for Catalonia (Cat–Junts+)453,40719.36+1.4418+2
Republican Left of Catalonia (ERC)313,45113.38–7.0412–7
People's Party (PP)270,68311.55+7.5011+8
Vox (Vox)187,3368.00+0.207±0
Commons Unite (Comuns Sumar)1156,3496.67–1.096–1
Popular Unity Candidacy–Let's Defend the Land (CUP–DT)93,2563.98–2.333–2
Catalan Alliance (Aliança.cat)67,4052.88New0±0
Animalist Party with the Environment (PACMA)27,7631.19New0±0
Citizens–Party of the Citizenry (Cs)19,2970.82–5.280–5
At the Same Time (Alhora)210,3620.44+0.230±0
Workers' Front (FO)8,1200.35New0±0
Communist Party of the Workers of Catalonia (PCTC)3,0440.13–0.040±0
Zero Cuts (Recortes Cero)2,4860.11–0.410±0
For a Fairer World (PUM+J)1,9460.08New0±0
Left for Spain (IZQP–Unidos–DEf)31,4380.06–0.030±0
Blank ballots25,7701.10+0.29
Total2,342,57685±0
Valid votes2,342,57699.27+0.55
Invalid votes17,3430.73–0.55
Votes cast / turnout2,359,91955.15+3.75
Abstentions
Registered voters4,278,966
Sources [9]
Footnotes:

2021 regional election

Summary of the 14 February 2021 Parliament of Catalonia election results in Barcelona
Parties and alliancesPopular voteSeats
Votes %±pp Total+/−
Socialists' Party of Catalonia (PSC–PSOE)533,05125.04+9.8923+10
Republican Left of Catalonia (ERC)434,68520.42–0.2119+1
Together for Catalonia (JxCat)1381,54117.92 n/a 16+4
Vox (Vox)166,1667.80New7+7
In Common We Can–We Can In Common (ECP–PEC)2165,3047.76–0.667±0
Popular Unity CandidacyA New Cycle to Win (CUP–G)134,2656.31+1.945+2
Citizens–Party of the Citizenry (Cs)129,8896.10–20.335–19
People's Party (PP)86,2664.05–0.303±0
Catalan European Democratic Party (PDeCAT)153,3782.51n/a0–5
Zero CutsGreen Group–Municipalists (Recortes Cero–GV–M)10,9810.52+0.260±0
Primaries for the Independence of Catalonia Movement (MPIC)4,4050.21New0±0
Communist Party of the Workers of Catalonia (PCTC)3,5570.17New0±0
National Front of Catalonia (FNC)3,2470.15New0±0
Nationalist Party of Catalonia (PNC)3,1470.15New0±0
Left in Positive (IZQP)1,9040.09New0±0
Blank ballots17,1940.81+0.38
Total2,128,98085±0
Valid votes2,128,98098.72–0.95
Invalid votes27,5601.28+0.95
Votes cast / turnout2,156,54051.40–27.92
Abstentions2,038,92648.60+27.92
Registered voters4,195,466
Sources [10]
Footnotes:

2017 regional election

Summary of the 21 December 2017 Parliament of Catalonia election results in Barcelona
Parties and alliancesPopular voteSeats
Votes %±pp Total+/−
Citizens–Party of the Citizenry (Cs)868,36526.43+7.5924+7
Republican Left–Catalonia Yes (ERC–CatSí)1678,03020.63n/a18+3
Together for Catalonia (JuntsxCat)1624,26119.00 n/a 17+1
Socialists' Party of Catalonia (PSC–PSOE)497,65015.15+1.4813+1
Catalonia in Common–We Can (CatComú–Podem)2276,8108.42–1.717–2
Popular Unity Candidacy (CUP)143,7114.37–3.913–4
People's Party (PP)142,9344.35–4.503–5
Animalist Party Against Mistreatment of Animals (PACMA)31,3300.95+0.170±0
Zero CutsGreen Group (Recortes Cero–GV)8,6210.26–0.140±0
Republican Dialogue (Diàleg)00.00New0±0
Together for Yes (Independents) (JxSí)1n/an/an/a0–1
Blank ballots14,1630.43–0.07
Total3,285,87585±0
Valid votes3,285,87599.67±0.00
Invalid votes10,9250.33±0.00
Votes cast / turnout3,296,80079.32+4.29
Abstentions859,50920.68–4.29
Registered voters4,156,309
Sources [11] [12]
Footnotes:

2015 regional election

Summary of the 27 September 2015 Parliament of Catalonia election results in Barcelona
Parties and alliancesPopular voteSeats
Votes %±pp Total+/−
Together for Yes (JxSí)11,112,92236.09–4.7132–6
Citizens–Party of the Citizenry (C's)581,03218.84+10.4117+9
Socialists' Party of Catalonia (PSC–PSOE)421,48713.67–1.7312–2
Catalonia Yes We Can (CatSíqueesPot)2312,52710.13–1.019–1
People's Party (PP)272,8048.85–4.428–4
Popular Unity Candidacy (CUP)255,3288.28+4.877+4
Democratic Union of Catalonia (unio.cat)75,7002.45New0±0
Animalist Party Against Mistreatment of Animals (PACMA)24,4260.78+0.180±0
Zero CutsThe Greens (Recortes Cero–EV)12,3290.40New0±0
Blank ballots15,4930.50–0.89
Total3,084,04885±0
Valid votes3,084,04899.67+0.52
Invalid votes10,3140.33–0.52
Votes cast / turnout3,094,36275.03+7.03
Abstentions1,029,98724.97–7.03
Registered voters4,124,349
Sources [13] [14]
Footnotes:

2012 regional election

Summary of the 25 November 2012 Parliament of Catalonia election results in Barcelona
Parties and alliancesPopular voteSeats
Votes %±pp Total+/−
Convergence and Union (CiU)765,33028.08–8.7226–9
Socialists' Party of Catalonia (PSC–PSOE)419,77915.40–3.7914–4
People's Party (PP)361,65613.27+0.4012±0
Republican Left of Catalonia–Catalonia Yes (ERC–CatSí)346,66212.72+6.3612+6
Initiative for Catalonia Greens–United and Alternative Left (ICV–EUiA)303,62511.14+2.8810+2
Citizens–Party of the Citizenry (C's)229,7468.43+4.598+5
Popular Unity Candidacy–Left Alternative (CUP)92,7943.41New3+3
Platform for Catalonia (PxC)51,4031.89–0.560±0
Catalan Solidarity for Independence (SI)32,2961.19–1.910–3
Blank Seats (EB)22,8170.84+0.230±0
Animalist Party Against Mistreatment of Animals (PACMA)16,4790.60+0.110±0
Pirates of Catalonia (Pirata.cat)15,2410.56+0.350±0
Union, Progress and Democracy (UPyD)12,1470.45+0.250±0
Hartos.org (Hartos.org)9,1850.32New0±0
Democratic Way (VD)5,9840.16New0±0
Communist Unification of Spain (UCE)1,9980.07+0.040±0
Blank ballots37,9991.39–1.52
Total2,725,14185±0
Valid votes2,725,14199.15–0.22
Invalid votes23,3410.85+0.22
Votes cast / turnout2,748,48268.00+9.12
Abstentions1,293,42832.00–9.12
Registered voters4,041,910
Sources [15] [16]

2010 regional election

Summary of the 28 November 2010 Parliament of Catalonia election results in Barcelona
Parties and alliancesPopular voteSeats
Votes %±pp Total+/−
Convergence and Union (CiU)862,01036.80+6.9135+8
Socialists' Party of Catalonia (PSC–PSOE)449,54919.19–8.7118–7
People's Party (PP)301,44012.87+1.7112+2
Initiative for Catalonia Greens–United and Alternative Left (ICV–EUiA)193,5458.26–2.128–1
Republican Left of Catalonia (ERC)148,9736.36–6.256–5
Citizens–Party of the Citizenry (C's)89,9903.84+0.313±0
Catalan Solidarity for Independence (SI)72,6933.10New3+3
Platform for Catalonia (PxC)57,3812.45New0±0
Independence Rally (RI.cat)23,1850.99New0±0
Blank SeatsCitizens for Blank Votes (EB–CenB)114,1850.61+0.360±0
The Greens–European Green Group (EV–GVE)12,0870.52–0.280±0
Anti-Bullfighting Party Against Mistreatment of Animals (PACMA)11,5930.49–0.010±0
From Below (Des de Baix)5,6130.24New0±0
Pirates of Catalonia (Pirata.cat)5,0010.21New0±0
Union, Progress and Democracy (UPyD)4,6340.20New0±0
Reus Independent Coordinator (CORI)4,4250.19New0±0
Pensioners in Action Party (PDLPEA)2,5080.11New0±0
Communist Party of the Catalan People (PCPC)2,2620.10–0.060±0
Government Alternative (AG)2,2080.09New0±0
For a Fairer World (PUM+J)1,7740.08New0±0
Family and Life Party (PFiV)1,6240.07–0.020±0
Internationalist Socialist Workers' Party (POSI)1,3990.06–0.120±0
Spanish Phalanx of the CNSO (FE–JONS)1,2500.05New0±0
Left Republican Party–Republican Left (PRE–IR)1,1010.05New0±0
Castilian Party (PCAS)1,0660.05New0±0
Humanist Party (PH)8560.04–0.060±0
Communist Unification of Spain (UCE)7260.03New0±0
Our People (GN)5970.03New0±0
Republican Social Movement (MSR)4900.02–0.010±0
Blank ballots68,2412.89+0.85
Total2,342,40685±0
Valid votes2,342,40699.37–0.24
Invalid votes14,8570.63+0.24
Votes cast / turnout2,357,26358.88+2.94
Abstentions1,646,48841.12–2.94
Registered voters4,003,751
Sources [17] [18]
Footnotes:
  • 1 Blank SeatsCitizens for Blank Votes results are compared to the combined totals of Unsubmissive Seats–Alternative of Discontented Democrats and Citizens for Blank Votes in the 2006 election.

2006 regional election

Summary of the 1 November 2006 Parliament of Catalonia election results in Barcelona
Parties and alliancesPopular voteSeats
Votes %±pp Total+/−
Convergence and Union (CiU)664,72329.89+1.1127+2
Socialists' Party of CataloniaCitizens for Change (PSC–CpC)620,60127.90–5.2725–4
Republican Left of Catalonia (ERC)280,56612.61–2.5511–2
People's Party (PP)248,16511.16–1.3910–1
Initiative for Catalonia Greens–United and Alternative Left (ICV–EUiA)230,96810.38+2.359+2
Citizens–Party of the Citizenry (C's)78,5253.53New3+3
The Greens–Ecologists and Greens of Catalonia (EV–EVC)17,9000.80+0.060±0
Anti-Bullfighting Party Against Mistreatment of Animals (PACMA)11,0850.50New0±0
Unsubmissive Seats–Alternative of Discontented Democrats (Ei–ADD)5,6620.25+0.170±0
Internationalist Socialist Workers' Party (POSI)4,0390.18+0.070±0
Catalan Republican Party (RC)4,0030.18New0±0
Communist Party of the Catalan People (PCPC)3,5270.16+0.080±0
Humanist Party of Catalonia (PHC)2,1350.10+0.050±0
Forward Catalonia Platform (AESDN)2,1310.10New0±0
Family and Life Party (PFiV)2,0480.09New0±0
Carmel/Blue Party (PAzul)1,0390.05New0±0
Republican Social Movement (MSR)7760.03+0.010±0
Catalonia Decides (Decideix.cat)6680.03New0±0
Blank ballots45,5582.05+1.14
Total2,224,11985±0
Valid votes2,224,11999.61–0.17
Invalid votes8,7530.39+0.17
Votes cast / turnout2,232,87255.94–6.16
Abstentions1,759,03244.06+6.16
Registered voters3,991,904
Sources [19] [20]

2003 regional election

Summary of the 16 November 2003 Parliament of Catalonia election results in Barcelona
Parties and alliancesPopular voteSeats
Votes %±pp Total+/−
Socialists' Party of CataloniaCitizens for Change (PSC–CpC)824,27033.17–6.8229–7
Convergence and Union (CiU)715,14028.78–6.3625–6
Republican Left of Catalonia (ERC)376,66915.16+7.4313+6
People's Party (PP)311,92812.55+2.6411+3
Initiative for Catalonia Greens–Alternative Left (ICV–EA)1199,5538.03+3.087+4
The Greens–The Ecologist Alternative (EV–AE)18,4700.74New0±0
Platform for Catalonia (PxC)3,0600.12New0±0
Internationalist Socialist Workers' Party (POSI)2,7730.11–0.010±0
Unsubmissive Seats (Ei)1,9050.08New0±0
Communist Party of the Catalan People (PCPC)1,8910.08New0±0
Another Democracy is Possible (UADeP)1,2110.05New0±0
Humanist Party of Catalonia (PHC)1,1880.05+0.010±0
Catalan State (EC)1,1620.05±0.000±0
Democratic and Social Centre (CDS)1,0730.04–0.010±0
Caló Nationalist Party (PNCA)6360.03New0±0
Spaniards Under Separatism (EBS)6030.02New0±0
Republican Social Movement (MSR)6020.02New0±0
Internationalist Struggle (LI (LIT–CI))4910.02+0.010±0
Blank ballots22,5460.91–0.01
Total2,485,17185±0
Valid votes2,485,17199.78±0.00
Invalid votes5,4160.22±0.00
Votes cast / turnout2,490,58762.10+3.25
Abstentions1,520,24737.90–3.25
Registered voters4,010,834
Sources [21] [22]
Footnotes:

1999 regional election

Summary of the 17 October 1999 Parliament of Catalonia election results in Barcelona
Parties and alliancesPopular voteSeats
Votes %±pp Total+/−
Socialists' Party of CataloniaCitizens for Change (PSC–CpC)948,20239.99+14.5636+14
Convergence and Union (CiU)833,16835.14–3.9131–3
People's Party (PP)234,9579.91–3.718–4
Republican Left of Catalonia (ERC)183,2707.73–0.977±0
Initiative for Catalonia–Greens (IC–V)178,4413.31 n/a 3–5
United and Alternative Left (EUiA)138,8361.64n/a0–1
The Greens–Ecologist Confederation of Catalonia (EV–CEC)117,6840.75n/a0–1
The Greens–Green Alternative (EV–AV)5,0000.21New0±0
Internationalist Socialist Workers' Party (POSI)2,7840.12New0±0
Spanish Phalanx of the CNSO (FE–JONS)1,2810.05New0±0
Democratic and Social Centre (CDS)1,1610.05New0±0
Catalan State (EC)1,1370.05New0±0
Humanist Party of Catalonia (PHC)9740.04New0±0
Natural Law Party (PLN)7380.03New0±0
Espinalist Party (PE)5460.02New0±0
Federal Democratic Union (UFD)4470.02New0±0
Internationalist Struggle (LI (LIT–CI))3230.01New0±0
Blank ballots21,9260.92–0.07
Total2,370,87585±0
Valid votes2,370,87599.78+0.02
Invalid votes5,1750.22–0.02
Votes cast / turnout2,376,05058.85–4.04
Abstentions1,661,43941.15+4.04
Registered voters4,037,489
Sources [23] [24]
Footnotes:

1995 regional election

Summary of the 19 November 1995 Parliament of Catalonia election results in Barcelona
Parties and alliancesPopular voteSeats
Votes %±pp Total+/−
Convergence and Union (CiU)953,41939.05–5.5334–7
Socialists' Party of Catalonia (PSC–PSOE)620,75625.43–3.4622–5
People's Party (PP)332,41713.62+7.6912+7
Initiative for CataloniaThe Greens (IC–EV)1274,22211.23+2.6410+4
Republican Left of Catalonia (ERC)212,3358.70+1.517+1
Ecologist Alternative of Catalonia (AEC)211,3560.47–0.170±0
Ecologist Party of Catalonia–VERDE (PEC–VERDE)5,6390.23–0.160±0
Revolutionary Workers' Party (POR)3,0540.13+0.050±0
Workers' Revolutionary Party (PRT)31,9420.08–0.290±0
Citizens of Catalonia–Platform of Independents of Spain (PICC–PIE)1,3260.05New0±0
Civic Platform–New Socialist Party (PC–NPS)47500.03–0.030±0
Blank ballots24,2300.99–0.16
Total2,441,44685±0
Valid votes2,441,44699.76+0.10
Invalid votes5,8950.24–0.10
Votes cast / turnout2,447,34162.89+9.53
Abstentions1,444,09437.11–9.53
Registered voters3,891,435
Sources [25] [26]
Footnotes:

1992 regional election

Summary of the 15 March 1992 Parliament of Catalonia election results in Barcelona
Parties and alliancesPopular voteSeats
Votes %±pp Total+/−
Convergence and Union (CiU)882,75844.58+0.9841+2
Socialists' Party of Catalonia (PSC–PSOE)572,03628.89–2.4927–1
Initiative for Catalonia (IC)146,9377.42–1.406–2
Republican Left of Catalonia (ERC)142,3817.19+3.486+3
People's Party (PP)1117,4095.93+0.705+1
Democratic and Social Centre (CDS)19,5050.99–2.860–3
Party of the Communists of Catalonia (PCC)19,0650.96New0±0
The Greens–Green Union (EV–UV)12,7500.64New0±0
The Ecologists (LVE)9,8790.50+0.180±0
Ecologist Party of Catalonia–VERDE (PEC–VERDE)7,7860.39+0.140±0
Ruiz-Mateos Group (ARM)7,6390.39New0±0
Workers' Socialist Party (PST)7,3970.37+0.170±0
Green Alternative–Nationalist Left Movement (AV–MEN)4,1380.21–0.360±0
Free Catalonia (CLL)3,3740.17New0±0
Revolutionary Workers' Party of Spain (PORE)1,6790.08–0.010±0
Humanist Party (PH)1,3100.07–0.010±0
Independent Socialists (SI)21,2510.06+0.020±0
Blank ballots22,7111.15+0.55
Total1,980,00585±0
Valid votes1,980,00599.66+0.12
Invalid votes6,7160.34–0.12
Votes cast / turnout1,986,72153.36–5.22
Abstentions1,736,20746.64+5.22
Registered voters3,722,928
Sources [27] [28] [29]
Footnotes:

1988 regional election

Summary of the 29 May 1988 Parliament of Catalonia election results in Barcelona
Parties and alliancesPopular voteSeats
Votes %±pp Total+/−
Convergence and Union (CiU)894,12043.60–0.7439–2
Socialists' Party of Catalonia (PSC–PSOE)643,53531.38–0.8928–1
Initiative for Catalonia (IC)1180,8728.82–1.178+3
People's Alliance (AP)2107,2175.23–2.334–3
Democratic and Social Centre (CDS)78,9273.85New3+3
Republican Left of Catalonia (ERC)76,0993.71–0.383±0
Green Alternative–Ecologist Movement of Catalonia (AV–MEC)11,5890.57New0±0
The Ecologist Greens (EVE)6,5260.32New0±0
The Greens (EV)6,0960.30New0±0
Ecologist Party of Catalonia–VERDE (PEC–VERDE)5,0170.24–0.150±0
Andalusian Party of Catalonia (PAC)4,9470.24New0±0
Workers' Socialist Party (PST)4,0310.20+0.020±0
Social Democratic Party of Catalonia (PSDC)3,7310.18–0.060±0
Spanish Juntas (JJEE)3,7290.18New0±0
Communist Unification of Spain (UCE)2,6840.13New0±0
Spanish Phalanx of the CNSO (FE–JONS)2,0090.10New0±0
Revolutionary Workers' Party of Spain (PORE)1,9380.09±0.000±0
Humanist Party of Catalonia (PHC)1,6790.08New0±0
Communist Workers' League (LOC)1,6610.08New0±0
Republican Popular Unity (UPR)37880.04–0.020±0
Alliance for the Republic (AxR)47830.04–0.070±0
Centrist Unity–Democratic Spanish Party (PED)5900.03New0±0
Blank ballots12,2080.60+0.12
Total2,050,77685±0
Valid votes2,050,77699.54+0.02
Invalid votes9,4650.46–0.02
Votes cast / turnout2,060,24158.58–5.28
Abstentions1,456,55941.42+5.28
Registered voters3,516,800
Sources [30] [31]
Footnotes:

1984 regional election

Summary of the 29 April 1984 Parliament of Catalonia election results in Barcelona
Parties and alliancesPopular voteSeats
Votes %±pp Total+/−
Convergence and Union (CiU)978,57644.34+17.1041+15
Socialists' Party of Catalonia (PSC–PSOE)712,27832.27+9.1029+7
People's Coalition (APPDPUL)1166,9057.56+4.987+7
Unified Socialist Party of Catalonia (PSUC)134,7776.11–14.705–15
Republican Left of Catalonia (ERC)90,2554.09–4.213–5
Party of the Communists of Catalonia (PCC)260,9002.76+2.490±0
Agreement of the Catalan Left (EEC)324,7021.12–0.420±0
Spanish Vertex Ecological Development Revindication (VERDE)8,7140.39New0±0
Social Democratic Party of Catalonia (PSDC)5,2500.24New0±0
Workers' Socialist Party (PST)3,9300.18New0±0
Internationalist Socialist Workers' Party (POSI)2,4670.11New0±0
Communist Workers' Party of Catalonia (PCOC)2,1310.10–0.520±0
Revolutionary Workers' Party of Spain (PORE)1,9200.09New0±0
Communist Party of Spain (Marxist–Leninist) (PCE (m–l))1,4180.06New0±0
Revolutionary Communist League (LCR)1,3760.06New0±0
Spanish Democratic Party (PDE)1,1100.05New0±0
Communist Movement of Catalonia (MCC)400.00–1.210±0
Centrists of Catalonia (CC–UCD) n/a n/a–8.170–7
Socialist Party of Andalusia–Andalusian Party (PSA–PA)n/an/a–3.030–2
Blank ballots10,4950.48–0.20
Total2,207,20485±0
Valid votes2,207,20499.52±0.00
Invalid votes10,6270.48±0.00
Votes cast / turnout2,217,83163.86+2.76
Abstentions1,255,22036.14–2.76
Registered voters3,473,051
Sources [32]
Footnotes:

1980 regional election

Summary of the 20 March 1980 Parliament of Catalonia election results in Barcelona
Parties and alliancesPopular voteSeats
Votes %±pp Total+/−
Convergence and Union (CiU)570,67027.24 n/a 26n/a
Socialists' Party of Catalonia (PSC–PSOE)485,32423.17n/a22n/a
Unified Socialist Party of Catalonia (PSUC)435,88720.81n/a20n/a
Republican Left of Catalonia (ERC)173,8158.30n/a8n/a
Centrists of Catalonia (CC–UCD)171,1228.17n/a7n/a
Socialist Party of Andalusia–Andalusian Party (PSA–PA)63,4423.03n/a2n/a
Catalan Solidarity (SC)53,9672.58n/a0n/a
Left Nationalists (NE)32,3241.54n/a0n/a
Unity for Socialism (CUPS)28,4991.36n/a0n/a
New Force (FN)20,0740.96n/a0n/a
Communist Workers' Party of Catalonia (PCOC)12,9630.62n/a0n/a
Left Bloc for National Liberation (BEAN)11,6200.55n/a0n/a
Spanish Phalanx of the CNSO (FE–JONS)6,0290.29n/a0n/a
Communist Unity (UC)5,7100.27n/a0n/a
Independent National Party (PNI)4,7410.23n/a0n/a
Conservatives of Catalonia (CiC)4,0950.20n/a0n/a
Blank ballots14,3990.68n/a
Total2,094,68185n/a
Valid votes2,094,68199.52n/a
Invalid votes10,0860.48n/a
Votes cast / turnout2,104,76761.10n/a
Abstentions1,340,01238.90n/a
Registered voters3,444,779
Sources [33]

Related Research Articles

<span class="mw-page-title-main">Alt Camp</span> Comarca in Catalonia, Spain

Alt Camp is a comarca (county) located in the region of Camp de Tarragona, in Catalonia, Spain. The capital is the city of Valls.

<span class="mw-page-title-main">Alt Empordà</span> Comarca in Catalonia, Spain

Alt Empordà is a comarca (county) located in the Girona region, in Catalonia, Spain. It is one of two comarques into which Empordà was divided by the comarca division of Catalonia in 1936, the other one being Baix Empordà. The capital is the municipality of Figueres.

<span class="mw-page-title-main">1999 Catalan regional election</span>

The 1999 Catalan regional election was held on Sunday, 17 October 1999, to elect the 6th Parliament of the autonomous community of Catalonia. All 135 seats in the Parliament were up for election.

<span class="mw-page-title-main">Parliament of Catalonia</span> Parliament that exercises the legislative power of the Government of Catalonia

The Parliament of Catalonia is the unicameral legislature of the autonomous community of Catalonia. The Parliament is currently made up of 135 members, known as deputies, who are elected for four-year terms or after extraordinary dissolution, chosen by universal suffrage in lists of four constituencies, corresponding to the Catalan provinces. The Parliament building is located in Ciutadella Park, Barcelona.

The comarcal council, also somewhat misleadingly referred to as county council, is a local administration and government body in the comarcas of some parts of Spain, mostly in the autonomous communities of Catalonia, Aragon and the Basque Country.

<span class="mw-page-title-main">1995 Catalan regional election</span>

The 1995 Catalan regional election was held on Sunday, 19 November 1995, to elect the 5th Parliament of the autonomous community of Catalonia. All 135 seats in the Parliament were up for election.

<span class="mw-page-title-main">1992 Catalan regional election</span> Regional election in Catalonia

The 1992 Catalan regional election was held on Sunday, 15 March 1992, to elect the 4th Parliament of the autonomous community of Catalonia. All 135 seats in the Parliament were up for election.

<span class="mw-page-title-main">1988 Catalan regional election</span> Regional election in Catalonia

The 1988 Catalan regional election was held on Sunday, 29 May 1988, to elect the 3rd Parliament of the autonomous community of Catalonia. All 135 seats in the Parliament were up for election.

<span class="mw-page-title-main">2007 Spanish regional elections</span>

The 2007 Spanish regional elections were held on Sunday, 27 May 2007, to elect the regional parliaments of thirteen of the seventeen autonomous communities—Aragon, Asturias, the Balearic Islands, the Canary Islands, Cantabria, Castile and León, Castilla–La Mancha, Extremadura, La Rioja, Madrid, Murcia, Navarre and the Valencian Community—, not including Andalusia, the Basque Country, Catalonia and Galicia, which had separate electoral cycles. 812 of 1,206 seats in the regional parliaments were up for election, as well as the 50 seats in the regional assemblies of Ceuta and Melilla. The elections were held simultaneously with local elections all throughout Spain.

<span class="mw-page-title-main">Unity for Socialism</span> Political party in Spain

Unity for Socialism was an electoral coalition in Catalonia, Spain, contesting the 1980 Catalan parliament election. The coalition represented the main groups of the non-parliamentary left in Catalonia at the time. It was constituted by the Workers Party of Catalonia (PTC), Communist Organization of Spain, Revolutionary Communist League (LCR) and the Communist Movement of Catalonia (MCC). Manuel Gracia Luño was the top candidate in the Barcelona constituency, whilst Jordi Creixans headed the Girona list, Francisco Javier Clavería (PTC) headed the Lleida list and José Semente Moya (MCC) was the top candidate in Tarragona.

<span class="mw-page-title-main">2011 Spanish regional elections</span>

The 2011 Spanish regional elections were held on Sunday, 22 May 2011, to elect the regional parliaments of thirteen of the seventeen autonomous communities—Aragon, Asturias, the Balearic Islands, the Canary Islands, Cantabria, Castile and León, Castilla–La Mancha, Extremadura, La Rioja, Madrid, Murcia, Navarre and the Valencian Community—, not including Andalusia, the Basque Country, Catalonia and Galicia, which had separate electoral cycles. 824 of 1,218 seats in the regional parliaments were up for election, as well as the 50 seats in the regional assemblies of Ceuta and Melilla. The elections were held simultaneously with local elections all throughout Spain.

<span class="mw-page-title-main">2015 Spanish regional elections</span>

The 2015 Spanish regional elections were held on Sunday, 24 May 2015, to elect the regional parliaments of thirteen of the seventeen autonomous communities—Aragon, Asturias, the Balearic Islands, the Canary Islands, Cantabria, Castile and León, Castilla–La Mancha, Extremadura, La Rioja, Madrid, Murcia, Navarre and the Valencian Community—, not including Andalusia, the Basque Country, Catalonia and Galicia, which had separate electoral cycles. 804 of 1,198 seats in the regional parliaments were up for election, as well as the 50 seats in the regional assemblies of Ceuta and Melilla. The elections were held simultaneously with local elections all throughout Spain.

<span class="mw-page-title-main">2003 Spanish regional elections</span>

The 2003 Spanish regional elections were held on Sunday, 25 May 2003, to elect the regional parliaments of thirteen of the seventeen autonomous communities—Aragon, Asturias, the Balearic Islands, the Canary Islands, Cantabria, Castile and León, Castilla–La Mancha, Extremadura, La Rioja, Madrid, Murcia, Navarre and the Valencian Community—, not including Andalusia, the Basque Country, Catalonia and Galicia, which had separate electoral cycles. 792 of 1,186 seats in the regional parliaments were up for election, as well as the 50 seats in the regional assemblies of Ceuta and Melilla. The elections were held simultaneously with local elections all throughout Spain.

<span class="mw-page-title-main">1984 Catalan regional election</span>

The 1984 Catalan regional election was held on Sunday, 29 April 1984, to elect the 2nd Parliament of the autonomous community of Catalonia. All 135 seats in the Parliament were up for election.

<span class="mw-page-title-main">Girona (Parliament of Catalonia constituency)</span> Constituency represented in the Parliament of Catalonia

Girona is one of the four constituencies represented in the Parliament of Catalonia, the regional legislature of the autonomous community of Catalonia. The constituency currently elects 17 deputies. Its boundaries correspond to those of the Spanish province of Girona. The electoral system uses the D'Hondt method and a closed-list proportional representation, with a minimum threshold of three percent.

<span class="mw-page-title-main">Lleida (Parliament of Catalonia constituency)</span>

Lleida is one of the four constituencies represented in the Parliament of Catalonia, the regional legislature of the autonomous community of Catalonia. The constituency currently elects 15 deputies. Its boundaries correspond to those of the Spanish province of Lleida. The electoral system uses the D'Hondt method and a closed-list proportional representation, with a minimum threshold of three percent.

<span class="mw-page-title-main">Tarragona (Parliament of Catalonia constituency)</span>

Tarragona is one of the four constituencies represented in the Parliament of Catalonia, the regional legislature of the autonomous community of Catalonia. The constituency currently elects 18 deputies. Its boundaries correspond to those of the Spanish province of Tarragona. The electoral system uses the D'Hondt method and a closed-list proportional representation, with a minimum threshold of three percent.

<span class="mw-page-title-main">1991 Spanish regional elections</span>

The 1991 Spanish regional elections were held on Sunday, 26 May 1991, to elect the regional parliaments of thirteen of the seventeen autonomous communities—Aragon, Asturias, the Balearic Islands, the Canary Islands, Cantabria, Castile and León, Castilla–La Mancha, Extremadura, La Rioja, Madrid, Murcia, Navarre and the Valencian Community—, not including Andalusia, the Basque Country, Catalonia and Galicia, which had separate electoral cycles. 784 of 1,178 seats in the regional parliaments were up for election. The elections were held simultaneously with local elections all throughout Spain.

<span class="mw-page-title-main">1995 Spanish regional elections</span>

The 1995 Spanish regional elections were held on Sunday, 28 May 1995, to elect the regional parliaments of thirteen of the seventeen autonomous communities—Aragon, Asturias, the Balearic Islands, the Canary Islands, Cantabria, Castile and León, Castilla–La Mancha, Extremadura, La Rioja, Madrid, Murcia, Navarre and the Valencian Community—, not including Andalusia, the Basque Country, Catalonia and Galicia, which had separate electoral cycles. 786 of 1,180 seats in the regional parliaments were up for election, as well as the 50 seats in the regional assemblies of Ceuta and Melilla. The elections were held simultaneously with local elections all throughout Spain.

<span class="mw-page-title-main">1999 Spanish regional elections</span>

The 1999 Spanish regional elections were held on Sunday, 13 June 1999, to elect the regional parliaments of thirteen of the seventeen autonomous communities—Aragon, Asturias, the Balearic Islands, the Canary Islands, Cantabria, Castile and León, Castilla–La Mancha, Extremadura, La Rioja, Madrid, Murcia, Navarre and the Valencian Community, not including Andalusia, the Basque Country, Catalonia and Galicia, which had separate electoral cycles. 784 of 1,178 seats in the regional parliaments were up for election, as well as the 50 seats in the regional assemblies of Ceuta and Melilla. The elections were held simultaneously with local elections all throughout Spain, as well as the 1999 European Parliament election.

References

  1. "Cifras oficiales de población resultantes de la revisión del Padrón municipal a 1 de enero. Población por provincias y por sexo". ine.es (in Spanish). National Institute of Statistics . Retrieved 8 February 2020.
  2. 1 2 Ley Orgánica 4/1979, de 18 de diciembre, de Estatuto de Autonomía de Cataluña (Organic Law 4) (in Spanish). 18 December 1979. Retrieved 14 March 2017.
  3. 1 2 Ley Orgánica 6/2006, de 19 de julio, de reforma del Estatuto de Autonomía de Cataluña (Organic Law 6) (in Spanish). 19 July 2006. Retrieved 14 March 2017.
  4. Reig Pellicer, Naiara (16 December 2015). "Spanish elections: Begging for the right to vote". cafebabel.co.uk. Retrieved 17 July 2017.
  5. Araque Conde, Pilar (8 June 2022). "El Congreso acaba con el voto rogado: diez años de trabas burocráticas para los residentes en el extranjero". Público (in Spanish). Madrid. Retrieved 31 July 2022.
  6. Gallagher, Michael (30 July 2012). "Effective threshold in electoral systems". Trinity College, Dublin. Archived from the original on 30 July 2017. Retrieved 22 July 2017.
  7. Real Decreto-ley 20/1977, de 18 de marzo, sobre Normas Electorales (Royal Decree-Law 20) (in Spanish). 18 March 1977. Retrieved 14 December 2019.
  8. Ley Orgánica 5/1985, de 19 de junio, del Régimen Electoral General (Organic Law 5) (in Spanish). 19 June 1985. Retrieved 30 January 2020.
  9. "Resultados provisionales - Barcelona". resultats.eleccionsparlament.cat (in Spanish). Government of Catalonia. 12 May 2024. Retrieved 13 May 2024.
  10. "Resultados definitivos. Barcelona". resultats.parlament2021.cat (in Spanish). Government of Catalonia. 14 February 2021. Retrieved 3 April 2021.
  11. "Electoral results. Parliament of Catalonia election 2017. Barcelona". resultats.dadeselectorals.gencat.cat (in Catalan). Government of Catalonia . Retrieved 3 February 2020.
  12. "Parliament of Catalonia election results, 21 December 2017" (PDF). www.juntaelectoralcentral.es (in Spanish). Central Electoral Commission. 12 January 2018. Retrieved 14 January 2018.
  13. "Electoral results. Parliament of Catalonia election 2015. Barcelona". resultats.dadeselectorals.gencat.cat (in Catalan). Government of Catalonia. Retrieved 24 September 2017.
  14. "Parliament of Catalonia election results, 27 September 2015" (PDF). www.juntaelectoralcentral.es (in Spanish). Central Electoral Commission. 6 November 2015. Retrieved 25 September 2017.
  15. "Electoral results. Parliament of Catalonia election 2012. Barcelona". resultats.dadeselectorals.gencat.cat (in Catalan). Government of Catalonia. Retrieved 24 September 2017.
  16. "Parliament of Catalonia election results, 25 November 2012" (PDF). www.juntaelectoralcentral.es (in Spanish). Central Electoral Commission. 4 February 2013. Retrieved 25 September 2017.
  17. "Electoral results. Parliament of Catalonia election 2010. Barcelona". resultats.dadeselectorals.gencat.cat (in Catalan). Government of Catalonia. Retrieved 24 September 2017.
  18. "Parliament of Catalonia election results, 28 November 2010" (PDF). www.juntaelectoralcentral.es (in Spanish). Central Electoral Commission. 14 January 2011. Retrieved 25 September 2017.
  19. "Electoral results. Parliament of Catalonia election 2006. Barcelona". resultats.dadeselectorals.gencat.cat (in Catalan). Government of Catalonia. Retrieved 24 September 2017.
  20. "Parliament of Catalonia election results, 1 November 2006" (PDF). www.juntaelectoralcentral.es (in Spanish). Central Electoral Commission. 13 December 2006. Retrieved 25 September 2017.
  21. "Electoral results. Parliament of Catalonia election 2003. Barcelona". resultats.dadeselectorals.gencat.cat (in Catalan). Government of Catalonia. Retrieved 24 September 2017.
  22. "Parliament of Catalonia election results, 16 November 2003. Barcelona and Lleida" (PDF). www.juntaelectoralcentral.es (in Spanish). Central Electoral Commission. 2 December 2003. Retrieved 25 September 2017.
  23. "Electoral results. Parliament of Catalonia election 1999. Barcelona". resultats.dadeselectorals.gencat.cat (in Catalan). Government of Catalonia. Retrieved 24 September 2017.
  24. "Parliament of Catalonia election results, 17 October 1999. Barcelona, Girona, Lleida and Tarragona" (PDF). www.juntaelectoralcentral.es (in Spanish). Central Electoral Commission. 3 November 1999. Retrieved 25 September 2017.
  25. "Electoral results. Parliament of Catalonia election 1995. Barcelona". resultats.dadeselectorals.gencat.cat (in Catalan). Government of Catalonia. Retrieved 24 September 2017.
  26. "Parliament of Catalonia election results, 19 November 1995. Barcelona and Tarragona" (PDF). www.juntaelectoralcentral.es (in Spanish). Central Electoral Commission. 2 December 1995. Retrieved 25 September 2017.
  27. "Electoral results. Parliament of Catalonia election 1992. Barcelona". resultats.dadeselectorals.gencat.cat (in Catalan). Government of Catalonia. Retrieved 24 September 2017.
  28. "Parliament of Catalonia election results, 15 March 1992. Barcelona and Lleida" (PDF). www.juntaelectoralcentral.es (in Spanish). Central Electoral Commission. 3 April 1992. Retrieved 25 September 2017.
  29. "Parliament of Catalonia election results, 15 March 1992. Barcelona. Error correction" (PDF). www.juntaelectoralcentral.es (in Spanish). Central Electoral Commission. 10 April 1992. Retrieved 25 September 2017.
  30. "Electoral results. Parliament of Catalonia election 1988. Barcelona". resultats.dadeselectorals.gencat.cat (in Catalan). Government of Catalonia. Retrieved 24 September 2017.
  31. "Parliament of Catalonia election results, 29 May 1988. Barcelona, Girona and Tarragona" (PDF). www.juntaelectoralcentral.es (in Spanish). Central Electoral Commission. 4 July 1988. Retrieved 25 September 2017.
  32. "Electoral results. Parliament of Catalonia election 1984. Barcelona". resultats.dadeselectorals.gencat.cat (in Catalan). Government of Catalonia. Retrieved 24 September 2017.
  33. "Electoral results. Parliament of Catalonia election 1980. Barcelona". resultats.dadeselectorals.gencat.cat (in Catalan). Government of Catalonia. Retrieved 24 September 2017.

41°27′N2°5′E / 41.450°N 2.083°E / 41.450; 2.083