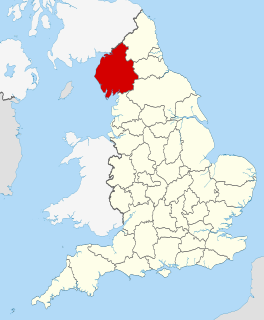
The 2007 Copeland Borough Council election took place on 3 May 2007 to elect members of Copeland Borough Council in Cumbria, England. The whole council was up for election and the Labour party stayed in overall control of the council. [1]
Borough status in the United Kingdom is granted by royal charter to local government districts in England, Wales and Northern Ireland. The status is purely honorary, and does not give any additional powers to the council or inhabitants of the district. In Scotland, similarly chartered communities were known as royal burghs, although the status is no longer granted.
Cumbria is a ceremonial and non-metropolitan county in North West England. The county and Cumbria County Council, its local government, came into existence in 1974 after the passage of the Local Government Act 1972. Cumbria's county town is Carlisle, in the north of the county, and the only other major urban area is Barrow-in-Furness on the southwestern tip of the county.
England is a country that is part of the United Kingdom. It shares land borders with Wales to the west and Scotland to the north-northwest. The Irish Sea lies west of England and the Celtic Sea lies to the southwest. England is separated from continental Europe by the North Sea to the east and the English Channel to the south. The country covers five-eighths of the island of Great Britain, which lies in the North Atlantic, and includes over 100 smaller islands, such as the Isles of Scilly and the Isle of Wight.
The results saw Labour remain in control of the council after staying on 31 seats. [2] The Conservatives made a gain of 3 seats to have 19 councillors, while just 1 independent remained. [2]
The Conservative Party, officially the Conservative and Unionist Party, is a centre-right political party in the United Kingdom. Presently led by Theresa May, it has been the governing party since 2010. It presently has 314 Members of Parliament in the House of Commons, 249 members of the House of Lords, and 18 members of the European Parliament. It also has 31 Members of the Scottish Parliament, 12 members of the Welsh Assembly, eight members of the London Assembly and 9,008 local councillors. One of the major parties of UK politics, it has formed the government on 45 occasions, more than any other party.
A Councillor is a member of a local government council.
Party | Seats | Gains | Losses | Net gain/loss | Seats % | Votes % | Votes | +/− | |
---|---|---|---|---|---|---|---|---|---|
Labour | 31 | 2 | 2 | 0 | 60.8 | 53.1 | 18,314 | -4.6% | |
Conservative | 19 | 3 | 0 | +3 | 37.3 | 43.6 | 15,023 | +8.6% | |
Independent | 1 | 0 | 3 | -3 | 2.0 | 1.6 | 551 | -2.1% | |
Liberal Democrat | 0 | 0 | 0 | 0 | 0 | 1.7 | 573 | -1.9% | |
2 Conservative candidates were unopposed. [3]
Party | Candidate | Votes | % | ± | |
---|---|---|---|---|---|
Independent | Joseph Sunderland | 241 | 54.0 | -17.0 | |
Conservative | Marie Simpson | 106 | 23.8 | +23.8 | |
Labour | Cam Ross | 99 | 22.2 | -6.8 | |
Majority | 135 | 30.3 | -11.7 | ||
Turnout | 446 | ||||
Independent hold | Swing | ||||
Party | Candidate | Votes | % | ± | |
---|---|---|---|---|---|
Conservative | Yvonne Clarkson | 604 | 42.0 | ||
Conservative | John Jackson | 579 | 40.3 | ||
Labour | John Woolley | 255 | 17.7 | ||
Turnout | 1,438 | ||||
Conservative hold | Swing | ||||
Party | Candidate | Votes | % | ± | |
---|---|---|---|---|---|
Conservative | Keith Hitchen | unopposed | |||
Conservative hold | Swing | ||||
Party | Candidate | Votes | % | ± | |
---|---|---|---|---|---|
Conservative | Christopher Whiteside | 651 | |||
Conservative | Allan Mossop | 636 | |||
Conservative | Alexander Carroll | 617 | |||
Labour | James Hewitson | 508 | |||
Labour | Les Hanley | 453 | |||
Labour | Jeanette Williams | 435 | |||
Turnout | 3,300 | ||||
Conservative hold | Swing | ||||
Conservative gain from Labour | Swing | ||||
Party | Candidate | Votes | % | ± | |
---|---|---|---|---|---|
Labour | Joan Hully | 540 | |||
Labour | William Southward | 525 | |||
Labour | Hugh Branney | 497 | |||
Conservative | Doreen Platt | 217 | |||
Turnout | 1,779 | ||||
Labour hold | Swing | ||||
Party | Candidate | Votes | % | ± | |
---|---|---|---|---|---|
Labour | Catherine Giel | 386 | |||
Labour | David Banks | 365 | |||
Conservative | Hilda Morris | 148 | |||
Turnout | 899 | ||||
Labour hold | Swing | ||||
Party | Candidate | Votes | % | ± | |
---|---|---|---|---|---|
Labour | Willis Metherell | 523 | |||
Labour | Brian Dixon | 495 | |||
Labour | John Bowman | 465 | |||
Liberal Democrat | Frank Hollowell | 357 | |||
Conservative | Victoria Vincent | 229 | |||
Turnout | 2,069 | ||||
Labour hold | Swing | ||||
Labour gain from Independent | Swing | ||||
Party | Candidate | Votes | % | ± | |
---|---|---|---|---|---|
Labour | Elaine Woodburn | 740 | |||
Labour | Samuel Meteer | 724 | |||
Labour | Margaret Woodburn | 724 | |||
Conservative | Kenneth Kirkby | 273 | |||
Conservative | Mary Holmes | 241 | |||
Conservative | John Brown | 186 | |||
Turnout | 2,888 | ||||
Labour hold | Swing | ||||
Party | Candidate | Votes | % | ± | |
---|---|---|---|---|---|
Labour | Michael McVeigh | 667 | |||
Labour | Peter Watson | 618 | |||
Labour | Constance Watson | 580 | |||
Conservative | John Coyles | 488 | |||
Conservative | John Holmes | 488 | |||
Conservative | Jean Lewthwaite | 465 | |||
Turnout | 3,306 | ||||
Labour hold | Swing | ||||
Party | Candidate | Votes | % | ± | |
---|---|---|---|---|---|
Conservative | Robert Salkeld | 204 | 58.3 | -10.4 | |
Liberal Democrat | Mike Minogue | 86 | 24.6 | +24.6 | |
Labour | Mary Ross | 60 | 17.1 | -14.2 | |
Majority | 118 | 33.7 | -3.7 | ||
Turnout | 350 | ||||
Conservative hold | Swing | ||||
Party | Candidate | Votes | % | ± | |
---|---|---|---|---|---|
Labour | Peter Connolly | 377 | |||
Labour | Timothy Knowles | 343 | |||
Conservative | Kenneth Simpson | 238 | |||
Turnout | 958 | ||||
Labour hold | Swing | ||||
Labour gain from Independent | Swing | ||||
Party | Candidate | Votes | % | ± | |
---|---|---|---|---|---|
Conservative | Alan Jacob | 328 | 71.0 | -0.9 | |
Labour | Christina Cornall | 134 | 29.0 | +0.9 | |
Majority | 194 | 42.0 | -1.8 | ||
Turnout | 462 | ||||
Conservative hold | Swing | ||||
Party | Candidate | Votes | % | ± | |
---|---|---|---|---|---|
Labour | John Kane | 656 | |||
Labour | Frances Bradshaw | 574 | |||
Labour | Henry Wormstrup | 556 | |||
Conservative | Brigid Whiteside | 412 | |||
Conservative | Andrew Welsh | 403 | |||
Conservative | Graham Roberts | 385 | |||
Turnout | 2,986 | ||||
Labour hold | Swing | ||||
Party | Candidate | Votes | % | ± | |
---|---|---|---|---|---|
Conservative | Douglas Wilson | 228 | 41.1 | -8.3 | |
Independent | Margaret Barnes | 180 | 32.4 | +32.4 | |
Labour | Carl Carter | 147 | 26.5 | +26.5 | |
Majority | 48 | 8.6 | |||
Turnout | 555 | ||||
Conservative gain from Independent | Swing | ||||
Party | Candidate | Votes | % | ± | |
---|---|---|---|---|---|
Labour | Geoffrey Garrity | 562 | |||
Labour | Norman Willams | 501 | |||
Labour | Margarita Docherty | 454 | |||
Conservative | Martyn Barnes | 338 | |||
Conservative | Marcus Swift | 298 | |||
Turnout | 2,153 | ||||
Labour hold | Swing | ||||
Party | Candidate | Votes | % | ± | |
---|---|---|---|---|---|
Conservative | Alistair Norwood | 468 | |||
Conservative | Andrew Wonnacott | 422 | |||
Labour | Calvin Jones | 265 | |||
Turnout | 1,155 | ||||
Conservative hold | Swing | ||||
Party | Candidate | Votes | % | ± | |
---|---|---|---|---|---|
Conservative | Frederick Gleaves | 396 | |||
Labour | John Park | 305 | |||
Labour | Roland Woodward | 281 | |||
Conservative | Rowena Pitt | 272 | |||
Liberal Democrat | Jane Micklethwaite | 130 | |||
Independent | Neil Wilson | 130 | |||
Turnout | 1,514 | ||||
Conservative hold | Swing | ||||
Labour hold | Swing | ||||
Party | Candidate | Votes | % | ± | |
---|---|---|---|---|---|
Labour | George Clements | 273 | |||
Labour | Alan Holliday | 241 | |||
Conservative | Glenn Gray | 121 | |||
Turnout | 635 | ||||
Labour hold | Swing | ||||
Party | Candidate | Votes | % | ± | |
---|---|---|---|---|---|
Conservative | Gilbert Scurrah | unopposed | |||
Conservative hold | Swing | ||||
Party | Candidate | Votes | % | ± | |
---|---|---|---|---|---|
Labour | Anne Faichney | 648 | |||
Labour | Edward Brenan | 516 | |||
Labour | Paul Whalley | 462 | |||
Conservative | Dorothy Wonnacott | 150 | |||
Conservative | George Higgins | 141 | |||
Conservative | Leah Higgins | 135 | |||
Turnout | 2,052 | ||||
Labour hold | Swing | ||||
Party | Candidate | Votes | % | ± | |
---|---|---|---|---|---|
Labour | Geoffrey Blackwell | 200 | 54.3 | -0.6 | |
Conservative | Gareth Maley | 168 | 45.7 | +0.6 | |
Majority | 32 | 8.7 | -1.1 | ||
Turnout | 368 | ||||
Labour hold | Swing | ||||
Party | Candidate | Votes | % | ± | |
---|---|---|---|---|---|
Conservative | Francis Heathcote | 722 | |||
Conservative | Raymond Cole | 718 | |||
Conservative | Robin Pitt | 475 | |||
Labour | Anthony Gilmore | 341 | |||
Turnout | 2,256 | ||||
Conservative hold | Swing | ||||
Party | Candidate | Votes | % | ± | |
---|---|---|---|---|---|
Labour | Peter Tyson | 243 | |||
Labour | James Prince | 202 | |||
Conservative | David Gray | 147 | |||
Turnout | 592 | ||||
Labour hold | Swing | ||||
Party | Candidate | Votes | % | ± | |
---|---|---|---|---|---|
Conservative | David Moore | 798 | |||
Conservative | Eileen Eastwood | 738 | |||
Labour | Les Tuley | 233 | |||
Turnout | 1,769 | ||||
Conservative hold | Swing | ||||
Party | Candidate | Votes | % | ± | |
---|---|---|---|---|---|
Conservative | Norman Clarkson | 390 | 73.4 | -1.2 | |
Labour | Esther Clements | 141 | 26.6 | +1.2 | |
Majority | 249 | 46.9 | -2.3 | ||
Turnout | 531 | ||||
Conservative hold | Swing | ||||
Copeland Borough Council in Cumbria, England is elected every four years. Since the last boundary changes in 1999, 51 councillors have been elected from 25 wards.
The 2010 Great Yarmouth Borough Council election took place on 6 May 2010 to elect members of Great Yarmouth Borough Council in Norfolk, England. One third of the council was up for election and the Conservative party stayed in overall control of the council.
The 2007 Pendle Borough Council election took place on 3 May 2007 to elect members of Pendle Borough Council in Lancashire, England. One third of the council was up for election and the Liberal Democrats stayed in overall control of the council.
The 2007 Sandwell Metropolitan Borough Council election took place on 3 May 2007 to elect members of Sandwell Metropolitan Borough Council in the West Midlands, England. One third of the council was up for election and the Labour party stayed in overall control of the council.
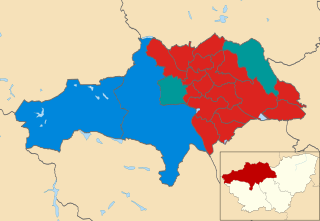
The 2011 Barnsley Metropolitan Borough Council election took place on 5 May 2011 to elect members of Barnsley Metropolitan Borough Council in South Yorkshire, England. One third of the council was up for election and the Labour party stayed in overall control of the council.
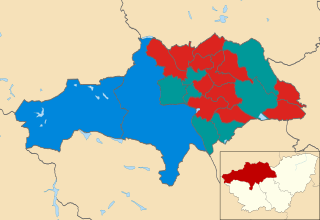
The 2007 Barnsley Metropolitan Borough Council election took place on 3 May 2007 to elect members of Barnsley Metropolitan Borough Council in South Yorkshire, England. One third of the council was up for election and the Labour party stayed in overall control of the council.
The 2011 Basildon Council election took place on 5 May 2011 to elect members of Basildon Borough Council in Essex, England. One third of the council was up for election and the Conservative party stayed in overall control of the council.
The 2002 Basingstoke and Deane Council election took place on 2 May 2002 to elect members of Basingstoke and Deane Borough Council in Hampshire, England. The whole council was up for election with boundary changes since the last election in 2000 increasing the number of seats by 3. The council stayed under no overall control.
The 2007 Basingstoke and Deane Council election took place on 3 May 2007 to elect members of Basingstoke and Deane Borough Council in Hampshire, England. One third of the council was up for election and the Conservative party stayed in overall control of the council.
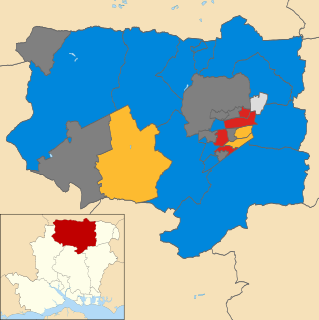
The 2011 Basingstoke and Deane Council election took place on 5 May 2011 to elect members of Basingstoke and Deane Borough Council in Hampshire, England. One third of the council was up for election and the Conservative party stayed in overall control of the council.
The 2011 Copeland Borough Council election took place on 5 May 2011 to elect members of Copeland Borough Council in Cumbria, England. The whole council was up for election and the Labour party stayed in overall control of the council.
The 2007 Walsall Metropolitan Borough Council election took place on 3 May 2007 to elect members of Walsall Metropolitan Borough Council in the West Midlands, England. One third of the council was up for election and the Conservative party stayed in overall control of the council.
The 2007 Hertsmere Borough Council election took place on 3 May 2007 to elect members of Hertsmere Borough Council in Hertfordshire, England. One third of the council was up for election and the Conservative party stayed in overall control of the council.
The 2007 Redcar and Cleveland Borough Council election took place on 3 May 2007 to elect members of Redcar and Cleveland Unitary Council in England. The whole council was up for election and the council stayed under no overall control.
The 2007 Carlisle City Council election took place on 3 May 2007 to elect members of Carlisle District Council in Cumbria, England. One third of the council was up for election and the council stayed under no overall control.
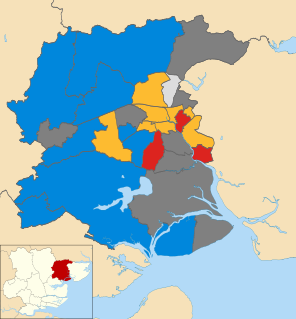
The 2011 Colchester Borough Council election took place on 5 May 2011 to elect members of Colchester Borough Council in Essex, England. One third of the council was up for election and the council stayed under no overall control.
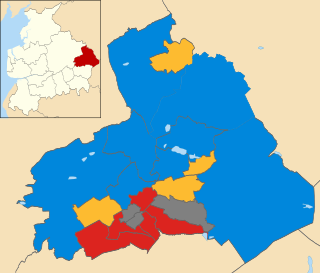
The 2011 Pendle Borough Council election took place on 5 May 2011 to elect members of Pendle Borough Council in Lancashire, England. One third of the council was up for election and the council stayed under no overall control.
The 2007 Castle Point Borough Council election took place on 3 May 2007 to elect members of Castle Point Borough Council in Essex, England. One third of the council was up for election and the Conservative party stayed in overall control of the council.
The 2014 Brent London Borough Council election took place on 22 May 2014 to elect members of Brent London Borough Council in London, England. The whole council was up for election and the Labour Party stayed in overall control of the council.
The 2007 Swale Borough Council election took place on 3 May 2007 to elect members of Swale Borough Council in Kent, England. One third of the council was up for election and the Conservative party stayed in overall control of the council.