This is a list of electoral results for the division of Braddon in Tasmanian elections since 1913.
Party | Candidate | Votes | % | ±% | |
---|---|---|---|---|---|
Quota | 11,661 | ||||
Liberal | Jeremy Rockliff (elected 1) | 19,186 | 27.4 | +1.6 | |
Liberal | Felix Ellis | 6,229 | 8.9 | +6.0 | |
Liberal | Adam Brooks (elected 5) | 6,202 | 8.9 | −6.7 | |
Liberal | Roger Jaensch (elected 4) | 4,833 | 6.9 | +0.4 | |
Liberal | Lara Hendriks | 1,856 | 2.7 | +2.7 | |
Liberal | Stacey Sheehan | 1,708 | 2.4 | +2.4 | |
Labor | Shane Broad (elected 3) | 6,034 | 8.6 | +0.3 | |
Labor | Anita Dow (elected 2) | 5,640 | 8.1 | −0.7 | |
Labor | Justine Keay | 4,132 | 5.9 | +5.9 | |
Labor | Michelle Rippon | 1,454 | 2.1 | +2.1 | |
Labor | Amanda Diprose | 1,300 | 1.9 | +1.9 | |
Independent | Craig Garland | 4,236 | 6.1 | +3.0 | |
Greens | Darren Briggs | 1,853 | 2.6 | +2.6 | |
Greens | Tammy Milne | 670 | 1.0 | +1.0 | |
Greens | Emily Murray | 584 | 0.8 | +0.8 | |
Greens | Phill Parsons | 403 | 0.6 | +0.6 | |
Greens | Maureen Corbett | 372 | 0.5 | +0.5 | |
Shooters, Fishers, Farmers | Brenton Jones | 1,648 | 2.4 | +2.4 | |
Shooters, Fishers, Farmers | Kim Swanson | 990 | 1.4 | +1.4 | |
Independent | Liz Hamer | 337 | 0.5 | +0.3 | |
Independent | Matthew Morgan | 294 | 0.4 | +0.4 | |
Total formal votes | 69,961 | 94.6 | +0.2 | ||
Informal votes | 3,963 | 5.4 | −0.2 | ||
Turnout | 73,924 | 91.0 | −1.5 | ||
Party total votes | |||||
Liberal | 40,014 | 57.2 | +1.1 | ||
Labor | 18,560 | 26.5 | −0.8 | ||
Independent | Craig Garland | 4,236 | 6.1 | +6.1 | |
Greens | 3,882 | 5.5 | +2.0 | ||
Shooters, Fishers, Farmers | 2,638 | 3.8 | +3.8 | ||
Independent | Liz Hamer | 337 | 0.5 | +0.5 | |
Independent | Matthew Morgan | 294 | 0.4 | +0.4 | |
Liberal hold | Swing | +1.6 | |||
Liberal hold | Swing | –6.7 | |||
Liberal hold | Swing | +0.4 | |||
Labor hold | Swing | +0.3 | |||
Labor hold | Swing | –0.7 |
Party | Candidate | Votes | % | ±% | |
---|---|---|---|---|---|
Quota | 10,719 | ||||
Liberal | Jeremy Rockliff (elected 1) | 16,612 | 25.8 | +0.8 | |
Liberal | Adam Brooks (elected 2) | 10,004 | 15.6 | −8.0 | |
Liberal | Roger Jaensch (elected 5) | 4,171 | 6.5 | +1.8 | |
Liberal | Joan Rylah | 3,436 | 5.3 | +1.2 | |
Liberal | Felix Ellis | 1,842 | 2.9 | +2.9 | |
Labor | Anita Dow (elected 3) | 5,637 | 8.8 | +8.8 | |
Labor | Shane Broad (elected 4) | 5,336 | 8.3 | +4.2 | |
Labor | Themba Bulle | 2,757 | 4.3 | +4.3 | |
Labor | Danielle Kidd | 2,113 | 3.3 | +3.3 | |
Labor | Wayne Roberts | 1,709 | 2.7 | +2.7 | |
Lambie | Gina Timms | 1,139 | 1.8 | +1.8 | |
Lambie | Rodney Flowers | 818 | 1.3 | +1.3 | |
Lambie | Roz Flanagan | 682 | 1.1 | +1.1 | |
Lambie | Tim Lovell | 610 | 0.9 | +0.9 | |
Lambie | Colin Smith | 556 | 0.9 | +0.9 | |
Greens | Scott Jordan | 1,205 | 1.9 | +1.9 | |
Greens | Sally O'Wheel | 352 | 0.5 | +0.5 | |
Greens | Julie Norbury | 295 | 0.5 | +0.5 | |
Greens | Tom Kingston | 238 | 0.4 | +0.4 | |
Greens | Philip Nicholas | 207 | 0.3 | −0.2 | |
Independent | Craig Garland | 1,967 | 3.1 | +3.1 | |
Shooters, Fishers, Farmers | Glen Saltmarsh | 580 | 0.9 | +0.9 | |
Shooters, Fishers, Farmers | Brett Neal | 459 | 0.7 | +0.7 | |
Shooters, Fishers, Farmers | Brenton Jones | 330 | 0.5 | +0.5 | |
Shooters, Fishers, Farmers | Kim Swanson | 242 | 0.4 | +0.4 | |
Independent | Brenton Best | 593 | 0.9 | +0.9 | |
Tasmanians 4 Tasmania | Steven Honey | 164 | 0.3 | +0.3 | |
Tasmanians 4 Tasmania | Cherie Halkett | 112 | 0.2 | +0.2 | |
Independent | Liz Hamer | 141 | 0.2 | +0.2 | |
Total formal votes | 64,307 | 94.4 | −0.5 | ||
Informal votes | 3,791 | 5.6 | +0.5 | ||
Turnout | 68,908 | 92.5 | −1.3 | ||
Party total votes | |||||
Liberal | 36,065 | 56.1 | −2.7 | ||
Labor | 17,552 | 27.3 | +4.1 | ||
Lambie | 3,805 | 5.9 | +5.9 | ||
Greens | 2,297 | 3.6 | −3.5 | ||
Independent | Craig Garland | 1,967 | 3.1 | +3.1 | |
Shooters, Fishers, Farmers | 1,611 | 2.5 | +2.5 | ||
Independent | Brenton Best | 593 | 0.9 | +0.9 | |
Tasmanians 4 Tasmania | 276 | 0.4 | +0.4 | ||
Independent | Liz Hamer | 141 | 0.2 | +0.2 | |
Liberal hold | Swing | +0.8 | |||
Liberal hold | Swing | –8.0 | |||
Liberal hold | Swing | +1.8 | |||
Labor hold | Swing | +8.8 | |||
Labor gain from Liberal | Swing | +4.2 |
Party | Candidate | Votes | % | ±% | |
---|---|---|---|---|---|
Quota | 10,716 | ||||
Liberal | Adam Brooks (elected 1) | 16,073 | 25.0 | +14.2 | |
Liberal | Jeremy Rockliff (elected 2) | 15,168 | 23.6 | +6.5 | |
Liberal | Roger Jaensch (elected 4) | 3,009 | 4.7 | +4.7 | |
Liberal | Joan Rylah (elected 5) | 2,633 | 4.1 | +4.1 | |
Liberal | Kyron Howell | 895 | 1.4 | +1.4 | |
Labor | Bryan Green (elected 3) | 6,606 | 10.3 | -7.1 | |
Labor | Brenton Best | 3,648 | 5.7 | -5.3 | |
Labor | Shane Broad | 2,654 | 4.1 | -1.0 | |
Labor | Justine Keay | 1,382 | 2.1 | +2.1 | |
Labor | Darryl Bessell | 653 | 1.0 | +1.0 | |
Palmer United | Kevin Morgan | 2,291 | 3.6 | +3.6 | |
Palmer United | Steve Green | 847 | 1.3 | +1.3 | |
Palmer United | Kev Deakin | 539 | 0.8 | +0.8 | |
Palmer United | Scott Alexander | 533 | 0.8 | +0.8 | |
Palmer United | Julian Brown | 404 | 0.6 | +0.6 | |
Greens | Paul O'Halloran | 3,294 | 5.1 | -3.8 | |
Greens | Melissa Houghton | 409 | 0.6 | -0.5 | |
Greens | Philip Nicholas | 314 | 0.5 | +0.5 | |
Greens | Sally O'Wheel | 253 | 0.4 | +0.4 | |
Greens | Chris Cornell | 249 | 0.4 | +0.4 | |
National | Ken Dorsey | 747 | 1.2 | +1.2 | |
National | Benji Benjamin | 507 | 0.8 | +0.8 | |
National | Liz van der Linde-Keep | 135 | 0.2 | +0.2 | |
Christians | Kevin Swarts | 535 | 0.8 | +0.8 | |
Independent | Mick Anderson | 412 | 0.6 | +0.6 | |
Independent | Tony Brown | 101 | 0.2 | +0.2 | |
Total formal votes | 64,291 | 94.9 | -0.2 | ||
Informal votes | 3,466 | 5.1 | +0.2 | ||
Turnout | 67,757 | 93.8 | -0.3 | ||
Party total votes | |||||
Liberal | 37,778 | 58.8 | +13.6 | ||
Labor | 14,943 | 23.2 | -17.0 | ||
Palmer United | 4,614 | 7.2 | +7.2 | ||
Greens | 4,519 | 7.0 | -6.8 | ||
National | 1,389 | 2.2 | +2.2 | ||
Christians | 535 | 0.8 | +0.8 | ||
Independent | Mick Anderson | 412 | 0.6 | +0.6 | |
Independent | Tony Brown | 101 | 0.2 | +0.2 | |
Liberal hold | Swing | +14.2 | |||
Liberal hold | Swing | +6.5 | |||
Liberal gain from Labor | Swing | +4.7 | |||
Liberal gain from Greens | Swing | +4.1 | |||
Labor hold | Swing | –7.1 |
Party | Candidate | Votes | % | ±% | |
---|---|---|---|---|---|
Quota | 10,747 | ||||
Liberal | Jeremy Rockliff (elected 2) | 10,994 | 17.1 | +1.9 | |
Liberal | Adam Brooks (elected 4) | 6,972 | 10.8 | +10.8 | |
Liberal | Brett Whiteley | 5,547 | 8.6 | -0.1 | |
Liberal | Leonie Hiscutt | 2,715 | 4.2 | +4.2 | |
Liberal | Grant Dunham | 1,201 | 1.9 | +1.9 | |
Liberal | Philip Lamont | 1,115 | 1.7 | +1.7 | |
Liberal | Colin Lamont | 594 | 0.9 | +0.9 | |
Labor | Bryan Green (elected 1) | 11,221 | 17.4 | -7.0 | |
Labor | Brenton Best (elected 3) | 7,087 | 11.0 | +0.9 | |
Labor | Shane Broad | 3,303 | 5.1 | +5.1 | |
Labor | Judy Richmond | 2,309 | 3.6 | +3.6 | |
Labor | Kay Eastley | 2,027 | 3.1 | +3.1 | |
Greens | Paul O'Halloran (elected 5) | 5,718 | 8.9 | +2.1 | |
Greens | Ted Field | 894 | 1.4 | +1.4 | |
Greens | Clair Gilmour | 781 | 1.2 | +1.2 | |
Greens | David Henderson | 746 | 1.2 | +1.2 | |
Greens | Melissa Houghton | 735 | 1.1 | +1.1 | |
Independent | Timothy Kidd | 270 | 0.4 | +0.4 | |
Independent | Valerie Blake | 247 | 0.4 | +0.4 | |
Total formal votes | 64,476 | 95.1 | -0.3 | ||
Informal votes | 3,297 | 4.9 | +0.3 | ||
Turnout | 67,773 | 94.1 | -1.0 | ||
Party total votes | |||||
Liberal | 29,138 | 45.2 | +8.6 | ||
Labor | 25,947 | 40.2 | -11.2 | ||
Greens | 8,874 | 13.8 | +3.4 | ||
Independent | Timothy Kidd | 270 | 0.4 | +0.4 | |
Independent | Valerie Blake | 247 | 0.4 | +0.4 |
Party | Candidate | Votes | % | ±% | |
---|---|---|---|---|---|
Quota | 10,552 | ||||
Labor | Bryan Green (elected 1) | 15,468 | 24.4 | +7.4 | |
Labor | Steve Kons (elected 3) | 6,988 | 11.0 | -3.0 | |
Labor | Brenton Best (elected 4) | 6,378 | 10.1 | -0.6 | |
Labor | Peter Hollister | 2,135 | 3.4 | +3.4 | |
Labor | Leonie Batchelor | 1,215 | 1.9 | +1.9 | |
Liberal | Jeremy Rockliff (elected 2) | 9,630 | 15.2 | +2.1 | |
Liberal | Brett Whiteley (elected 5) | 5,529 | 8.7 | +1.3 | |
Liberal | Heather Woodward | 3,179 | 5.0 | +5.0 | |
Liberal | Leon Perry | 2,977 | 4.7 | +4.7 | |
Liberal | John Oldaker | 2,280 | 3.6 | +3.6 | |
Greens | Paul O'Halloran | 4,297 | 6.8 | +0.3 | |
Greens | Andrea Jackson | 669 | 1.1 | +1.1 | |
Greens | Dianne Ransley | 624 | 1.0 | +1.0 | |
Greens | Scott Jordan | 545 | 0.9 | +0.9 | |
Greens | John Coombes | 394 | 0.6 | +0.6 | |
Independent | Steve Martin | 1,001 | 1.6 | +1.6 | |
Total formal votes | 63,309 | 95.4 | +0.2 | ||
Informal votes | 3,085 | 4.6 | -0.2 | ||
Turnout | 66,394 | 95.1 | +0.8 | ||
Party total votes | |||||
Labor | 32,184 | 50.8 | -2.3 | ||
Liberal | 23,595 | 37.2 | +4.1 | ||
Greens | 6,529 | 10.4 | -1.7 | ||
Independent | Steve Martin | 1,001 | 1.6 | +1.6 |
Party | Candidate | Votes | % | ±% | |
---|---|---|---|---|---|
Quota | 10,140 | ||||
Labor | Bryan Green (elected 1) | 10,339 | 17.0 | +9.7 | |
Labor | Steve Kons (elected 3) | 8,517 | 14.0 | -3.6 | |
Labor | Brenton Best (elected 4) | 6,472 | 10.6 | +3.3 | |
Labor | Mike Gaffney | 5,720 | 9.4 | +9.4 | |
Labor | Renai Ellings | 711 | 1.2 | +1.2 | |
Labor | Harvey Clarke | 592 | 1.0 | +1.0 | |
Liberal | Jeremy Rockliff (elected 2) | 7,957 | 13.1 | +13.1 | |
Liberal | Brett Whiteley (elected 5) | 4,527 | 7.4 | +1.0 | |
Liberal | Mike Downie | 3,496 | 5.7 | +5.7 | |
Liberal | Alan Pattison | 3,040 | 5.0 | +5.0 | |
Liberal | Peter Upton | 1,130 | 1.9 | +1.9 | |
Greens | Paul O'Halloran | 3,943 | 6.5 | +6.1 | |
Greens | Clare Thompson | 1,317 | 2.2 | +1.9 | |
Greens | Felicity Harris | 790 | 1.3 | +1.3 | |
Greens | Carol Reilly | 640 | 1.1 | +1.1 | |
Greens | Patrick Johnson | 601 | 1.0 | +1.0 | |
Group D | Malcolm Ryan | 489 | 0.8 | +0.8 | |
Group D | John Kelly | 250 | 0.4 | +0.4 | |
Independent | Gatty Burnett | 307 | 0.5 | +0.5 | |
Total formal votes | 60,838 | 95.2 | -0.6 | ||
Informal votes | 3,090 | 4.8 | +0.6 | ||
Turnout | 63,928 | 94.3 | -1.8 | ||
Party total votes | |||||
Labor | 32,351 | 53.2 | +9.1 | ||
Liberal | 20,150 | 33.1 | -9.1 | ||
Greens | 7,291 | 12.0 | +3.9 | ||
Group D | 739 | 1.2 | +1.2 | ||
Independent | Gatty Burnett | 307 | 0.5 | +0.5 |
Party | Candidate | Votes | % | ±% | |
---|---|---|---|---|---|
Quota | 9,355 | ||||
Labor | Steve Kons (elected 2) | 9,881 | 17.6 | +17.6 | |
Labor | Brenton Best (elected 3) | 4,087 | 7.3 | +2.9 | |
Labor | Bryan Green (elected 4) | 4,088 | 7.3 | +2.7 | |
Labor | Mike Gard | 2,272 | 4.0 | +1.4 | |
Labor | Peter Hollister | 2,007 | 3.6 | +3.6 | |
Labor | Ella Bramich | 1,585 | 2.8 | +2.8 | |
Labor | Stuart Mackey | 810 | 1.4 | +1.4 | |
Liberal | Tony Rundle (elected 1) | 12,903 | 23.0 | +13.2 | |
Liberal | Brett Whiteley | 3,599 | 6.4 | +6.4 | |
Liberal | Carole Cains | 3,365 | 6.0 | -0.2 | |
Liberal | Bill Bonde (elected 5) | 3,248 | 5.8 | -7.2 | |
Liberal | Michael Wickham | 602 | 1.1 | +0.1 | |
Greens | Di Hollister | 3,925 | 7.0 | -1.0 | |
Greens | Paul O'Halloran | 200 | 0.4 | +0.2 | |
Greens | Oliver Field | 170 | 0.3 | +0.3 | |
Greens | Clare Thompson | 164 | 0.3 | +0.3 | |
Greens | Karin Packer | 104 | 0.2 | +0.2 | |
Tasmania First | Peter Rettke | 621 | 1.1 | +1.1 | |
Tasmania First | Gavin Thompson | 552 | 1.0 | +1.0 | |
Tasmania First | Petita Abblitt | 349 | 0.6 | +0.6 | |
Tasmania First | Wally Weaver | 219 | 0.4 | +0.4 | |
Tasmania First | Gary Lane | 168 | 0.3 | +0.3 | |
Group E | Peter Stokes | 348 | 0.6 | +0.6 | |
Group E | Andrew Vanderfeen | 258 | 0.5 | -0.2 | |
Group B | Laurie Heathorn | 250 | 0.4 | +0.3 | |
Group B | John Mackenzie | 62 | 0.1 | 0.0 | |
Independent | Rodney Blenkhorn | 289 | 0.5 | +0.5 | |
Total formal votes | 56,126 | 95.8 | +1.4 | ||
Informal votes | 2,456 | 4.2 | -1.4 | ||
Turnout | 58,582 | 96.1 | -0.4 | ||
Party total votes | |||||
Labor | 24,730 | 44.1 | +9.7 | ||
Liberal | 23,717 | 42.2 | -7.4 | ||
Greens | 7,789 | 13.1 | -0.9 | ||
Tasmania First | 1,909 | 3.4 | +3.4 | ||
Group E | 606 | 1.1 | +1.1 | ||
Group B | 312 | 0.6 | -0.7 | ||
Independent | Rodney Blenkhorn | 289 | 0.5 | +0.5 |
Party | Candidate | Votes | % | ±% | |
---|---|---|---|---|---|
Quota | 7,100 | ||||
Liberal | Bill Bonde (elected 2) | 7,379 | 13.0 | +2.0 | |
Liberal | Roger Groom (elected 3) | 6,298 | 11.1 | -11.5 | |
Liberal | Tony Rundle (elected 4) | 5,562 | 9.8 | -2.7 | |
Liberal | Ron Cornish (elected 5) | 4,131 | 7.3 | -2.8 | |
Liberal | Carole Cains | 3,505 | 6.2 | +1.4 | |
Liberal | Ray Baldock | 734 | 1.3 | +1.3 | |
Liberal | Michael Wickham | 570 | 1.0 | +1.0 | |
Labor | Michael Field (elected 1) | 7,955 | 14.0 | +1.5 | |
Labor | Bryan Green | 2,588 | 4.6 | +4.6 | |
Labor | Brenton Best (elected 6) | 2,493 | 4.4 | +4.4 | |
Labor | Yvonne Bird | 1,698 | 3.0 | +3.0 | |
Labor | Greg Richardson | 1,532 | 2.7 | +0.8 | |
Labor | Mike Gard | 1,477 | 2.6 | +2.6 | |
Labor | Jim Altimira | 1,262 | 2.2 | +1.3 | |
Labor | Sally Schnackenberg | 508 | 0.9 | +0.9 | |
Greens | Di Hollister (elected 7) | 4,561 | 8.0 | +0.4 | |
Greens | Paul O'Halloran | 146 | 0.3 | +0.3 | |
Greens | Faye Dixon | 129 | 0.2 | +0.2 | |
Greens | Jon Paice | 108 | 0.2 | -0.1 | |
Greens | Eddie Storace | 101 | 0.2 | +0.2 | |
Greens | Jo Kelly | 94 | 0.2 | +0.2 | |
Greens | John Wilson | 55 | 0.1 | +0.1 | |
National | Virginia Holmes | 910 | 1.6 | +1.6 | |
National | Steve Stevenson | 459 | 0.8 | +0.8 | |
National | Grant Goodwin | 424 | 0.7 | +0.7 | |
National | Geoff Leslie | 411 | 0.7 | +0.7 | |
National | George Lee | 205 | 0.4 | +0.4 | |
National | Henry Eiler | 86 | 0.2 | +0.2 | |
Group B | David Bissett | 644 | 1.1 | +1.1 | |
Group B | Laurie Heathorn | 83 | 0.1 | +0.1 | |
Independent | Andrew Vanderfeen | 395 | 0.7 | +0.7 | |
Extremely Greedy 40% | Martin Duffy | 128 | 0.2 | +0.2 | |
Extremely Greedy 40% | Patrick Carnuccio | 103 | 0.2 | +0.2 | |
Independent | John Mackenzie | 58 | 0.1 | +0.1 | |
Total formal votes | 56,792 | 94.4 | -1.5 | ||
Informal votes | 3,380 | 5.6 | +1.5 | ||
Turnout | 60,172 | 96.5 | +0.8 | ||
Party total votes | |||||
Liberal | 28,179 | 49.6 | -16.1 | ||
Labor | 19,513 | 34.4 | +13.6 | ||
Greens | 5,194 | 9.1 | +0.3 | ||
National | 2,495 | 4.4 | +4.4 | ||
Group B | 727 | 1.3 | +1.3 | ||
Independent | Andrew Vanderfeen | 395 | 0.7 | +0.7 | |
Extremely Greedy 40% | 231 | 0.4 | +0.4 | ||
Independent | John Mackenzie | 58 | 0.1 | +0.1 |
Party | Candidate | Votes | % | ±% | |
---|---|---|---|---|---|
Quota | 7,129 | ||||
Liberal | Roger Groom (elected 1) | 12,886 | 22.6 | +4.5 | |
Liberal | Tony Rundle (elected 2) | 7,102 | 12.5 | 0.0 | |
Liberal | Bill Bonde (elected 4) | 6,286 | 11.0 | -1.2 | |
Liberal | Ron Cornish (elected 3) | 5,787 | 10.1 | +0.1 | |
Liberal | Carole Cains (elected 6) | 2,731 | 4.8 | +1.6 | |
Liberal | Gerald Heathcote | 1,571 | 2.8 | +2.8 | |
Liberal | Tony Van Rooyen | 1,105 | 1.9 | +1.9 | |
Labor | Michael Field (elected 5) | 7,128 | 12.5 | -3.1 | |
Labor | Michael Weldon | 1,573 | 2.8 | -2.7 | |
Labor | Sid Sidebottom | 1,095 | 1.9 | +1.9 | |
Labor | Greg Richardson | 1,077 | 1.9 | +1.9 | |
Labor | Jim Altimira | 520 | 0.9 | +0.9 | |
Labor | Neil McConnell | 260 | 0.5 | +0.5 | |
Labor | Colin Berry | 213 | 0.4 | +0.4 | |
Independent Greens | Di Hollister (elected 7) | 4,314 | 7.6 | -2.8 | |
Independent Greens | Jon Paice | 181 | 0.3 | +0.3 | |
Independent Greens | George Sanders | 144 | 0.3 | +0.3 | |
Independent Greens | Nicki Fletcher | 136 | 0.2 | +0.2 | |
Independent Greens | Peter Walford | 101 | 0.2 | -0.4 | |
Independent Greens | Richard Donaghey | 71 | 0.1 | +0.1 | |
Independent Greens | Ian Clare | 66 | 0.1 | +0.1 | |
Advance Tasmania | Gordon Ibbott | 706 | 1.2 | +1.2 | |
Advance Tasmania | Ken Last | 631 | 1.1 | +1.1 | |
Independent | Wayne Smith | 986 | 1.7 | +1.7 | |
Independent | Peter Rettke | 242 | 0.4 | +0.4 | |
Independent | Guy Coughlan | 113 | 0.2 | +0.2 | |
Total formal votes | 57,025 | 95.9 | +1.1 | ||
Informal votes | 2,425 | 4.1 | -1.1 | ||
Turnout | 59,450 | 95.7 | +2.1 | ||
Party total votes | |||||
Liberal | 37,468 | 65.7 | +8.2 | ||
Labor | 11,866 | 20.8 | -9.1 | ||
Independent Greens | 5,013 | 8.8 | -2.7 | ||
Advance Tasmania | 1,337 | 2.3 | +2.3 | ||
Independent | Wayne Smith | 986 | 1.7 | +1.7 | |
Independent | Peter Rettke | 242 | 0.4 | +0.4 | |
Independent | Guy Coughlan | 113 | 0.2 | +0.2 |
Party | Candidate | Votes | % | ±% | |
---|---|---|---|---|---|
Quota | 6,817 | ||||
Liberal | Roger Groom (elected 1) | 9,881 | 18.1 | -0.7 | |
Liberal | Tony Rundle (elected 3) | 6,807 | 12.5 | +1.7 | |
Liberal | Ron Cornish (elected 4) | 5,437 | 10.0 | -1.0 | |
Liberal | Bill Bonde (elected 5) | 5,342 | 9.8 | +2.3 | |
Liberal | Carole Cains | 1,727 | 3.2 | +3.2 | |
Liberal | Heather Wall | 1,157 | 2.1 | +2.1 | |
Liberal | Ron Nankervis | 977 | 1.8 | +1.8 | |
Labor | Michael Field (elected 2) | 8,486 | 15.6 | +6.9 | |
Labor | Michael Weldon (elected 7) | 3,009 | 5.5 | -2.1 | |
Labor | Greg Peart | 2,520 | 4.6 | -4.7 | |
Labor | David Currie | 884 | 1.6 | +1.6 | |
Labor | Tom Eggleston | 775 | 1.4 | +1.4 | |
Labor | David Nettleton | 340 | 0.6 | +0.6 | |
Labor | Bruce Tivendale | 269 | 0.5 | +0.5 | |
Independent Greens | Di Hollister (elected 6) | 5,657 | 10.4 | +10.4 | |
Independent Greens | Peter Walford | 339 | 0.6 | +0.6 | |
Independent Greens | Arnold Rowlands | 267 | 0.5 | +0.5 | |
Independent | Lawrence Edwards | 322 | 0.6 | +0.6 | |
Independent | Ted Nielsen | 161 | 0.3 | +0.3 | |
Independent | Heather Benjamin | 117 | 0.2 | +0.2 | |
Independent | George Lee | 55 | 0.1 | +0.1 | |
Total formal votes | 54,529 | 94.8 | 0.0 | ||
Informal votes | 3,017 | 5.2 | 0.0 | ||
Turnout | 57,546 | 93.6 | -1.2 | ||
Party total votes | |||||
Liberal | 31,328 | 57.5 | +2.6 | ||
Labor | 16,283 | 29.9 | -4.2 | ||
Independent Greens | 6,263 | 11.5 | +11.5 | ||
Independent | Lawrence Edwards | 322 | 0.6 | +0.6 | |
Independent | Ted Nielsen | 161 | 0.3 | +0.3 | |
Independent | Heather Benjamin | 117 | 0.2 | +0.2 | |
Independent | George Lee | 55 | 0.1 | +0.1 |
Party | Candidate | Votes | % | ±% | |
---|---|---|---|---|---|
Quota | 6,460 | ||||
Liberal | Roger Groom (elected 1) | 9,681 | 18.7 | +8.1 | |
Liberal | Ron Cornish (elected 2) | 5,684 | 11.0 | +0.8 | |
Liberal | Tony Rundle (elected 3) | 5,563 | 10.8 | +7.1 | |
Liberal | Bill Bonde (elected 7) | 3,868 | 7.5 | +7.5 | |
Liberal | Vince Smith | 3,030 | 5.9 | -0.6 | |
Liberal | Gerald O'Dea | 2,126 | 4.1 | +4.1 | |
Liberal | Carol Thomson | 1,123 | 2.2 | +2.2 | |
Labor | Greg Peart (elected 4) | 4,808 | 9.3 | +9.3 | |
Labor | Michael Field (elected 5) | 4,488 | 8.7 | -0.7 | |
Labor | Michael Weldon (elected 6) | 3,945 | 7.6 | +1.4 | |
Labor | John Coughlan | 2,170 | 4.2 | -6.2 | |
Labor | Glen Davies | 1,333 | 2.6 | -4.8 | |
Labor | Robin Lohrey | 499 | 1.0 | +1.0 | |
Labor | Marjorie Luck | 354 | 0.7 | +0.7 | |
Democrats | Greg Sergeant | 1,132 | 2.2 | +2.2 | |
Democrats | Kent Taylor | 877 | 1.7 | +1.7 | |
Independent | Les Woods | 992 | 1.9 | +1.9 | |
Total formal votes | 51,673 | 94.8 | -0.2 | ||
Informal votes | 2,836 | 5.2 | +0.2 | ||
Turnout | 54,509 | 94.8 | +2.1 | ||
Party total votes | |||||
Liberal | 31,075 | 60.1 | +10.3 | ||
Labor | 17,597 | 34.1 | -7.2 | ||
Democrats | 2,009 | 3.9 | -0.1 | ||
Independent | Les Woods | 992 | 1.9 | +1.9 |
Party | Candidate | Votes | % | ±% | |
---|---|---|---|---|---|
Quota | 6,074 | ||||
Liberal | Ray Bonney (elected 1) | 7,069 | 14.5 | -1.9 | |
Liberal | Roger Groom (elected 2) | 5,174 | 10.6 | +2.5 | |
Liberal | Ron Cornish (elected 3) | 4,933 | 10.2 | +2.7 | |
Liberal | Vince Smith (elected 5) | 3,138 | 6.5 | +6.5 | |
Liberal | Tony Rundle | 1,808 | 3.7 | +3.7 | |
Liberal | Malcolm Fenton | 1,204 | 2.5 | +2.5 | |
Liberal | Barbara Lamberton | 849 | 1.7 | +1.7 | |
Labor | John Coughlan (elected 4) | 5,050 | 10.4 | -6.4 | |
Labor | Michael Field (elected 6) | 4,569 | 9.4 | -2.5 | |
Labor | Glen Davies (elected 7) | 3,577 | 7.4 | -2.5 | |
Labor | Michael Weldon | 3,011 | 6.2 | +0.9 | |
Labor | Steve Daley | 1,646 | 3.4 | +3.4 | |
Labor | Bruce Duhig | 1,179 | 2.4 | +2.4 | |
Labor | Peter Blizzard | 1,037 | 2.1 | +2.1 | |
Democrats | Margaret Duthoit | 739 | 1.5 | +1.5 | |
Democrats | Allan McDonald | 679 | 1.4 | +1.4 | |
Democrats | Gavin Bugg | 521 | 1.1 | +1.1 | |
Group D | Kerry Berwick | 914 | 1.9 | +1.9 | |
Group D | Ronald Machen | 647 | 1.3 | +1.3 | |
Group C | James Hay | 193 | 0.4 | +0.4 | |
Group C | Graham Gee | 146 | 0.3 | +0.3 | |
Independent | Terrence Reid | 315 | 0.6 | +0.6 | |
Independent | Michael Boylan | 136 | 0.3 | +0.3 | |
Independent | Ivan Walsh | 56 | 0.1 | +0.1 | |
Total formal votes | 48,590 | 95.0 | -1.2 | ||
Informal votes | 2,579 | 5.0 | +1.2 | ||
Turnout | 51,169 | 92.7 | -0.4 | ||
Party total votes | |||||
Liberal | 24,175 | 49.8 | +7.1 | ||
Labor | 20,069 | 41.3 | -12.9 | ||
Democrats | 1,939 | 4.0 | +2.0 | ||
Group D | 1,561 | 3.2 | +3.2 | ||
Group C | 339 | 0.7 | +0.7 | ||
Independent | Terrence Reid | 315 | 0.6 | +0.6 | |
Independent | Michael Boylan | 136 | 0.3 | +0.3 | |
Independent | Ivan Walsh | 56 | 0.1 | +0.1 |
Party | Candidate | Votes | % | ±% | |
---|---|---|---|---|---|
Quota | 5,755 | ||||
Labor | John Coughlan (elected 1) | 7,731 | 16.8 | +6.7 | |
Labor | Michael Field (elected 3) | 5,481 | 11.9 | +4.8 | |
Labor | Glen Davies (elected 5) | 4,547 | 9.9 | -6.0 | |
Labor | Michael Weldon (elected 6) | 2,423 | 5.3 | +5.3 | |
Labor | Maurice Dart | 2,022 | 4.4 | +1.5 | |
Labor | Geoff Chisholm | 1,903 | 4.1 | -4.2 | |
Labor | Wendy Faulkes | 849 | 1.8 | +1.8 | |
Liberal | Ray Bonney (elected 2) | 7,548 | 16.4 | +3.5 | |
Liberal | Roger Groom (elected 4) | 3,752 | 8.1 | +1.4 | |
Liberal | Ron Cornish (elected 7) | 3,464 | 7.5 | -0.5 | |
Liberal | Tony Fletcher | 2,837 | 6.2 | +6.2 | |
Liberal | Terry Stuart | 787 | 1.7 | +1.7 | |
Liberal | Bill French | 699 | 1.5 | +1.5 | |
Liberal | Anne Gribbin | 584 | 1.3 | +1.3 | |
Democrats | Lynton Viant | 783 | 1.7 | +1.7 | |
Democrats | Des Kynaston | 134 | 0.3 | +0.3 | |
Independent | Ted Vickers | 465 | 1.0 | +1.0 | |
Independent | Philip Treagus | 30 | 0.1 | +0.1 | |
Total formal votes | 46,039 | 96.2 | -0.4 | ||
Informal votes | 1,806 | 3.8 | +0.4 | ||
Turnout | 47,845 | 93.1 | -1.2 | ||
Party total votes | |||||
Labor | 24,956 | 54.2 | +0.3 | ||
Liberal | 19,671 | 42.7 | -3.2 | ||
Democrats | 917 | 2.0 | +2.0 | ||
Independent | Ted Vickers | 465 | 1.0 | +1.0 | |
Independent | Philip Treagus | 30 | 0.1 | +0.1 |
Party | Candidate | Votes | % | ±% | |
---|---|---|---|---|---|
Quota | 6,247 | ||||
Labor | Glen Davies (elected 1) | 7,953 | 15.9 | +9.3 | |
Labor | John Coughlan (elected 3) | 5,057 | 10.1 | +7.8 | |
Labor | Geoff Chisholm (elected 4) | 4,090 | 8.2 | +3.3 | |
Labor | Michael Field (elected 5) | 3,565 | 7.1 | +7.1 | |
Labor | Ted Vickers | 2,837 | 5.7 | +5.7 | |
Labor | Maurice Dart | 1,443 | 2.9 | +2.9 | |
Labor | Graeme Smith | 1,053 | 2.1 | +2.1 | |
Labor | Christopher Wright | 924 | 1.8 | +1.8 | |
Liberal | Ray Bonney (elected 2) | 6,438 | 12.9 | +1.7 | |
Liberal | Ron Cornish (elected 6) | 4,000 | 8.0 | +8.0 | |
Liberal | Roger Groom (elected 7) | 3,334 | 6.7 | +6.7 | |
Liberal | Eric Bessell | 2,777 | 5.6 | +5.6 | |
Liberal | Kent Furmage | 2,138 | 4.3 | +4.3 | |
Liberal | Frank Atkins | 1,831 | 3.7 | +3.7 | |
Liberal | Harold Hawkes | 1,439 | 2.9 | +2.9 | |
Liberal | Harold Dowling | 963 | 1.9 | +1.9 | |
Independent | Philip Kelly | 128 | 0.3 | +0.3 | |
Total formal votes | 49,970 | 96.6 | -0.2 | ||
Informal votes | 1,766 | 3.4 | +0.2 | ||
Turnout | 51,736 | 94.3 | -0.2 | ||
Party total votes | |||||
Labor | 26,922 | 53.9 | -9.0 | ||
Liberal | 22,920 | 45.9 | +12.1 | ||
Independent | Philip Kelly | 128 | 0.3 | +0.3 |
Party | Candidate | Votes | % | ±% | |
---|---|---|---|---|---|
Quota | 5,223 | ||||
Labor | Eric Reece (elected 1) | 14,790 | 35.4 | +1.2 | |
Labor | Lloyd Costello (elected 3) | 2,814 | 6.7 | +1.4 | |
Labor | Glen Davies (elected 2) | 2,767 | 6.6 | +6.6 | |
Labor | Geoff Chisholm (elected 5) | 2,042 | 4.9 | +1.2 | |
Labor | Sydney Ward (elected 6) | 1,548 | 3.7 | +0.1 | |
Labor | Joseph Britton | 1,138 | 2.7 | -0.8 | |
Labor | John Coughlan | 969 | 2.3 | +2.3 | |
Labor | Josephus Hen | 225 | 0.5 | +0.5 | |
Liberal | Ray Bonney (elected 4) | 4,662 | 11.2 | +11.2 | |
Liberal | Wilfred Barker (elected 7) | 2,839 | 6.8 | -3.6 | |
Liberal | Brian Archer | 2,460 | 5.9 | +5.9 | |
Liberal | Jack Breheny | 2,086 | 5.0 | -1.5 | |
Liberal | John Davis | 1,231 | 2.9 | +0.4 | |
Liberal | Thomas Gardner | 762 | 1.8 | +1.8 | |
Liberal | Leslie Woods | 100 | 0.2 | +0.2 | |
United Tasmania | Noreen Batchelor | 893 | 2.1 | +2.1 | |
United Tasmania | Anthony Weston | 224 | 0.5 | +0.5 | |
Independent | Alexander Best | 132 | 0.3 | +0.3 | |
Independent | John Chapman-Mortimer | 96 | 0.2 | +0.2 | |
Total formal votes | 41,778 | 96.8 | +1.0 | ||
Informal votes | 1,381 | 3.2 | -1.0 | ||
Turnout | 43,159 | 94.5 | -0.2 | ||
Party total votes | |||||
Labor | 26,293 | 62.9 | +9.2 | ||
Liberal | 14,140 | 33.8 | -0.6 | ||
United Tasmania | 1,117 | 2.7 | +2.7 | ||
Independent | Alexander Best | 132 | 0.3 | +0.3 | |
Independent | John Chapman-Mortimer | 96 | 0.2 | +0.2 |
Party | Candidate | Votes | % | ±% | |
---|---|---|---|---|---|
Quota | 4,921 | ||||
Labor | Eric Reece (elected 1) | 13,452 | 34.2 | -0.5 | |
Labor | Lloyd Costello (elected 3) | 2,104 | 5.3 | -0.9 | |
Labor | Geoff Chisholm (elected 5) | 1,476 | 3.7 | -0.6 | |
Labor | Sydney Ward (elected 4) | 1,399 | 3.6 | -1.0 | |
Labor | Joseph Britton | 1,386 | 3.5 | +1.6 | |
Labor | Donald Crowe | 600 | 1.5 | +1.5 | |
Labor | Jack Crawford | 432 | 1.1 | +1.1 | |
Labor | Gordon O'Shannessey | 304 | 0.8 | -0.6 | |
Liberal | Wilfred Barker (elected 2) | 4,087 | 10.4 | +4.5 | |
Liberal | William Young | 2,619 | 6.7 | +0.7 | |
Liberal | Jack Breheny (elected 7) | 2,555 | 6.5 | -0.7 | |
Liberal | Alan Moore | 1,691 | 4.3 | +4.3 | |
Liberal | John Davis | 999 | 2.5 | +2.5 | |
Liberal | Ray Grey | 960 | 2.4 | +1.0 | |
Liberal | Bruce Walker | 633 | 1.6 | +1.6 | |
Centre | Kevin Lyons (elected 6) | 3,546 | 9.0 | +9.0 | |
Centre | Lawrence Ling | 252 | 0.6 | +0.6 | |
Centre | Laurie Heathorn | 242 | 0.6 | +0.6 | |
Centre | Lloyd Hodgkinson | 75 | 0.2 | +0.2 | |
Democratic Labor | John Chapman-Mortimer | 443 | 1.1 | +0.8 | |
Democratic Labor | Dudley McNamara | 106 | 0.3 | +0.3 | |
Total formal votes | 39,361 | 95.8 | -0.8 | ||
Informal votes | 1,730 | 4.2 | +0.8 | ||
Turnout | 41,091 | 94.7 | -0.9 | ||
Party total votes | |||||
Labor | 21,153 | 53.7 | -2.9 | ||
Liberal | 13,544 | 34.4 | +1.5 | ||
Centre | 4,115 | 10.5 | +10.5 | ||
Democratic Labor | 549 | 1.4 | -0.9 |
Party | Candidate | Votes | % | ±% | |
---|---|---|---|---|---|
Quota | 4,428 | ||||
Labor | Eric Reece (elected 1) | 12,291 | 34.7 | +4.3 | |
Labor | Lloyd Costello (elected 3) | 2,184 | 6.2 | +0.7 | |
Labor | Sydney Ward (elected 2) | 1,807 | 5.1 | -2.8 | |
Labor | Geoff Chisholm (elected 4) | 1,528 | 4.3 | +4.3 | |
Labor | Douglas Blacklow | 761 | 2.1 | +2.1 | |
Labor | Joseph Britton | 674 | 1.9 | -1.4 | |
Labor | Gordon O'Shannessey | 483 | 1.4 | +1.4 | |
Labor | Richard Sleath | 304 | 0.9 | +0.9 | |
Liberal | Kevin Lyons (elected 5) | 2,958 | 8.4 | -1.3 | |
Liberal | Jack Breheny (elected 7) | 2,565 | 7.2 | -2.4 | |
Liberal | William Young | 2,117 | 6.0 | -0.7 | |
Liberal | Wilfred Barker (elected 6) | 2,087 | 5.9 | +5.9 | |
Liberal | John Leary | 609 | 1.7 | +1.7 | |
Liberal | Ray Grey | 504 | 1.4 | +1.4 | |
Liberal | Ernest Johnson | 372 | 1.1 | +1.1 | |
Liberal | Loch Roberts | 332 | 0.9 | +0.9 | |
Liberal | Charles MacKenzie | 124 | 0.4 | +0.4 | |
Country | Roger Chalk | 769 | 2.2 | +2.2 | |
Country | Anthony Hine | 570 | 1.6 | +1.6 | |
Country | Eric Webster | 472 | 1.3 | +1.3 | |
Country | Elliott Hooper | 399 | 1.1 | +1.1 | |
Country | Thomas Barnard | 370 | 1.0 | +1.0 | |
Country | Gilbert Allen | 341 | 1.0 | +1.0 | |
Democratic Labor | Ronald Cole | 660 | 1.9 | +1.9 | |
Democratic Labor | John Mortimer | 99 | 0.3 | +0.3 | |
Democratic Labor | Abraham Neut | 38 | 0.1 | +0.1 | |
Total formal votes | 35,418 | 96.6 | +1.5 | ||
Informal votes | 1,248 | 3.4 | -1.5 | ||
Turnout | 36,666 | 95.6 | +1.4 | ||
Party total votes | |||||
Labor | 20,032 | 56.6 | +4.4 | ||
Liberal | 11,668 | 32.9 | -9.5 | ||
Country | 2,921 | 8.2 | +8.2 | ||
Democratic Labor | 797 | 2.3 | -2.7 |
Party | Candidate | Votes | % | ±% | |
---|---|---|---|---|---|
Quota | 3,983 | ||||
Labor | Eric Reece (elected 1) | 9,688 | 30.4 | +11.4 | |
Labor | Sydney Ward (elected 2) | 2,511 | 7.9 | -4.2 | |
Labor | Lloyd Costello (elected 4) | 1,756 | 5.5 | +5.5 | |
Labor | Joseph Britton (elected 5) | 1,067 | 3.3 | +3.3 | |
Labor | Aubrey Gaffney | 582 | 1.8 | +1.8 | |
Labor | Patrick Streets | 541 | 1.7 | +1.7 | |
Labor | Harold Singleton | 472 | 1.5 | +1.5 | |
Liberal | Kevin Lyons (elected 7) | 3,084 | 9.7 | +0.6 | |
Liberal | Jack Breheny (elected 6) | 3,071 | 9.6 | +2.0 | |
Liberal | Carrol Bramich (elected 3) | 2,588 | 8.1 | -9.2 | |
Liberal | William Young | 2,134 | 6.7 | +6.7 | |
Liberal | Horace Lane | 1,125 | 3.5 | +3.5 | |
Liberal | Arthur Abel | 932 | 2.9 | +2.9 | |
Liberal | Charles Rand | 579 | 1.8 | +1.8 | |
Democratic Labor | Frances Lane | 750 | 2.4 | +2.4 | |
Democratic Labor | Bruce Cameron | 742 | 2.3 | +2.3 | |
Democratic Labor | Alban Galpin | 102 | 0.3 | -0.1 | |
Independent | Eric Nicholls | 133 | 0.4 | +0.4 | |
Total formal votes | 31,857 | 95.1 | -1.5 | ||
Informal votes | 1,654 | 4.9 | +1.5 | ||
Turnout | 33,511 | 94.2 | -1.1 | ||
Party total votes | |||||
Labor | 16,617 | 52.2 | +3.7 | ||
Liberal | 13,513 | 42.4 | -4.5 | ||
Democratic Labor | 1,594 | 5.0 | +0.8 | ||
Independent | Eric Nicholls | 133 | 0.4 | +0.4 |
Party | Candidate | Votes | % | ±% | |
---|---|---|---|---|---|
Quota | 4,510 | ||||
Labor | Eric Reece (elected 1) | 5,983 | 19.0 | -2.0 | |
Labor | Sydney Ward (elected 3) | 3,805 | 12.1 | +5.7 | |
Labor | Charley Aylett (elected 4) | 2,673 | 8.5 | -1.5 | |
Labor | Frank Taylor | 1,641 | 5.2 | +5.2 | |
Labor | Cyril Cameron | 613 | 1.9 | +1.9 | |
Labor | John Keating | 587 | 1.9 | +1.9 | |
Liberal | Carrol Bramich (elected 2) | 5,467 | 17.3 | +17.3 | |
Liberal | Kevin Lyons (elected 5) | 2,882 | 9.1 | -1.4 | |
Liberal | John Fidler | 2,461 | 7.8 | -3.4 | |
Liberal | Jack Breheny (elected 6) | 2,409 | 7.6 | -5.5 | |
Liberal | Edward Gaby | 919 | 2.9 | -1.7 | |
Liberal | Trevor Frampton | 676 | 2.1 | -2.2 | |
Labor (A-C) | Terence Doody | 638 | 2.0 | +2.0 | |
Labor (A-C) | Timothy Healy | 538 | 1.7 | +1.7 | |
Labor (A-C) | Albin Galpin | 134 | 0.4 | +0.4 | |
Independent | Roger Miller | 139 | 0.4 | +0.4 | |
Total formal votes | 31,565 | 96.6 | -0.2 | ||
Informal votes | 1,115 | 3.4 | +0.2 | ||
Turnout | 32,680 | 95.3 | -1.5 | ||
Party total votes | |||||
Labor | 15,302 | 48.5 | -4.8 | ||
Liberal | 14,814 | 46.9 | +0.2 | ||
Labor (A-C) | 1,310 | 4.2 | +4.2 | ||
Independent | Roger Miller | 139 | 0.4 | +0.4 |
Party | Candidate | Votes | % | ±% | |
---|---|---|---|---|---|
Quota | 4,412 | ||||
Labor | Eric Reece (elected 1) | 6,484 | 21.0 | +2.9 | |
Labor | Charley Aylett (elected 3) | 3,072 | 9.9 | -3.2 | |
Labor | Carrol Bramich (elected 6) | 2,372 | 7.7 | +0.5 | |
Labor | Sydney Ward | 1,979 | 6.4 | +6.4 | |
Labor | Raymond Durkin | 1,808 | 5.9 | +5.9 | |
Labor | Sydney Richardson | 755 | 2.4 | +2.4 | |
Liberal | Jack Breheny (elected 2) | 4,024 | 13.0 | +4.2 | |
Liberal | John Fidler (elected 3) | 3,467 | 11.2 | +2.0 | |
Liberal | Kevin Lyons (elected 4) | 3,237 | 10.5 | +1.5 | |
Liberal | Edward Gaby | 1,432 | 4.6 | +4.6 | |
Liberal | Trevor Frampton | 1,340 | 4.3 | +4.3 | |
Liberal | Horace Lane | 912 | 3.0 | +3.0 | |
Total formal votes | 30,882 | 96.8 | +0.6 | ||
Informal votes | 1,028 | 3.2 | -0.6 | ||
Turnout | 31,910 | 93.7 | -1.0 | ||
Party total votes | |||||
Labor | 16,470 | 53.3 | +6.5 | ||
Liberal | 14,412 | 46.7 | -5.7 |
Party | Candidate | Votes | % | ±% | |
---|---|---|---|---|---|
Quota | 4,011 | ||||
Liberal | Jack Chamberlain (elected 2) | 4,139 | 14.7 | +2.1 | |
Liberal | John Fidler (elected 5) | 2,580 | 9.2 | +1.2 | |
Liberal | Kevin Lyons (elected 6) | 2,526 | 9.0 | +3.6 | |
Liberal | Jack Breheny | 2,461 | 8.8 | +8.8 | |
Liberal | Raymond Powys | 1,352 | 4.8 | +4.8 | |
Liberal | Hector McFie | 1,132 | 4.0 | +4.0 | |
Liberal | Mervyn Langham | 512 | 1.8 | +1.8 | |
Labor | Eric Reece (elected 1) | 5,076 | 18.1 | +0.1 | |
Labor | Charley Aylett (elected 3) | 4,018 | 14.3 | +0.6 | |
Labor | Carrol Bramich (elected 4) | 2,017 | 7.2 | +1.1 | |
Labor | Edward Beachcroft | 1,100 | 3.9 | +3.9 | |
Labor | Gordon O'Shannessey | 704 | 2.5 | +2.5 | |
Labor | Patrick Streets | 554 | 2.0 | +2.0 | |
Independent | Thomas Cornelius | 240 | 0.9 | +0.9 | |
Total formal votes | 28,070 | 96.2 | +0.7 | ||
Informal votes | 1,115 | 3.8 | -0.7 | ||
Turnout | 29,185 | 94.7 | +0.1 | ||
Party total votes | |||||
Liberal | 14,702 | 52.4 | +6.7 | ||
Labor | 13,128 | 46.8 | -0.9 | ||
Independent | Thomas Cornelius | 240 | 0.9 | +0.9 |
Party | Candidate | Votes | % | ±% | |
---|---|---|---|---|---|
Quota | 4,182 | ||||
Labor | Eric Reece (elected 1) | 5,255 | 18.0 | +2.9 | |
Labor | Charley Aylett (elected 2) | 4,018 | 13.7 | +1.4 | |
Labor | Carrol Bramich (elected 5) | 1,784 | 6.1 | +1.9 | |
Labor | Aubrey Bartram | 1,488 | 5.1 | +5.1 | |
Labor | Michael Smith | 777 | 2.7 | -1.6 | |
Labor | Harold Purton | 646 | 2.2 | +2.2 | |
Liberal | Jack Chamberlain (elected 3) | 3,684 | 12.6 | -0.2 | |
Liberal | John Fidler (elected 4) | 2,350 | 8.0 | -3.0 | |
Liberal | Gerald Acheson | 2,044 | 7.0 | +0.9 | |
Liberal | Kevin Lyons (elected 6) | 1,567 | 5.4 | +5.4 | |
Liberal | Percy Williams | 1,361 | 4.6 | +0.8 | |
Liberal | James Hilder | 939 | 3.2 | +3.2 | |
Liberal | Vivian Byard | 927 | 3.2 | +3.2 | |
Liberal | Wilfred French | 505 | 1.7 | +1.7 | |
Independent | Henry McFie | 1,498 | 5.1 | +5.1 | |
Independent | Leslie Margetts | 274 | 0.9 | +0.9 | |
Independent | Ellis Batten | 155 | 0.5 | +0.5 | |
Total formal votes | 29,272 | 95.5 | +3.5 | ||
Informal votes | 1,382 | 4.5 | -3.5 | ||
Turnout | 30,654 | 94.6 | +4.5 | ||
Party total votes | |||||
Labor | 13,968 | 47.7 | -1.8 | ||
Liberal | 13,377 | 45.7 | -2.0 | ||
Independent | 1,927 | 6.6 | +6.6 |
Party | Candidate | Votes | % | ±% | |
---|---|---|---|---|---|
Quota | 3,905 | ||||
Labor | Eric Reece (elected 1) | 4,116 | 15.1 | +15.1 | |
Labor | Charley Aylett (elected 3) | 3,368 | 12.3 | +12.3 | |
Labor | Michael Smith | 1,164 | 4.3 | +2.2 | |
Labor | Carrol Bramich (elected 6) | 1,152 | 4.2 | +4.2 | |
Labor | Bert Lacey | 1,127 | 4.1 | +4.1 | |
Labor | James Bugg | 1,070 | 3.9 | -2.9 | |
Labor | Philip Kelly | 421 | 1.5 | -3.7 | |
Liberal | Jack Chamberlain (elected 2) | 3,510 | 12.8 | -0.1 | |
Liberal | John Fidler (elected 4) | 3,011 | 11.0 | +11.0 | |
Liberal | Henry McFie (elected 5) | 2,591 | 9.5 | +3.1 | |
Liberal | Gerald Acheson | 1,664 | 6.1 | +1.3 | |
Liberal | Bernard Roberts | 1,207 | 4.4 | +4.4 | |
Liberal | Percy Williams | 1,042 | 3.8 | +3.8 | |
Independent | Leslie Margetts | 786 | 2.9 | +2.9 | |
Total formal votes | 27,333 | 92.0 | -3.3 | ||
Informal votes | 2,365 | 8.0 | +3.3 | ||
Turnout | 29,698 | 90.1 | -0.4 | ||
Party total votes | |||||
Labor | 13,522 | 49.5 | -9.0 | ||
Liberal | 13,025 | 47.7 | +6.2 | ||
Independent | Leslie Margetts | 786 | 2.9 | +2.9 |
Party | Candidate | Votes | % | ±% | |
---|---|---|---|---|---|
Quota | 3,616 | ||||
Labor | Thomas d'Alton (elected 1) | 10,380 | 41.0 | +10.3 | |
Labor | James Bugg (elected 3) | 1,728 | 6.8 | +6.8 | |
Labor | Philip Kelly (elected 2) | 1,320 | 5.2 | -3.3 | |
Labor | Henry Lane (elected 5) | 862 | 3.4 | 0.0 | |
Labor | Michael Smith | 525 | 2.1 | +2.1 | |
Nationalist | Jack Chamberlain (elected 4) | 3,267 | 12.9 | +4.8 | |
Nationalist | Henry McFie (elected 6) | 1,622 | 6.4 | +0.4 | |
Nationalist | John Wright | 1,561 | 6.2 | -1.2 | |
Nationalist | Gerald Acheson | 1,207 | 4.8 | +4.8 | |
Nationalist | Norman Booth | 1,107 | 4.4 | +4.4 | |
Nationalist | Russell Green | 1,062 | 4.2 | +4.2 | |
Nationalist | Stephen Broad | 669 | 2.6 | -0.6 | |
Total formal votes | 25,310 | 95.3 | -2.1 | ||
Informal votes | 1,250 | 4.7 | +2.1 | ||
Turnout | 26,560 | 90.5 | -3.3 | ||
Party total votes | |||||
Labor | 14,815 | 58.5 | +1.1 | ||
Nationalist | 10,495 | 41.5 | -0.5 |
Party | Candidate | Votes | % | ±% | |
---|---|---|---|---|---|
Quota | 3,527 | ||||
Labor | Thomas d'Alton (elected 1) | 7,576 | 30.7 | +15.7 | |
Labor | Philip Kelly (elected 2) | 2,086 | 8.5 | -2.6 | |
Labor | Joseph McGrath (elected 3) | 1,659 | 6.7 | +0.9 | |
Labor | Bill Aylett | 1,317 | 5.3 | +5.3 | |
Labor | Henry Lane | 830 | 3.4 | -0.6 | |
Labor | Garnet Cooper | 711 | 2.9 | +2.9 | |
Nationalist | Frank Edwards (elected 5) | 2,030 | 8.2 | +1.3 | |
Nationalist | Jack Chamberlain (elected 4) | 1,994 | 8.1 | +1.5 | |
Nationalist | Frank Marriott (elected 6) | 1,929 | 7.8 | -0.1 | |
Nationalist | John Wright | 1,827 | 7.4 | +1.1 | |
Nationalist | Henry McFie | 1,482 | 6.0 | +0.7 | |
Nationalist | Stephen Broad | 798 | 3.2 | +3.2 | |
Nationalist | Hubert Nichols | 317 | 1.3 | +1.3 | |
Independent | James Campbell | 128 | 0.5 | +0.5 | |
Total formal votes | 24,684 | 97.1 | +0.1 | ||
Informal votes | 725 | 2.9 | -0.1 | ||
Turnout | 25,409 | 94.1 | +0.1 | ||
Party total votes | |||||
Labor | 14,179 | 57.4 | +16.6 | ||
Nationalist | 10,377 | 42.0 | -10.8 | ||
Independent | James Campbell | 128 | 0.5 | +0.5 |
Party | Candidate | Votes | % | ±% | |
---|---|---|---|---|---|
Quota | 3,403 | ||||
Nationalist | Frank Marriott (elected 3) | 1,878 | 7.9 | -4.4 | |
Nationalist | Frank Edwards (elected 5) | 1,648 | 6.9 | +6.9 | |
Nationalist | Jack Chamberlain (elected 4) | 1,564 | 6.6 | +6.6 | |
Nationalist | John Wright | 1,491 | 6.3 | +1.1 | |
Nationalist | Henry McFie | 1,259 | 5.3 | -3.3 | |
Nationalist | Thomas Butler | 1,008 | 4.2 | -21.5 | |
Nationalist | John Astell | 865 | 3.6 | +3.6 | |
Nationalist | Robert Hamilton | 851 | 3.6 | +3.6 | |
Nationalist | Ernest Fenton | 769 | 3.2 | +3.2 | |
Nationalist | Cyril Horne | 767 | 3.2 | +3.2 | |
Nationalist | Edward Hobbs | 478 | 2.0 | -5.3 | |
Labor | Thomas d'Alton (elected 1) | 3,561 | 15.0 | +3.3 | |
Labor | Philip Kelly (elected 2) | 2,649 | 11.1 | +1.5 | |
Labor | Joseph McGrath (elected 6) | 1,382 | 5.8 | +4.1 | |
Labor | James Belton | 1,181 | 5.0 | -1.7 | |
Labor | Henry Lane | 956 | 4.0 | +4.0 | |
Independent | Stephen Broad | 1,512 | 6.3 | +6.3 | |
Total formal votes | 23,819 | 97.0 | +0.3 | ||
Informal votes | 725 | 3.0 | -0.3 | ||
Turnout | 24,544 | 94.0 | -1.2 | ||
Party total votes | |||||
Nationalist | 12,578 | 52.8 | -7.2 | ||
Labor | 9,729 | 40.8 | +9.4 | ||
Independent | Stephen Broad | 1,512 | 6.3 | +6.3 |
Party | Candidate | Votes | % | ±% | |
---|---|---|---|---|---|
Quota | 3,248 | ||||
Nationalist | Thomas Butler (elected 1) | 5,846 | 25.7 | +25.7 | |
Nationalist | Frank Marriott (elected 2) | 2,788 | 12.3 | -5.1 | |
Nationalist | Henry McFie (elected 6) | 1,953 | 8.6 | -0.5 | |
Nationalist | Edward Hobbs (elected 5) | 1,659 | 7.3 | -3.6 | |
Nationalist | John Wright | 1,180 | 5.2 | +5.2 | |
Nationalist | Colin Paul | 225 | 1.0 | +1.0 | |
Labor | Thomas d'Alton (elected 3) | 2,660 | 11.7 | +11.7 | |
Labor | Philip Kelly (elected 4) | 2,186 | 9.6 | -5.4 | |
Labor | James Belton | 1,523 | 6.7 | -6.5 | |
Labor | Joseph McGrath | 392 | 1.7 | +1.7 | |
Labor | James Gray | 378 | 1.7 | +1.7 | |
Independent | Fergus Medwin | 1,667 | 7.3 | +7.3 | |
Independent | Daniel Brown | 274 | 1.2 | +1.2 | |
Total formal votes | 22,731 | 96.7 | -0.1 | ||
Informal votes | 768 | 3.3 | +0.1 | ||
Turnout | 23,499 | 95.2 | +11.0 | ||
Party total votes | |||||
Nationalist | 13,651 | 60.0 | +14.3 | ||
Labor | 7,139 | 31.4 | -15.3 | ||
Independent | Fergus Medwin | 1,667 | 7.3 | +7.3 | |
Independent | Daniel Brown | 274 | 1.2 | +1.2 |
Party | Candidate | Votes | % | ±% | |
---|---|---|---|---|---|
Quota | 2,678 | ||||
Labor | Philip Kelly (elected 2) | 2,805 | 15.0 | -16.3 | |
Labor | James Belton (elected 3) | 2,477 | 13.2 | -4.4 | |
Labor | Fergus Medwin (elected 6) | 1,171 | 6.2 | +6.2 | |
Labor | Henry Lane | 954 | 5.1 | +0.2 | |
Labor | Robert Steel | 677 | 3.6 | +3.6 | |
Labor | John O'Donnell | 674 | 3.6 | +3.6 | |
Nationalist | Frank Marriott (elected 1) | 3,266 | 17.4 | +5.7 | |
Nationalist | Edward Hobbs (elected 4) | 2,041 | 10.9 | +2.3 | |
Nationalist | Henry McFie (elected 5) | 1,703 | 9.1 | -0.5 | |
Nationalist | Richard Parsons | 785 | 4.2 | +4.2 | |
Nationalist | Duncan McInnes | 779 | 4.2 | +4.2 | |
Independent | Joshua Whitsitt | 1,413 | 7.5 | +7.5 | |
Total formal votes | 18,745 | 96.8 | -0.7 | ||
Informal votes | 628 | 3.2 | +0.7 | ||
Turnout | 19,373 | 84.2 | +13.7 | ||
Party total votes | |||||
Labor | 8,758 | 46.7 | +4.8 | ||
Nationalist | 8,574 | 45.7 | +10.1 | ||
Independent | Joshua Whitsitt | 1,413 | 7.5 | +7.5 |
Party | Candidate | Votes | % | ±% | |
---|---|---|---|---|---|
Quota | 2,261 | ||||
Labor | James Belton (elected 1) | 2,790 | 17.6 | +6.9 | |
Labor | Philip Kelly (elected 2) | 2,585 | 16.3 | +9.4 | |
Labor | James Hurst (elected 4) | 1,354 | 8.6 | +1.3 | |
Labor | Henry Lane | 780 | 4.9 | +4.9 | |
Labor | Eliza Burnell | 348 | 2.2 | +2.2 | |
Labor | William Treanor | 291 | 1.8 | +1.8 | |
Nationalist | Frank Marriott (elected 3) | 1,856 | 11.7 | +2.7 | |
Nationalist | Henry McFie (elected 6) | 1,367 | 8.6 | +8.6 | |
Nationalist | Hubert Nichols | 1,059 | 6.7 | +6.7 | |
Nationalist | Herbert Vertigan | 565 | 3.6 | +3.6 | |
Nationalist | Harold Ireland | 396 | 2.5 | +2.5 | |
Nationalist | David Jones | 383 | 2.4 | +2.4 | |
Liberal | Edward Hobbs (elected 5) | 1,366 | 8.6 | 0.0 | |
Liberal | James Charleston | 684 | 4.3 | +4.3 | |
Total formal votes | 15,824 | 97.5 | +0.1 | ||
Informal votes | 408 | 2.5 | -0.1 | ||
Turnout | 16,232 | 70.5 | +7.5 | ||
Party total votes | |||||
Labor | 8,148 | 51.5 | +8.0 | ||
Nationalist | 5,626 | 35.6 | +7.0 | ||
Liberal | 2,050 | 13.0 | +13.0 |
Party | Candidate | Votes | % | ±% | |
---|---|---|---|---|---|
Quota | 1,535 | ||||
Labor | James Ogden (elected 1) | 2,004 | 18.7 | +3.7 | |
Labor | James Belton (elected 2) | 1,149 | 10.7 | -1.4 | |
Labor | James Hurst (elected 6) | 787 | 7.3 | -3.2 | |
Labor | Philip Kelly | 736 | 6.9 | +6.9 | |
Country | Edward Hobbs (elected 5) | 919 | 8.6 | +8.6 | |
Country | Richard Franks (elected 3) | 882 | 8.2 | +8.2 | |
Country | Charles Dunning | 682 | 6.3 | +6.3 | |
Country | John Wright | 592 | 5.5 | +5.5 | |
Nationalist | Frank Marriott (elected 4) | 967 | 9.0 | +9.0 | |
Nationalist | Percy Pollard | 950 | 8.8 | -2.9 | |
Independent | Joshua Whitsitt | 962 | 9.0 | -6.3 | |
Independent | Llewellyn Storey | 109 | 1.0 | +1.0 | |
Total formal votes | 10,739 | 97.4 | +2.2 | ||
Informal votes | 282 | 2.6 | -2.2 | ||
Turnout | 11,021 | 63.0 | -4.9 | ||
Party total votes | |||||
Labor | 4,676 | 43.5 | -4.0 | ||
Country | 3,075 | 28.6 | +28.6 | ||
Nationalist | 1,917 | 17.9 | -19.3 | ||
Independent | Joshua Whitsitt | 962 | 9.0 | -6.3 | |
Independent | Llewellyn Storey | 109 | 1.0 | +1.0 |
Party | Candidate | Votes | % | ±% | |
---|---|---|---|---|---|
Quota | 1,718 | ||||
Labor | James Ogden (elected 2) | 1,805 | 15.0 | -1.4 | |
Labor | James Belton (elected 4) | 1,450 | 12.1 | -7.2 | |
Labor | James Hurst (elected 5) | 1,268 | 10.5 | +10.5 | |
Labor | George Phillips | 531 | 4.4 | +4.4 | |
Labor | Leonard Bennett | 521 | 4.3 | -2.9 | |
Labor | Leonard Burrows | 130 | 1.1 | +1.1 | |
Nationalist | Edward Hobbs (elected 3) | 1,751 | 14.6 | +3.1 | |
Nationalist | Herbert Payne (elected 6) | 1,464 | 12.2 | +0.6 | |
Nationalist | Percy Pollard | 1,260 | 9.3 | +9.3 | |
Independent | Joshua Whitsitt (elected 1) | 1,841 | 15.3 | +4.7 | |
Total formal votes | 12,021 | 95.2 | +1.5 | ||
Informal votes | 604 | 4.8 | -1.5 | ||
Turnout | 12,625 | 67.9 | -6.0 | ||
Party total votes | |||||
Labor | 5,705 | 47.5 | -3.2 | ||
Nationalist | 4,475 | 37.2 | -1.5 | ||
Independent | Joshua Whitsitt | 1,841 | 15.3 | +4.7 |
Party | Candidate | Votes | % | ±% | |
---|---|---|---|---|---|
Quota | 1,928 | ||||
Labor | James Belton (elected 1) | 2,601 | 19.3 | +5.5 | |
Labor | James Ogden (elected 2) | 2,216 | 16.4 | +2.5 | |
Labor | Benjamin Watkins (elected 3) | 1,047 | 7.8 | -3.5 | |
Labor | Leonard Bennett | 978 | 7.2 | +7.2 | |
Liberal | Herbert Payne (elected 4) | 1,569 | 11.6 | -0.2 | |
Liberal | Edward Hobbs (elected 6) | 1,557 | 11.5 | +11.5 | |
Liberal | Stephen Margetts | 1,057 | 7.8 | +7.8 | |
Liberal | George Pullen | 1,039 | 7.7 | -2.9 | |
Independent | Joshua Whitsitt (elected 5) | 1,428 | 10.6 | +10.6 | |
Total formal votes | 13,492 | 94.1 | -2.8 | ||
Informal votes | 851 | 5.9 | +2.8 | ||
Turnout | 14,343 | 73.9 | +11.9 | ||
Party total votes | |||||
Labor | 6,842 | 50.7 | -0.4 | ||
Liberal | 5,222 | 38.7 | -10.2 | ||
Independent | Joshua Whitsitt | 1,428 | 10.6 | +10.6 |
Party | Candidate | Votes | % | ±% | |
---|---|---|---|---|---|
Quota | 1,803 | ||||
Labor | James Ogden (elected 4) | 1,751 | 13.9 | +0.6 | |
Labor | James Belton (elected 1) | 1,736 | 13.8 | −0.9 | |
Labor | Benjamin Watkins (elected 6) | 1,426 | 11.3 | +2.7 | |
Labor | James Hurst | 1,372 | 10.9 | +0.4 | |
Labor | David Jones | 156 | 1.2 | +0.4 | |
Liberal | Joshua Whitsitt (elected 3) | 1,528 | 12.1 | −3.2 | |
Liberal | Herbert Payne (elected 2) | 1,484 | 11.8 | −2.9 | |
Liberal | George Pullen (elected 5) | 1,341 | 10.6 | +1.6 | |
Liberal | Kenric Laughton | 1,079 | 8.6 | +11.5 | |
Liberal | William Lamerton | 742 | 5.9 | −2.3 | |
Total formal votes | 13,492 | 96.9 | −0.1 | ||
Informal votes | 400 | 3.1 | +0.1 | ||
Turnout | 13,892 | 62.6 | −6.2 | ||
Party total votes | |||||
Labor | 6,441 | 51.1 | +3.9 | ||
Liberal | 6,174 | 48.9 | −3.9 |
The House of Assembly, or Lower House, is one of the two chambers of the Parliament of Tasmania in Australia. The other is the Legislative Council or Upper House. It sits in Parliament House in the state capital, Hobart.
The Division of Braddon is an Australian electoral division in the state of Tasmania. The current MP is Gavin Pearce of the Liberal Party, who was elected at the 2019 federal election.
The electoral division of Braddon is one of the five electorates in the Tasmanian House of Assembly, it includes north-west and western Tasmania as well as King Island. Braddon takes its name from the former Premier of Tasmania, Sir Edward Braddon. The division shares its name and boundaries with the federal division of Braddon.
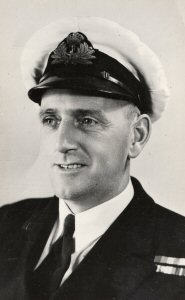
The 1956 Tasmanian state election was held on 13 October 1956 in the Australian state of Tasmania to elect 30 members of the Tasmanian House of Assembly. The election used the Hare-Clark proportional representation system — six members were elected from each of five electorates.
This is a list of members of the Tasmanian House of Assembly between the 1897 election and the 1900 election.
The Electoral district of Lyell was a single-member electoral district of the Tasmanian House of Assembly. It included the towns of Queenstown and Strahan in the West Coast region of Tasmania.
Paul Basil O'Halloran is a former Australian politician.
This is a list of House of Assembly results for the 2010 Tasmanian election.
This is a list of House of Assembly results for the 2006 Tasmanian election.
This is a list of House of Assembly results for the 2014 Tasmanian election.
This is a list of House of Assembly results for the 2018 Tasmanian election.
A by-election for the Australian House of Representatives seat of Braddon took place on Saturday 28 July 2018, following the resignation of incumbent Labor MP Justine Keay.
The Tasmanian Nationals are a political party in the Australian state of Tasmania, aligned with the National Party of Australia. The party is not currently registered with the Tasmanian Electoral Commission, and is not separately registered with the Australian Electoral Commission, unlike the other state branches of the Nationals.
Felix Ashton Ellis is an Australian politician, who was elected to the Tasmanian House of Assembly on 17 August 2020 in a recount to fill a vacancy for the division of Braddon. A member of the Liberal Party, Ellis is a member of the Rockliff ministry, serving as Minister for Police, Fire and Emergency Management, Resources, and Skills, Training and Workforce Growth.
This is a list of electoral division results for the Australian 2007 federal election in the state of Tasmania.
This is a list of electoral division results for the Australian 2004 federal election in the state of Tasmania.
This is a list of electoral results for the division of Bass in Tasmanian elections since 1913.
This is a list of electoral results for the division of Clark and Denison in Tasmanian elections since 1913.
This is a list of electoral results for the division of Franklin in Tasmanian elections since 1913.
This is a list of electoral results for the division of Bass in Tasmanian elections since 1913.