In finance, the capital asset pricing model (CAPM) is a model used to determine a theoretically appropriate required rate of return of an asset, to make decisions about adding assets to a well-diversified portfolio.
Modern portfolio theory (MPT), or mean-variance analysis, is a mathematical framework for assembling a portfolio of assets such that the expected return is maximized for a given level of risk. It is a formalization and extension of diversification in investing, the idea that owning different kinds of financial assets is less risky than owning only one type. Its key insight is that an asset's risk and return should not be assessed by itself, but by how it contributes to a portfolio's overall risk and return. It uses the past variance of asset prices as a proxy for future risk.
In finance, arbitrage pricing theory (APT) is a multi-factor model for asset pricing which relates various macro-economic (systematic) risk variables to the pricing of financial assets. Proposed by economist Stephen Ross in 1976, it is widely believed to be an improved alternative to its predecessor, the Capital Asset Pricing Model (CAPM). APT is founded upon the law of one price, which suggests that within an equilibrium market, rational investors will implement arbitrage such that the equilibrium price is eventually realised. As such, APT argues that when opportunities for arbitrage are exhausted in a given period, then the expected return of an asset is a linear function of various factors or theoretical market indices, where sensitivities of each factor is represented by a factor-specific beta coefficient or factor loading. Consequently, it provides traders with an indication of ‘true’ asset value and enables exploitation of market discrepancies via arbitrage. The linear factor model structure of the APT is used as the basis for evaluating asset allocation, the performance of managed funds as well as the calculation of cost of capital. Furthermore, the newer APT model is more dynamic being utilised in more theoretical application than the preceding CAPM model. A 1986 article written by Gregory Connor and Robert Korajczyk, utilised the APT framework and applied it to portfolio performance measurement suggesting that the Jensen coefficient is an acceptable measurement of portfolio performance.
In finance, the beta is a statistic that measures the expected increase or decrease of an individual stock price in proportion to movements of the Stock market as a whole. Beta can be used to indicate the contribution of an individual asset to the market risk of a portfolio when it is added in small quantity. It is referred to as an asset's non-diversifiable risk, systematic risk, or market risk. Beta is not a measure of idiosyncratic risk.
In finance, the Sharpe ratio measures the performance of an investment such as a security or portfolio compared to a risk-free asset, after adjusting for its risk. It is defined as the difference between the returns of the investment and the risk-free return, divided by the standard deviation of the investment returns. It represents the additional amount of return that an investor receives per unit of increase in risk.
The Treynor reward to volatility model, named after Jack L. Treynor, is a measurement of the returns earned in excess of that which could have been earned on an investment that has no diversifiable risk, per unit of market risk assumed.
Alpha is a measure of the active return on an investment, the performance of that investment compared with a suitable market index. An alpha of 1% means the investment's return on investment over a selected period of time was 1% better than the market during that same period; a negative alpha means the investment underperformed the market. Alpha, along with beta, is one of two key coefficients in the capital asset pricing model used in modern portfolio theory and is closely related to other important quantities such as standard deviation, R-squared and the Sharpe ratio.
A market anomaly in a financial market is predictability that seems to be inconsistent with theories of asset prices. Standard theories include the capital asset pricing model and the Fama-French Three Factor Model, but a lack of agreement among academics about the proper theory leads many to refer to anomalies without a reference to a benchmark theory. Indeed, many academics simply refer to anomalies as "return predictors", avoiding the problem of defining a benchmark theory.
The following outline is provided as an overview of and topical guide to finance:
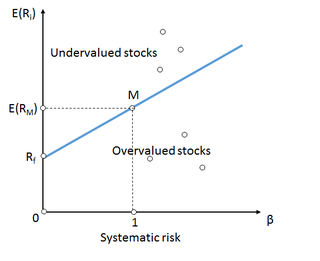
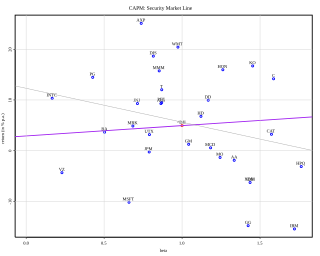
Security market line (SML) is the representation of the capital asset pricing model. It displays the expected rate of return of an individual security as a function of systematic, non-diversifiable risk. The risk of an individual risky security reflects the volatility of the return from security rather than the return of the market portfolio. The risk in these individual risky securities reflects the systematic risk.
The single-index model (SIM) is a simple asset pricing model to measure both the risk and the return of a stock. The model has been developed by William Sharpe in 1963 and is commonly used in the finance industry. Mathematically the SIM is expressed as:
Roll's critique is a famous analysis of the validity of empirical tests of the capital asset pricing model (CAPM) by Richard Roll. It concerns methods to formally test the statement of the CAPM, the equation
In asset pricing and portfolio management the Fama–French three-factor model is a statistical model designed in 1992 by Eugene Fama and Kenneth French to describe stock returns. Fama and French were colleagues at the University of Chicago Booth School of Business, where Fama still works. In 2013, Fama shared the Nobel Memorial Prize in Economic Sciences for his empirical analysis of asset prices. The three factors are (1) market excess return, (2) the outperformance of small versus big companies, and (3) the outperformance of high book/market versus low book/market companies. There is academic debate about the last two factors.
A portfolio manager (PM) is a professional responsible for making investment decisions and carrying out investment activities on behalf of vested individuals or institutions. Clients invest their money into the PM's investment policy for future growth, such as a retirement fund, endowment fund, or education fund. PMs work with a team of analysts and researchers and are responsible for establishing an investment strategy, selecting appropriate investments, and allocating each investment properly towards an investment fund or asset management vehicle.
Modigliani risk-adjusted performance (also known as M2, M2, Modigliani–Modigliani measure or RAP) is a measure of the risk-adjusted returns of some investment portfolio. It measures the returns of the portfolio, adjusted for the risk of the portfolio relative to that of some benchmark (e.g., the market). We can interpret the measure as the difference between the scaled excess return of our portfolio P and that of the market, where the scaled portfolio has the same volatility as the market. It is derived from the widely used Sharpe ratio, but it has the significant advantage of being in units of percent return (as opposed to the Sharpe ratio – an abstract, dimensionless ratio of limited utility to most investors), which makes it dramatically more intuitive to interpret.
In finance, active return refers the returns produced by an investment portfolio due to active management decisions made by the portfolio manager that cannot be explained by the portfolio's exposure to returns or to risks in the portfolio's investment benchmark; active return is usually the objective of active management and subject of performance attribution. In contrast, passive returns refers to returns produced by an investment portfolio due to its exposure to returns of its benchmark. Passive returns can be obtained deliberately through passive tracking of the portfolio benchmark or obtained inadvertently through an investment process unrelated to tracking the index.
Returns-based style analysis is a statistical technique used in finance to deconstruct the returns of investment strategies using a variety of explanatory variables. The model results in a strategy's exposures to asset classes or other factors, interpreted as a measure of a fund or portfolio manager's investment style. While the model is most frequently used to show an equity mutual fund’s style with reference to common style axes, recent applications have extended the model’s utility to model more complex strategies, such as those employed by hedge funds.
In portfolio management, the Carhart four-factor model is an extra factor addition in the Fama–French three-factor model, proposed by Mark Carhart. The Fama-French model, developed in the 1990, argued most stock market returns are explained by three factors: risk, price and company size. Carhart added a momentum factor for asset pricing of stocks. The Four Factor Model is also known in the industry as the Monthly Momentum Factor (MOM). Momentum is the speed or velocity of price changes in a stock, security, or tradable instrument.
Nontraded assets are assets that are not traded on the market. Human capital is the most important nontraded assets. Other important nontraded asset classes are private businesses, claims to government transfer payments and claims on trust income.
The Rachev Ratio is a risk-return performance measure of an investment asset, portfolio, or strategy. It was devised by Dr. Svetlozar Rachev and has been extensively studied in quantitative finance. Unlike the reward-to-variability ratios, such as Sharpe ratio and Sortino ratio, the Rachev ratio is a reward-to-risk ratio, which is designed to measure the right tail reward potential relative to the left tail risk in a non-Gaussian setting. Intuitively, it represents the potential for extreme positive returns compared to the risk of extreme losses, at a rarity frequency q defined by the user.


