Lambton—Kent—Middlesex (provincial electoral district)

Last updated • 2 min readFrom Wikipedia, The Free Encyclopedia
Lambton—Kent—Middlesex
Flag of Ontario.svg Ontario electoral district
Middlesex-Kent-Lambton.png
Provincial electoral district
Legislature Legislative Assembly of Ontario
MPP


Steve Pinsonneault
Progressive Conservative
District created1999
First contested 1999
Last contested 2025
Demographics
Population (2016)105,335
Electors (2018)83,993
Area (km²)5,708
Pop. density (per km²)18.5
Census division(s) Chatham-Kent, Lambton County, Middlesex County
Census subdivision(s) Lambton Shores, Warwick, Brooke-Alvinston, Dawn-Euphemia, Southwest Middlesex, Newbury, Adelaide Metcalfe, Strathroy-Caradoc, Oneida 41, Chippewas of the Thames First Nation 42, Walpole Island 46, Chatham-Kent, North Middlesex, Lucan Biddulph, Middlesex Centre

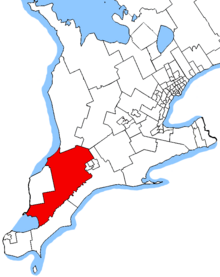
Lambton—Kent—Middlesex is a provincial electoral district in southwestern Ontario, Canada. It elects one member to the Legislative Assembly of Ontario.

Contents

It was created in 1999 from parts of Lambton, Chatham—Kent and Middlesex when ridings were redistributed to match their federal counterparts.

From 1999 to 2007 the riding consisted of the municipalities of Lambton Shores, Warwick, Brooke-Alvinston, Dawn-Euphemia, Southwest Middlesex, Newbury, Adelaide Metcalfe, Strathroy-Caradoc, Oneida 41, Chippewas of the Thames First Nation 42, Plympton-Wyoming, Enniskillen, Petrolia, Oil Springs, Walpole Island 46, Chatham-Kent north of the Thames River and not including the former city of Chatham, and the southwest third of North Middlesex.

In 2007, the riding was redistributed, and it lost Plympton-Wyoming, Enniskillen, Petrolia and Oil Springs while it gained the rest of North Middlesex, Lucan Biddulph and Middlesex Centre.

A rural riding by nature, the issues of gun control and abortion arise frequently during town-hall meetings and elections.

During the 1999 election, the riding attracted controversy as it included Ipperwash Provincial Park - the sight of a 1995 stand-off between the Ontario Provincial Police and native land protesters known as the Ipperwash Crisis. Political events in the riding became frequent targets for further protests by natives unhappy with the Conservative Government's handling of the Ipperwash Affair and the associated shooting death of protester Dudley George. Despite the controversy, Progressive Conservative MPP Marcel Beaubien was re-elected to the Legislative Assembly of Ontario, despite strong campaigns by Liberal former municipal politician Larry O'Neil and New Democratic candidate Jim Lee, then-President of United Automobile Workers Local 251.

Members of Provincial Parliament

This riding has elected the following members of the Legislative Assembly of Ontario:

Lambton—Kent—Middlesex
AssemblyYearsMemberParty
Riding created from Lambton, Chatham—Kent and Middlesex
37th  1999–2003   Marcel Beaubien Progressive Conservative
38th  2003–2007   Maria Van Bommel Liberal
39th  2007–2011
40th  2011–2014   Monte McNaughton Progressive Conservative
41st  2014–2018
42nd  2018–2022
43rd  2022–2023
 2024–present Steve Pinsonneault

Election results

2025 Ontario general election
** Preliminary results — Not yet official **
PartyCandidateVotes%±%Expenditures
Progressive Conservative Steve Pinsonneault 25,29753.6–3.3
Liberal Cathy Burghardt-Jesson12,39726.2+3.4
New Democratic Kathryn Shailer5,77912.2+1.4
New Blue Andy Fisher2,0934.4–1.1
Green Andraena Tilgner1,6773.6+1.9
Total valid votes/expense limit
Total rejected, unmarked, and declined ballots
Turnout51.4+21.1
Eligible voters91,874
Progressive Conservative hold Swing –3.4
Source: Elections Ontario [1]
Ontario provincial by-election, May 2, 2024
Resignation of Monte McNaughton
PartyCandidateVotes%±%
Progressive Conservative Steve Pinsonneault 15,65656.80-2.01
Liberal Cathy Burghardt-Jesson6,28922.82+13.24
New Democratic Kathryn Shailer2,97810.80-8.04
New Blue Keith Benn1,5155.50-0.87
Green Andraena Tilgner4291.56-2.42
None of the Above Stephen R. Campbell3601.31+0.60
Ontario Party Cynthia Workman2500.91-0.80
Family RightsHilda Walton870.32
Total valid votes27,564
Total rejected ballots87
Turnout30.29-17.08
Eligible voters90,993
Progressive Conservative hold Swing -7.46
2022 Ontario general election
PartyCandidateVotes%±%Expenditures
Progressive Conservative Monte McNaughton 24,93358.81+3.46$86,631
New Democratic Vanessa Benoit7,98718.8414.48$66,308
Liberal Bruce Baker4,0639.58+3.35$0
New Blue David Barnwell2,7016.37 $3,090
Green Wanda Dickey1,6883.98+0.69$381
Ontario Party Aaron Istvan Vegh7271.71 $0
None of the Above Dean Eve3000.71 $283
Total valid votes/expense limit42,39999.41+0.63$126,309
Total rejected, unmarked, and declined ballots2530.59-0.63
Turnout42,65247.2813.50
Eligible voters90,109
Progressive Conservative hold Swing +8.97
Source(s)
"Summary of Valid Votes Cast for Each Candidate" (PDF). Elections Ontario. Archived from the original on 2023-05-18.
"Statistical Summary by Electoral District" (PDF). Elections Ontario. Archived from the original on 2023-05-21.
2018 Ontario general election
PartyCandidateVotes%±%
Progressive Conservative Monte McNaughton 27,90655.34+10.02
New Democratic Todd Case16,80033.32+6.87
Liberal Mike Radan3,1436.23-13.95
Green Anthony Li1,6603.29-1.30
Trillium Brian Everaert5551.10
Libertarian Brad Greulich3600.71
Total valid votes50,42498.78
Total rejected, unmarked and declined ballots6221.22
Turnout51,04660.77
Eligible voters83,993
Progressive Conservative hold Swing +1.57
Source: Elections Ontario [2]

^ Results are compared to redistributed results

2014 general election redistributed results [3]
PartyVote %
  Progressive Conservative 20,51445.32
  New Democratic 11,96926.44
  Liberal 9,13620.19
  Green 2,0724.58
 Others1,5703.47
2014 Ontario general election
PartyCandidateVotes%±%
Progressive Conservative Monte McNaughton 20,71045.17-0.56
New Democratic Joe Hill12,16026.52+5.56
Liberal Mike Radan9,29820.28-9.04
Green James Armstrong2,1044.59+2.26
Family Coalition Marinus Vander Vloet5681.24+0.41
None of the Above Bob Lewis5581.22
Freedom Dave Durnin2420.53+0.25
Libertarian Matt Willson2070.45
Total valid votes45,84798.60
Total rejected, unmarked and declined ballots6531.40+0.99
Turnout46,50056.93+2.85
Eligible voters81,678
Progressive Conservative hold Swing -3.06
Source: Elections Ontario [4]
2011 Ontario general election
PartyCandidateVotes%±%
Progressive Conservative Monte McNaughton 19,37945.74+9.43
Liberal Maria Van Bommel 12,42329.32-13.95
New Democratic Joe Hill8,88220.96+10.23
Green James Armstrong9872.33-5.57
Family Coalition Marinus Vander Vloet3500.83-0.48
Reform Brad Harness2320.55+0.05
Freedom Tom Jackson1190.28 
Total valid votes42,372 99.58
Total rejected, unmarked and declined ballots1770.42-0.16
Turnout42,54954.08-1.10
Eligible voters78,683
Progressive Conservative gain from Liberal Swing +11.69
Source: Elections Ontario [5]
2007 Ontario general election
PartyCandidateVotes%±%
Liberal Maria Van Bommel 18,22843.27-1.39
Progressive Conservative Monte McNaughton 15,29536.30+0.63
New Democratic Joyce Jolliffe4,52010.73-1.21
Green James Armstrong3,3297.90
Family Coalition Bill McMaster5491.30
Reform Brad Harness2090.50
Total valid votes 42,130 99.43
Total rejected, unmarked and declined ballots2430.57
Turnout42,37355.18
Eligible voters76,790
Liberal hold Swing -1.01
2003 general election redistributed results [6]
PartyVote %
  Liberal 17,80444.65
  Progressive Conservative 14,22335.67
  New Democratic 4,76111.94
 Others3,0857.74
2003 Ontario general election
PartyCandidateVotes%±%
Liberal Maria Van Bommel 18,53345.11+2.18
Progressive Conservative Marcel Beaubien 15,06036.66-8.34
New Democratic Joyce Jolliffe4,52311.01+1.42
Green Tim Van Bodegom1,1332.76
Independent James Armstrong1,0532.56
Freedom Wayne Forbes7801.90-0.58
Total valid votes41,082 99.19
Total rejected, unmarked and declined ballots3360.81-0.19
Turnout41,41859.75-0.71
Eligible voters69,314
Liberal gain from Progressive Conservative Swing +5.26
1999 Ontario general election
PartyCandidateVotes%
Progressive Conservative Marcel Beaubien 19,56145.00
Liberal Larry O'Neill18,66542.94
New Democratic Jim Lee4,1709.59
Freedom Wayne H. Forbes1,0762.48
Total valid votes43,472 99.00
Total rejected, unmarked and declined ballots4401.00
Turnout43,91260.46
Eligible voters72,630

2007 electoral reform referendum

2007 Ontario electoral reform referendum
SideVotes%
First Past the Post28,14468.8
Mixed member proportional12,77531.2
Total valid votes40,919100.0

Sources

  1. "Lambton—Kent—Middlesex Unofficial Election Results". Elections Ontario. 28 February 2025. Retrieved 28 February 2025.
  2. "Data Explorer". Elections Ontario. Retrieved 24 December 2023.
  3. "50 - Lambton-Kent-Middlesex".
  4. Elections Ontario. "Data Explorer" . Retrieved 24 December 2023.
  5. Elections Ontario (2011). "Data Explorer" . Retrieved 24 December 2023.
  6. "Archived copy". www.elections.on.ca. Archived from the original on 12 October 2007. Retrieved 26 July 2023.{{cite web}}: CS1 maint: archived copy as title (link)

42°48′N81°48′W / 42.8°N 81.8°W / 42.8; -81.8