Limited dependent variable

Last updated

A limited dependent variable is a variable whose range of possible values is "restricted in some important way." [1] In econometrics, the term is often used when estimation of the relationship between the limited dependent variable of interest and other variables requires methods that take this restriction into account. For example, this may arise when the variable of interest is constrained to lie between zero and one, as in the case of a probability, or is constrained to be positive, as in the case of wages or hours worked.

Econometrics is the application of statistical methods to economic data in order to give empirical content to economic relationships. More precisely, it is "the quantitative analysis of actual economic phenomena based on the concurrent development of theory and observation, related by appropriate methods of inference". An introductory economics textbook describes econometrics as allowing economists "to sift through mountains of data to extract simple relationships". The first known use of the term "econometrics" was by Polish economist Paweł Ciompa in 1910. Jan Tinbergen is considered by many to be one of the founding fathers of econometrics. Ragnar Frisch is credited with coining the term in the sense in which it is used today.

Probability is the measure of the likelihood that an event will occur. See glossary of probability and statistics. Probability quantifies as a number between 0 and 1, where, loosely speaking, 0 indicates impossibility and 1 indicates certainty. The higher the probability of an event, the more likely it is that the event will occur. A simple example is the tossing of a fair (unbiased) coin. Since the coin is fair, the two outcomes are both equally probable; the probability of "heads" equals the probability of "tails"; and since no other outcomes are possible, the probability of either "heads" or "tails" is 1/2.

Contents

Limited dependent variable models include: [2]

Censored regression models commonly arise in econometrics in cases where the variable of interest is only observable under certain conditions. A common example is labor supply. Data are frequently available on the hours worked by employees, and a labor supply model estimates the relationship between hours worked and characteristics of employees such as age, education and family status. However, such estimates undertaken using linear regression will be biased by the fact that for people who are unemployed it is not possible to observe the number of hours they would have worked had they had employment. Still we know age, education and family status for those observations. The censored model should not be confused with the truncated regression model, which is in general different and requires different types of estimators.

Truncated regression models arise in many applications of statistics, for example in econometrics, in cases where observations with values in the outcome variable below or above certain thresholds are systematically excluded from the sample. Therefore, whole observations are missing, so that neither the dependent nor the independent variable is known.

Selection bias is the bias introduced by the selection of individuals, groups or data for analysis in such a way that proper randomization is not achieved, thereby ensuring that the sample obtained is not representative of the population intended to be analyzed. It is sometimes referred to as the selection effect. The phrase "selection bias" most often refers to the distortion of a statistical analysis, resulting from the method of collecting samples. If the selection bias is not taken into account, then some conclusions of the study may not be accurate.
See also

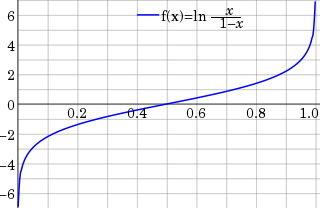
Logit inverse of the sigmoidal "logistic" function or logistic transform

In statistics, the logit function or the log-odds is the logarithm of the odds p/(1 − p) where p is the probability.. It is a type of function that creates a map of probability values from to . It is the inverse of the sigmoidal "logistic" function or logistic transform used in mathematics, especially in statistics.

Ordered logit Regression model for ordinal dependent variables

In statistics, the ordered logit model, is an ordinal regression model—that is, a regression model for ordinal dependent variables—first considered by Peter McCullagh. For example, if one question on a survey is to be answered by a choice among "poor", "fair", "good", and "excellent", and the purpose of the analysis is to see how well that response can be predicted by the responses to other questions, some of which may be quantitative, then ordered logistic regression may be used. It can be thought of as an extension of the logistic regression model that applies to dichotomous dependent variables, allowing for more than two (ordered) response categories.

Probit

In probability theory and statistics, the probit function is the quantile function associated with the standard normal distribution, which is commonly denoted as N(0,1). Mathematically, it is the inverse of the cumulative distribution function of the standard normal distribution, which is denoted as , so the probit is denoted as . It has applications in exploratory statistical graphics and specialized regression modeling of binary response variables.

See also

Related Research Articles

In statistics and econometrics, particularly in regression analysis, a dummy variable is one that takes the value 0 or 1 to indicate the absence or presence of some categorical effect that may be expected to shift the outcome. Dummy variables are used as devices to sort data into mutually exclusive categories. For example, in econometric time series analysis, dummy variables may be used to indicate the occurrence of wars or major strikes. A dummy variable can thus be thought of as a truth value represented as a numerical value 0 or 1.

In statistics, a linear probability model is a special case of a binomial regression model. Here the dependent variable for each observation takes values which are either 0 or 1. The probability of observing a 0 or 1 in any one case is treated as depending on one or more explanatory variables. For the "linear probability model", this relationship is a particularly simple one, and allows the model to be fitted by simple linear regression.

Probit model statistical regression where the dependent variable can take only two values, to estimate the probability that an observation with particular characteristics will fall into one of the categories

In statistics, a probit model is a type of regression where the dependent variable can take only two values, for example married or not married. The word is a portmanteau, coming from probability + unit. The purpose of the model is to estimate the probability that an observation with particular characteristics will fall into a specific one of the categories; moreover, classifying observations based on their predicted probabilities is a type of binary classification model.

The Tobit model is a statistical model proposed by James Tobin (1958) to describe the relationship between a non-negative dependent variable and an independent variable . The term Tobit was derived from Tobin's name by truncating and adding -it by analogy with the probit model. The Tobit model is distinct from the truncated regression model, which is in general different and requires a different estimator.

Ordered probit

In statistics, ordered probit is a whole of the widely used probit analysis to the case of more than two outcomes of an ordinal dependent variable. Similarly, the widely used logit method also has a counterpart ordered logit. Ordered probit, like ordered logit, is a particular method of ordinal regression.

Predictive analytics encompasses a variety of statistical techniques from data mining, predictive modelling, and machine learning, that analyze current and historical facts to make predictions about future or otherwise unknown events.

A variety of methods are used in econometrics to estimate models consisting of a single equation. The oldest and still the most commonly used is the ordinary least squares method used to estimate linear regressions.

Discrete choice

In economics, discrete choice models, or qualitative choice models, describe, explain, and predict choices between two or more discrete alternatives, such as entering or not entering the labor market, or choosing between modes of transport. Such choices contrast with standard consumption models in which the quantity of each good consumed is assumed to be a continuous variable. In the continuous case, calculus methods can be used to determine the optimum amount chosen, and demand can be modeled empirically using regression analysis. On the other hand, discrete choice analysis examines situations in which the potential outcomes are discrete, such that the optimum is not characterized by standard first-order conditions. Thus, instead of examining “how much” as in problems with continuous choice variables, discrete choice analysis examines “which one.” However, discrete choice analysis can also be used to examine the chosen quantity when only a few distinct quantities must be chosen from, such as the number of vehicles a household chooses to own and the number of minutes of telecommunications service a customer decides to purchase. Techniques such as logistic regression and probit regression can be used for empirical analysis of discrete choice.

The Heckman correction is statistical technique to correct bias from non-randomly selected samples or otherwise incidentally truncated dependent variables, a pervasive issue in quantitative social sciences when using observational data. Conceptually, this is achieved by explicitly modelling the selection process together with the outcome equation. The resulting likelihood function is mathematically similar to the Tobit model for censored dependent variables, a connection first drawn by James Heckman in 1976. Heckman also developed a two-step control function approach to estimate this model, which reduced the computional burden of having to estimate both equations jointly, albeit at the cost of inefficiency. Heckman received the Economics Nobel Prize in 2000 for his work in this field.

In statistics, truncation results in values that are limited above or below, resulting in a truncated sample. A random variable is said to be truncated from below if, for some threshold value , the exact value of is known for all cases , but unknown for all cases . Similarly, truncation from above means the exact value of is known in cases where , but unknown when .

The following outline is provided as an overview of and topical guide to regression analysis:

In probability theory, the Mills ratio of a continuous random variable is the function

Ordinal regression Regression analysis for modeling ordinal data

In statistics, ordinal regression is a type of regression analysis used for predicting an ordinal variable, i.e. a variable whose value exists on an arbitrary scale where only the relative ordering between different values is significant. It can be considered an intermediate problem between regression and classification. Examples of ordinal regression are ordered logit and ordered probit. Ordinal regression turns up often in the social sciences, for example in the modeling of human levels of preference, as well as in information retrieval. In machine learning, ordinal regression may also be called ranking learning.

LIMDEP

LIMDEP is an econometric and statistical software package with a variety of estimation tools. In addition to the core econometric tools for analysis of cross sections and time series, LIMDEP supports methods for panel data analysis, frontier and efficiency estimation and discrete choice modeling. The package also provides a programming language to allow the user to specify, estimate and analyze models that are not contained in the built in menus of model forms.

NLOGIT

NLOGIT is an extension of the econometric and statistical software package LIMDEP. In addition to the estimation tools in LIMDEP, NLOGIT provides programs for estimation, model simulation and analysis of multinomial choice data, such as brand choice, transportation mode and for survey and market data in which consumers choose among a set of competing alternatives.

In mathematics, a variable may be continuous or discrete. If it can take on two particular real values such that it can also take on all real values between them, the variable is continuous in that interval. If it can take on a value such that there is a non-infinitesimal gap on each side of it containing no values that the variable can take on, then it is discrete around that value. In some contexts a variable can be discrete in some ranges of the number line and continuous in others.

References

  1. Wooldridge, J.M. (2002). Econometric Analysis of Cross Section and Panel Data. MIT Press, Cambridge. p. 451. ISBN   0-262-23219-7. OCLC   47521388.
  2. Maddala, G.S. (1983). Limited-Dependent and Qualitative Variables in Econometrics. Cambridge University Press, Cambridge, UK. ISBN   0-521-33825-5. OCLC   25207809.
  3. Stock, James H.; Watson, Mark W. (2003). Introduction to Econometrics. Addison-Wesley, Boston. pp. 328–9. ISBN   0-201-71595-3. OCLC   248704396.