| |||||||||||||||||||||||||||||||||||||||||||||||||||||||||||||||||||||||||||||
31 of 90 seats (One Third and one by-election) to Liverpool City Council 46 seats needed for a majority | |||||||||||||||||||||||||||||||||||||||||||||||||||||||||||||||||||||||||||||
---|---|---|---|---|---|---|---|---|---|---|---|---|---|---|---|---|---|---|---|---|---|---|---|---|---|---|---|---|---|---|---|---|---|---|---|---|---|---|---|---|---|---|---|---|---|---|---|---|---|---|---|---|---|---|---|---|---|---|---|---|---|---|---|---|---|---|---|---|---|---|---|---|---|---|---|---|---|
| |||||||||||||||||||||||||||||||||||||||||||||||||||||||||||||||||||||||||||||
Map of results of 2018 election | |||||||||||||||||||||||||||||||||||||||||||||||||||||||||||||||||||||||||||||
|
The 2018 Liverpool City Council election took place on 3 May 2018 to elect members of Liverpool City Council in England. This was on the same day as other local elections.
Liverpool City Council is the governing body for the city of Liverpool in Merseyside, England. It consists of 90 councillors, three for each of the city's 30 wards.
Overall result compared with 2016.
Liverpool City Council election result, 2018 | |||||||||||||||
---|---|---|---|---|---|---|---|---|---|---|---|---|---|---|---|
Party | Candidates | Votes | |||||||||||||
Stood | Elected | Gained | Unseated | Net | % of total | % | № | Net % | |||||||
Labour | 31 | 25 | 0 | 3 | 80.0 | 63.8 | 60,272 | ||||||||
Liberal Democrat | 31 | 3 | 3 | 0 | 10.0 | 16.7 | 15,742 | ||||||||
Green | 31 | 2 | 0 | 0 | 6.7 | 9.4 | 8,839 | ||||||||
Conservative | 31 | 0 | 0 | 0 | 0.0 | 5.6 | 5,254 | ||||||||
Liberal | 18 | 1 | 0 | 0 | 3.3 | 4.2 | 3,932 | ||||||||
Independent | 2 | 0 | 0 | 0 | 0.0 | 0.3 | 253 | ||||||||
TUSC | 1 | 0 | 0 | 0 | 0.0 | 0.2 | 197 | ||||||||
Old Swan Against the Cuts | 1 | 0 | 0 | 0 | 0.0 | 0.2 | 157 |
Party | Candidate | Votes | % | ± | |
---|---|---|---|---|---|
Labour | Kimberley Berry | 1,885 | 44.3 | ||
Liberal Democrat | Steve Brauner | 1,811 | 42.6 | ||
Conservative | Denise Nuttall | 325 | 7.6 | ||
Green | Maggi Williams | 232 | 5.5 | ||
Majority | 74 | 1.7 | N/A | ||
Registered electors | 11,589 | ||||
Turnout | 4,259 | 36.8 | |||
Rejected ballots | 6 | 0.1 | |||
Labour hold | Swing |
Party | Candidate | Votes | % | ± | |
---|---|---|---|---|---|
Labour | Billy Marrat | 1,777 | 80.0 | ||
Conservative | Christopher Smith | 140 | 6.3 | ||
Liberal Democrat | Wiebke Rüterjans | 134 | 6.0 | ||
Green | Rachel Burcher | 114 | 5.1 | ||
Liberal | James Richardson | 56 | 2.5 | ||
Majority | 1,721 | 73.7 | |||
Registered electors | 9,212 | ||||
Turnout | 2,228 | 24.2 | |||
Rejected ballots | 7 | 0.3 | |||
Labour hold | Swing |
Party | Candidate | Votes | % | ± | |
---|---|---|---|---|---|
Labour | Pauline Walton | 2,574 | 82.6 | ||
Liberal Democrat | Stephen Atkinson | 227 | 7.3 | ||
Conservative | Wendy Hine | 181 | 5.8 | ||
Green | Hilary McDonagh | 94 | 3.0 | ||
Liberal | Marjorie Peel | 40 | 1.3 | ||
Majority | 2,347 | 75.3 | |||
Registered electors | 11,547 | ||||
Turnout | 3,132 | 27.1 | |||
Rejected ballots | 16 | 0.5 | |||
Labour hold | Swing |
Party | Candidate | Votes | % | ± | |
---|---|---|---|---|---|
Labour | Nick Small | 1,066 | 67.9 | ||
Green | Jayne Clough | 182 | 11.6 | ||
Liberal Democrat | Greg Howard | 119 | 7.6 | ||
Conservative | Lee Berry | 118 | 7.5 | ||
Independent | John Leadbeater | 84 | 5.4 | New | |
Majority | 884 | 56.3 | |||
Registered electors | 9,766 | ||||
Turnout | 1,572 | 16.1 | |||
Rejected ballots | 3 | 0.2 | |||
Labour hold | Swing |
Party | Candidate | Votes | % | ± | |
---|---|---|---|---|---|
Liberal Democrat | Carole Storey | 2,200 | 48.6 | ||
Labour | Frank Hont | 1,956 | 43.2 | ||
Green | Phil Williamson | 179 | 4.0 | ||
Conservative | David Jeffery | 150 | 3.3 | ||
Liberal | Lindsey Wood | 40 | 0.9 | New | |
Majority | 244 | 5.4 | N/A | ||
Registered electors | 10,804 | ||||
Turnout | 4,536 | 42.0 | |||
Rejected ballots | 11 | 0.2 | |||
Liberal Democrat gain from Labour | Swing | ||||
Party | Candidate | Votes | % | ± | |
---|---|---|---|---|---|
Liberal Democrat | Liz Makinson | 2,706 | 58.0 | ||
Labour | Nigel Parsons | 1,474 | 31.6 | ||
Green | Julie Birch-Holt | 321 | 6.9 | ||
Conservative | Thomas Burton | 166 | 3.6 | ||
Majority | 1,232 | 26.4 | |||
Registered electors | 10,594 | ||||
Turnout | 4,672 | 44.1 | |||
Rejected ballots | 5 | 0.1 | |||
Liberal Democrat gain from Labour | Swing | ||||
Thomas Burton, the Conservative party candidate for Church ward was ineligible to sit as a councillor as he was a Liverpool City Council employee. [7]
Party | Candidate | Votes | % | ± | |
---|---|---|---|---|---|
Labour | Roz Gladden | 2,136 | 83.1 | ||
Liberal | Paul Jones | 129 | 5.0 | ||
Conservative | Peter Andrew | 127 | 4.9 | ||
Green | Esther Cosslett | 104 | 4.0 | ||
Liberal Democrat | Paul Childs | 75 | 2.9 | ||
Majority | 2,007 | 78.1 | |||
Registered electors | 11,243 | ||||
Turnout | 2,583 | 23.0 | |||
Rejected ballots | 12 | 0.5 | |||
Labour hold | Swing |
Party | Candidate | Votes | % | ± | |
---|---|---|---|---|---|
Labour | Gerard Woodhouse | 2,023 | 86.6 | ||
Liberal Democrat | Robert McAllister-Bell | 147 | 6.3 | ||
Conservative | Olivia Lever | 85 | 3.6 | ||
Green | Ceri Jones | 80 | 3.4 | ||
Majority | 1,876 | 80.3 | |||
Registered electors | 9,427 | ||||
Turnout | 2,345 | 24.9 | |||
Rejected ballots | 10 | 0.4 | |||
Labour hold | Swing |
Party | Candidate | Votes | % | ± | |
---|---|---|---|---|---|
Labour | Lynnie Hinnigan | 2,444 | 52.4 | ||
Liberal Democrat | Norman Mills | 1,566 | 33.6 | ||
Green | Elke Weissmann | 342 | 7.3 | ||
Conservative | Jade Marsden | 309 | 6.6 | ||
Majority | 878 | 18.8 | |||
Registered electors | 11,578 | ||||
Turnout | 4,665 | 40.3 | |||
Rejected ballots | 4 | 0.1 | |||
Labour hold | Swing |
Party | Candidate | Votes | % | ± | |
---|---|---|---|---|---|
Labour | Peter Mitchell | 2,120 | 82.9 | ||
Conservative | Alice Day | 172 | 6.7 | ||
Green | Martin Randall | 99 | 3.9 | ||
Liberal Democrat | Richard Bentall | 91 | 3.6 | ||
Liberal | Raymond Catesby | 76 | 3.0 | ||
Majority | 1,984 | 76.2 | |||
Registered electors | 10,558 | ||||
Turnout | 2,567 | 24.3 | |||
Rejected ballots | 9 | 0.4 | |||
Labour hold | Swing |
Party | Candidate | Votes | % | ± | |
---|---|---|---|---|---|
Labour | Ian Byrne | 2,295 | 86.6 | ||
Conservative | David Murray | 136 | 5.1 | ||
Green | Noèl Little | 100 | 3.8 | ||
Liberal | Linda Roberts | 60 | 2.3 | ||
Liberal Democrat | Nicolas Sawyer | 59 | 2.2 | New | |
Majority | 2,159 | 81.5 | |||
Registered electors | 10,746 | ||||
Turnout | 2,663 | 24.8 | |||
Rejected ballots | 13 | 0.5 | |||
Labour hold | Swing |
Party | Candidate | Votes | % | ± | |
---|---|---|---|---|---|
Labour | Lindsay Melia | 2,219 | 83.2 | ||
Conservative | Giselle McDonald | 177 | 6.6 | ||
Green | Luke Burke | 115 | 4.3 | ||
Liberal Democrat | Joseph Slupsky | 108 | 4.0 | ||
Liberal | Maureen Keyes | 49 | 1.8 | New | |
Majority | 2,042 | 76.6 | |||
Registered electors | 11,252 | ||||
Turnout | 2,677 | 23.8 | |||
Rejected ballots | 9 | 0.3 | |||
Labour hold | Swing |
Party | Candidate | Votes | % | ± | |
---|---|---|---|---|---|
Green | Lawrence Brown | 1,648 | 48.2 | ||
Labour | Jon Morris | 1,553 | 45.5 | ||
Liberal Democrat | Fiona McBride | 116 | 3.4 | ||
Conservative | Nicholas Basson | 99 | 2.9 | ||
Majority | 95 | 2.7 | N/A | ||
Registered electors | 8,897 | ||||
Turnout | 3,426 | 39.0 | |||
Rejected ballots | 10 | 0.3 | |||
Green hold | Swing |
Party | Candidate | Votes | % | ± | |
---|---|---|---|---|---|
Labour | Sue Walker | 1,768 | 76.1 | ||
Green | Steve Faragher | 179 | 7.7 | ||
Independent | Joe Owens | 114 | 4.9 | New | |
Liberal Democrat | Bill Barrow | 110 | 4.7 | ||
Conservative | Brian Jones | 85 | 3.7 | ||
Liberal | Damien Daly | 68 | 2.9 | ||
Majority | 1,589 | 68.4 | |||
Registered electors | 9,347 | ||||
Turnout | 2,335 | 25.0 | |||
Rejected ballots | 11 | 0.5 | |||
Labour hold | Swing |
Three days before the election, Green Candidate Steve Faragher resigned from the Green Party due to an online comment. [16] This was too late for the ballot paper to be changed. [17]
The Green Party of England and Wales is a green, left-wing political party in England and Wales. Headquartered in London, since September 2018, its co-leaders are Siân Berry and Jonathan Bartley. The Green Party has one representative in the House of Commons, one in the House of Lords, and three in the European Parliament. In addition, it has various councillors in UK local government and two members of the London Assembly.
Party | Candidate | Votes | % | ± | |
---|---|---|---|---|---|
Labour | Malcolm Kennedy | 2,094 | 82.1 | ||
TUSC | Roger Bannister | 149 | 5.8 | ||
Green | Jonathan Clatworthy | 104 | 4.1 | ||
Conservative | Daniel Nuttall | 103 | 4.0 | ||
Liberal Democrat | Mike McAllister-Bell | 76 | 3.0 | New | |
Liberal | Thomas Ryan | 23 | 0.9 | New | |
Majority | 1,945 | 76.3 | |||
Registered electors | 11,370 | ||||
Turnout | 2,557 | 22.5 | |||
Rejected ballots | 8 | 0.3 | |||
Labour hold | Swing |
Party | Candidate | Votes | % | ± | |
---|---|---|---|---|---|
Labour | Alison Clarke | 1,978 | 70.3 | ||
Labour | Harry Doyle | 1,895 | – | – | |
Liberal Democrat | Graham Hughes | 329 | 11.7 | ||
Conservative | Mark Butchard | 272 | 9.7 | ||
Conservative | Irene Stuart | 235 | – | – | |
Liberal Democrat | Gerard Thompson | 182 | – | – | |
Green | Fiona Coyne | 154 | 5.5 | ||
Green | Michael Humphrey Johnson | 116 | – | – | |
Liberal | Kenneth Russell | 79 | 2.8 | ||
Majority | 1,649 | 58.6 | |||
Registered electors | 10,599 | ||||
Turnout | 2,624 | 24.9 | |||
Rejected ballots | 8 | 0.2 | |||
Labour hold | Swing | ||||
Labour hold | Swing | – |
Party | Candidate | Votes | % | ± | |
---|---|---|---|---|---|
Labour | Elizabeth Hayden | 1,904 | 45.6 | ||
Liberal Democrat | Alisha Lewis | 1,462 | 35.0 | ||
Green | Ted Grant | 440 | 10.5 | ||
Conservative | Chris Hall | 260 | 6.2% | ||
Liberal | David Wood | 106 | 2.5 | ||
Majority | 442 | 10.6 | |||
Registered electors | 9,410 | ||||
Turnout | 4,172 | 44.4 | |||
Rejected ballots | 7 | 0.2 | |||
Labour hold | Swing |
Party | Candidate | Votes | % | ± | |
---|---|---|---|---|---|
Labour | Barry Kushner | 2,344 | 85.8 | ||
Green | Martyn Madeley | 142 | 5.2 | ||
Conservative | Alma McGing | 132 | 4.8 | ||
Liberal Democrat | Sam Buist | 62 | 2.3 | New | |
Liberal | Brenda Jean Edwards | 51 | 1.9 | New | |
Majority | 2,202 | 80.6 | |||
Registered electors | 12,116 | ||||
Turnout | 2,746 | 22.7 | |||
Rejected ballots | 15 | 0.5 | |||
Labour hold | Swing |
Party | Candidate | Votes | % | ± | |
---|---|---|---|---|---|
Labour | Joanne Calvert | 2,174 | 75.0 | ||
Liberal Democrat | Chris Collins | 162 | 5.6 | ||
Old Swan Against the Cuts | Martin Ralph | 157 | 5.4 | ||
Conservative | Derek Nuttall | 144 | 5.0 | ||
Green | George Maxwell | 136 | 4.7 | ||
Liberal | Irene Morrison | 126 | 4.3 | ||
Majority | 2,012 | 69.4 | |||
Registered electors | 11,220 | ||||
Turnout | 2,910 | 25.9 | |||
Rejected ballots | 11 | 0.4 | |||
Labour hold | Swing |
Party | Candidate | Votes | % | ± | |
---|---|---|---|---|---|
Labour | Paul Kenyon | 1,931 | 83.6 | ||
Green | Paul Woodruff | 139 | 6.0 | ||
Liberal Democrat | Alex Cottrell | 88 | 3.8 | ||
Conservative | Johnathan Andrew | 76 | 3.3 | ||
Independent | Adam Heatherington | 55 | 2.4 | New | |
Liberal | Colin Edwards | 21 | 0.9 | New | |
Majority | 1,792 | 77.6 | |||
Registered electors | 10,002 | ||||
Turnout | 2,322 | 23.2 | |||
Rejected ballots | 12 | 0.5 | |||
Labour hold | Swing |
Party | Candidate | Votes | % | ± | |
---|---|---|---|---|---|
Labour | Anna Rothery | 2,155 | 78.8 | ||
Green | Stephanie Pitchers | 347 | 12.7 | ||
Liberal Democrat | Tom Sebire | 122 | 4.5 | ||
Conservative | Beryl Pinnington | 111 | 4.1 | ||
Majority | 1,808 | 66.1 | |||
Registered electors | 10,715 | ||||
Turnout | 2,753 | 25.7 | |||
Rejected ballots | 18 | 0.7 | |||
Labour hold | Swing |
Party | Candidate | Votes | % | ± | |
---|---|---|---|---|---|
Labour | Hetty Wood | 2,601 | 79.5 | ||
Green | Rebecca Lawson | 297 | 9.1 | ||
Conservative | Robin Singleton | 194 | 5.9 | ||
Liberal Democrat | Anna McCracken | 181 | 5.5 | ||
Majority | 2,304 | 70.4 | |||
Registered electors | 14,170 | ||||
Turnout | 3,286 | 23.2 | |||
Rejected ballots | 13 | 0.4 | |||
Labour hold | Swing |
Party | Candidate | Votes | % | ± | |
---|---|---|---|---|---|
Green | Tom Crone | 2,205 | 58.3 | ||
Labour | Stuart Fordham | 1,395 | 36.9 | ||
Conservative | David Patmore | 99 | 2.6 | ||
Liberal Democrat | Norman Darbyshire | 82 | 2.2 | ||
Majority | 810 | 21.4 | |||
Registered electors | 9,810 | ||||
Turnout | 3,789 | 38.6 | |||
Rejected ballots | 8 | 0.2 | |||
Green hold | Swing |
Party | Candidate | Votes | % | ± | |
---|---|---|---|---|---|
Labour | Doreen Knight | 2,634 | 82.8 | ||
Green | Rachael Stretton | 184 | 5.8 | ||
Liberal Democrat | Alan Tormey | 184 | 5.8 | ||
Conservative | James Craig | 178 | 5.6 | ||
Majority | 2,450 | 77.0 | |||
Registered electors | 13,792 | ||||
Turnout | 3,189 | 23.1 | |||
Rejected ballots | 9 | 0.3 | |||
Labour hold | Swing |
Party | Candidate | Votes | % | ± | |
---|---|---|---|---|---|
Liberal | William Lake | 2,524 | 64.0 | ||
Labour | Don Porter | 1,283 | 32.6 | ||
Liberal Democrat | Pat Moloney | 50 | 1.3 | ||
Green | Martin Dobson | 47 | 1.2 | ||
Conservative | Elliot Craddock | 37 | 0.9 | ||
Majority | 1,241 | 31.4 | |||
Registered electors | 10,390 | ||||
Turnout | 3,948 | 38.0 | |||
Rejected ballots | 7 | 0.2 | |||
Liberal hold | Swing |
Party | Candidate | Votes | % | ± | |
---|---|---|---|---|---|
Labour | Cheryl Didsbury | 2,321 | 80.0 | ||
Liberal Democrat | Jerry Lonsdale | 228 | 7.9 | ||
Conservative | McLean Wickham | 190 | 6.5 | ||
Green | Jean Hill | 126 | 4.3 | ||
Liberal | George Roberts | 38 | 1.3 | ||
Majority | 2,093 | 72.1 | |||
Registered electors | 11,122 | ||||
Turnout | 2,916 | 26.2 | |||
Rejected ballots | 13 | 0.4 | |||
Labour hold | Swing |
Party | Candidate | Votes | % | ± | |
---|---|---|---|---|---|
Labour | Angela Coleman | 2,122 | 62.5 | ||
Liberal Democrat | Graham Hulme | 653 | 19.2 | ||
Green | David Morgan | 303 | 8.9 | ||
Conservative | Stuart Wood | 247 | 7.3 | ||
Liberal | Jonathan Mason | 72 | 2.1 | ||
Majority | 1,469 | 43.3 | |||
Registered electors | 10,510 | ||||
Turnout | 3,409 | 32.4 | |||
Rejected ballots | 12 | 0.4 | |||
Labour hold | Swing |
Party | Candidate | Votes | % | ± | |
---|---|---|---|---|---|
Labour | Pam Thomas | 2,243 | 69.9 | ||
Conservative | Pauline Shuttleworth | 278 | 8.7 | ||
Liberal | Ann Hines | 274 | 8.5 | ||
Liberal Democrat | Paul Parr | 260 | 8.1 | ||
Green | Ellie Pontin | 107 | 3.3 | ||
TUSC | Ann Barbara Walsh | 48 | 1.5 | New | |
Majority | 1,965 | 61.2 | |||
Registered electors | 10,958 | ||||
Turnout | 3,216 | 29.3 | |||
Rejected ballots | 6 | 0.2 | |||
Labour hold | Swing |
Party | Candidate | Votes | % | ± | |
---|---|---|---|---|---|
Liberal Democrat | Kris Brown | 2,148 | 50.5 | ||
Labour | Colin McAlley | 1,394 | 32.8 | ||
Conservative | Adam Marsden | 488 | 11.5 | ||
Green | Jennifer Brown | 226 | 5.3 | ||
Majority | 754 | 17.7 | |||
Registered electors | 10,636 | ||||
Turnout | 4,264 | 40.1 | |||
Rejected ballots | 8 | 0.2 | |||
Liberal Democrat gain from Labour | Swing | ||||
Party | Candidate | Votes | % | ± | |
---|---|---|---|---|---|
Labour | Tony Conception | 2,414 | 81.3 | ||
Conservative | Gillian Ferrigno | 244 | 8.2 | ||
Liberal Democrat | Jacqueline Wilson | 117 | 3.9 | ||
Liberal | Sam Hawksford | 100 | 3.4 | ||
Green | William Ward | 93 | 3.1 | ||
Majority | 2,170 | 73.1 | |||
Registered electors | 11,816 | ||||
Turnout | 2,975 | 25.2 | |||
Rejected ballots | 7 | 0.2 | |||
Labour hold | Swing |
• italics denote a sitting councillor • bold denotes the winning candidate
Liverpool Town Council existed from 1835 to 1880.
Liverpool City Council has existed since 1880, when Liverpool was awarded city status. Prior to this date the local authority was a town council.
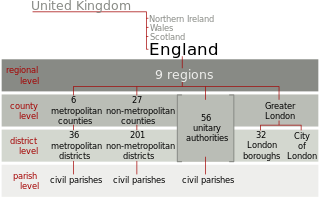
The history of local government in England is one of gradual change and evolution since the Middle Ages. England has never possessed a formal written constitution, with the result that modern administration is based on precedent, and is derived from administrative powers granted to older systems, such as that of the shires.
Kensington & Fairfield is a Liverpool City Council Ward in the Liverpool Wavertree Parliamentary constituency. The population of this ward taken at the 2011 census was 15,377. It contains the Kensington and Fairfield areas of Liverpool. It was formed for the 2004 municipal elections taking most of the former Kensington ward and small parts of the former Smithdown and Tuebrook wards.
Central is a Liverpool City Council Ward in the Liverpool Riverside Parliamentary constituency. The population at the 2011 census was 20,340. It was formed for the 2004 municipal elections from the former Abercromby, Everton and Smithdown wards. It contains the majority of the city centre but also includes Kensington Fields in Kensington to the east and the Marybone/Holy Cross community in Vauxhall. The ward includes the longstanding city centre community around the Bullring, as well as many new city centre apartments. Furthermore, the ward contains the Pier Head and the two larger universities; the University of Liverpool and Liverpool John Moores University.
Warbreck is a Liverpool City Council Ward in Liverpool, England. It contains the northern parts of the Walton and Orrell Park areas of Liverpool. The population of this ward taken at the 2011 census was 16,481. Its northern part also takes in the old rural district of Warbreck Moor together with the small residential area of Warbreck Park. There is also a "Warbreck" public house within the ward's boundaries situated on Orrell Lane.
Riverside is a Liverpool City Council Ward in the Liverpool Riverside Parliamentary constituency. It contains a part of Toxteth, the Dingle and the southern part of the city centre. The population of the ward taken at the 2011 census was 18,422.It was formed for the 2004 Municipal elections from the former Abercromby and Dingle wards.
The 2002 Halton Borough Council election took place on 2 May 2002 to elect members of Halton Unitary Council in Cheshire, England. One third of the council was up for election and the Labour party stayed in overall control of the council.
Wavertree is a Liverpool City Council Ward within the Liverpool Wavertree Parliamentary constituency. It was formed in 2004 taking in parts of the former Picton, Childwall and Church wards.
St. Michaels is a Liverpool City Council Ward within the Liverpool Riverside Parliamentary constituency. The population of this ward at the 2011 census was 12,991. It was formed for the 2004 Municipal elections from the former Aigburth and Dingle wards.
Everton is a Liverpool City Council Ward in the Liverpool Walton Parliamentary constituency. The ward boundary was changed in 2004 when the number of councillors was reduced.
The 2010 West Lancashire Borough Council election took place on 6 May 2010 to elect members of West Lancashire Borough Council in Lancashire, England. One third of the council was up for election and the Conservative party stayed in overall control of the council.
Wirral Metropolitan Borough Council, or simply Wirral Council, is the local authority of the Metropolitan Borough of Wirral in Merseyside, England. It is a metropolitan district council, one of five in Merseyside and one of 36 in the metropolitan counties of England, and provides the majority of local government services in Wirral. It is a constituent council of Liverpool City Region Combined Authority.
The 2016 Liverpool City Council election took place on 5 May 2016 to elect members of Liverpool City Council in England. This was on the same day as the election for the Elected Mayor of Liverpool and the Police and Crime Commissioner for Merseyside.
Birkenhead and Tranmere is a Wirral Metropolitan Borough Council ward in the Birkenhead Parliamentary constituency.
The 2018 Leeds City Council election took place on 3 May 2018 to elect members of Leeds City Council in England. They were held on the same day as other local elections across England and the rest of the UK.
The 2018 Wirral Metropolitan Borough Council election took place on 3 May 2018 to elect members of Wirral Metropolitan Borough Council in England. This election was held on the same day as other local elections.
The 2019 Wirral Metropolitan Borough Council election is due to take place on 2 May 2019 to elect members of Wirral Metropolitan Borough Council in England. This will be on the same day as other local elections.
Pensby and Thingwall is a Wirral Metropolitan Borough Council Ward in the Wirral West Parliamentary constituency.
The 2019 Liverpool City Council election is due to take place on 2 May 2019 to elect members of Liverpool City Council in England. This will be on the same day as other local elections.