South Down (Assembly constituency)

Last updated

South Down
Northern Ireland Assembly
Parliamentary constituency
SouthDownConstituency.svg
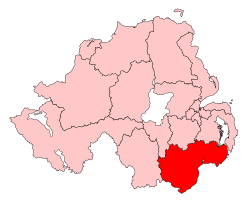
South Down shown within Northern Ireland
Current constituency
Created 1973
Seats6 (1996–2016)
5 (2017–)
MLAs
  •   Sinéad Ennis (SF)
  •   Diane Forsythe (DUP)
  •   Cathy Mason (SF)
  •   Colin McGrath (SDLP)
  •   Andrew McMurray (APNI)
Districts Newry, Mourne and Down District Council and small portion of ABC council
Boundaries South Down (Assembly constituency)

South Down is an electoral constituency for the Northern Ireland Assembly. It lies in the southern portion of County Down.

Contents

The seat was first used for a Northern Ireland-only election for the Northern Ireland Assembly in 1973. It usually shares the same boundaries as the South Down UK Parliament constituency, however the boundaries of the two constituencies were slightly different from 1983 to 1986 as the Assembly boundaries had not caught up with Parliamentary boundary changes and from 1996 to 1997 when members of the Northern Ireland Forum had been elected from the newly drawn Parliamentary constituencies but the 51st Parliament of the United Kingdom, elected in 1992 under the 1983–95 constituency boundaries, was still in session.

Members were then elected from the constituency to the 1975 Constitutional Convention, the 1982 Assembly, the 1996 Forum and then to the current Assembly from 1998.

Some of the most high-profile MLAs for the constituency have included Caitríona Ruane, Margaret Ritchie, and John McCallister.

For further details on the history and boundaries of the constituency, see South Down (UK Parliament constituency).

Members

ElectionMLA
(party)
MLA
(party)
MLA
(party)
MLA
(party)
MLA
(party)
MLA
(party)
MLA
(party)
1973 Patrick O'Donoghue
(SDLP)
Eddie McGrady
(SDLP)
Frank Feely
(SDLP)
Brian Faulkner
(UUP/UPNI)
Herbert Heslip
(UUP)
Ronald Broadhurst
(UUP)
Cecil Harvey
(Vanguard)
1975 Peter Brush
(UUP)
1982 Raymond McCullough
(UUP)
William Brown
(UUP)
Jim Wells
(DUP)
George Graham
(DUP)
1985
by-election
Jeffrey Donaldson
(UUP)
1996 Mick Murphy
(Sinn Féin)
Margaret Ritchie
(SDLP)
Hugh Carr
(SDLP)
Dermot Nesbitt
(UUP)
5 seats
1996–1998
1998 Eamon O'Neill
(SDLP)
P. J. Bradley
(SDLP)
Jim Wells
(DUP/Independent Unionist)
6 seats
1998–2017
2003 Caitríona Ruane
(Sinn Féin)
Willie Clarke
(Sinn Féin)
Margaret Ritchie
(SDLP)
2007 John McCallister
(UUP/Independent)
2011 Karen McKevitt
(SDLP)
April 2012
co-option
Chris Hazzard
(Sinn Féin)
Seán Rogers
(SDLP)
2016 Colin McGrath
(SDLP)
Sinéad Bradley
(SDLP)
Harold McKee
(UUP)
2017 Sinéad Ennis
(Sinn Féin)
5 seats
2017–present
5 seats
2017–present
June 2017
co-option
Emma Rogan
(Sinn Féin)
May 2018
defection
2022 Cathy Mason
(Sinn Féin)
Patrick Brown
(Alliance)
Diane Forsythe
(DUP)
April 2024
co-option
Andrew McMurray
(Alliance)

Note: The columns in this table are used only for presentational purposes, and no significance should be attached to the order of columns. For details of the order in which seats were won at each election, see the detailed results of that election.

Elections

Northern Ireland Assembly

2022

2022 Assembly election: South Down – 5 seats [1]
PartyCandidateFPv%Count
123456
Sinn Féin Sinéad Ennis 26.17%14,381     
Sinn Féin Cathy Mason 18.13%9,963     
Alliance Patrick Brown 12.63%6,9428,071 8,251 8,865 9,301 
DUP Diane Forsythe 11.82%6,4976,512 6,513 6,617 8,034 11,073
SDLP Colin McGrath 11.07%6,0827,748 8,164 8,798 8,933 9,119
SDLP Karen McKevitt 5.47%3,0064,772 4,875 5,090 5,139 5,259
TUV Harold McKee 5.96%3,2733,279 3,280 3,332 4,118  
UUP Jill Macauley 5.24%2,8802,900 2,902 2,944   
Aontú Rosemary McGlone2.14%1,1771,439 1,488    
Green (NI) Noeleen Lynch0.75%412564 580    
People Before Profit Paul McCrory0.37%205270 283    
Independent Patrick Clarke0.24%134209 224    
Electorate: 84,046  Valid: 54,952 (65.38%)  Spoilt: 679  Quota: 9,159  Turnout: 55,631 (66.19%)  

    2017

    2017 Assembly election: South Down – 5 seats [2]
    PartyCandidateFPv%Count
    1234567
    Sinn Féin Sinéad Ennis 20.76%10,256      
    Sinn Féin Chris Hazzard 17.87%8,827      
    SDLP Sinéad Bradley 14.82%7,3237,487 8,906.12    
    DUP Jim Wells 15.76%7,7868,088 8,091.36 8,091.64 10,821.64  
    SDLP Colin McGrath 10.34%5,1105,202 5,512.8 6,043.68 6,632.42 7,228.42 7,613.62
    Alliance Patrick Brown 9.18%4,5354,883 5,101.64 5,194.88 6,007.82 6,730.82 6,874.66
    UUP Harold McKee 8.45%4,1724,509 4,522.44 4,527.76    
    TUV Lyle Rea1.28%630      
    Green (NI) Hannah George0.98%483      
    Independent Patrick Clarke0.39%192      
    NI Conservatives Gary Hynds0.17%85      
    Electorate: 75,415  Valid: 49,399 (65.50%)  Spoilt: 535  Quota: 8,234  Turnout: 49,932 (66.21%)  

      2016

      2016 Assembly election: South Down – 6 seats [3]
      PartyCandidateFPv%Count
      12345678
      DUP Jim Wells 12.25%5,0335,183 6,470     
      UUP Harold McKee 8.47%3,4813,812 5,168 5,567 6,141   
      Sinn Féin Chris Hazzard 12.28%5,0455,142 5,144 5,321 5,321.5 7,277.5  
      SDLP Sinéad Bradley 12.32%5,0595,231 5,241 5,828 5,834 6,144  
      Sinn Féin Caitríona Ruane 10.20%4,1914,240 4,244 4,335 4,335 5,415 6,664.5 
      SDLP Colin McGrath 10.44%4,2884,429 4,440 5,033 5,038 5,121 5,190 5,397
      SDLP Seán Rogers 8.68%3,5643,699 3,721 4,076 4,086.5 4,227.5 4,309 4,595.75
      Sinn Féin Michael Gray-Sloan8.57%3,5203,571 3,572 3,665 3,665    
      Alliance Patrick Brown 5.36%2,2002,841 2,869      
      TUV Henry Reilly 6.62%2,7182,800       
      Independent John McCallister 2.81%1,156       
      Green (NI) John Hardy2.00%820       
      Electorate: 77,409  Valid: 41,075 (53.06%)  Spoilt: 570  Quota: 5,868  Turnout: 41,645 (53.80%)  

        2011

        2011 Assembly election: South Down – 6 seats [4]
        PartyCandidateFPv%Count
        123456789
        SDLP Margaret Ritchie 20.61%8,506        
        Sinn Féin Caitríona Ruane 14.43%5,9556,192.15       
        DUP Jim Wells 12.60%5,2005,284.84 5,354.56 5,404.28 6,543.28    
        UUP John McCallister 10.68%4,4094,480.92 4,624.88 4,714.77 5,679.9 6,329.6   
        Sinn Féin Willie Clarke 9.40%3,8823,957.95 3,992.5 4,094.15 4,101.46 4,103.2 6,777.2  
        SDLP Karen McKevitt 9.10%3,7584,318.79 4,432.71 4,675.33 4,702.43 4,707.27 4,842.93 5,277.28 5,347.46
        SDLP Eamon O'Neill 6.38%2,6633,844.72 3,959.19 4,222.77 4,251.35 4,259.47 4,449.46 4,826.14 4,882.98
        Sinn Féin Naomi Bailie7.39%3,0503,150.44 3,161.06 3,305.46 3,306.77 3,308.51    
        UKIP Henry Reilly 5.63%2,3322,353.29 2,373.7 2,398.94      
        Green (NI) Cadogan Enright2.68%1,1071,227.28 1,238.75       
        Alliance David Griffin2.09%864915.15        
        Electorate: 73,240  Valid: 41,726 (56.97%)  Spoilt: 825  Quota: 5,961  Turnout: 42,551 (58.10%)  

          2007

          2007 Assembly election: South Down – 6 seats [5]
          PartyCandidateFPv%Count
          1234567891011
          Sinn Féin Caitríona Ruane 13.74%6,3346,336 6,337 6,337 6,428 6,450 6,676    
          Sinn Féin Willie Clarke 11.14%5,1385,145 5,152 5,154 5,259 5,273 5,412 7,382   
          SDLP Margaret Ritchie 12.66%5,8385,870 5,887 5,892 6,026 6,055 6,429 6,945   
          SDLP P. J. Bradley 12.26%5,6525,662 5,682 5,684 5,772 5,829 6,190 6,286 6,650.32  
          DUP Jim Wells 12.02%5,5425,546 5,605 5,763 5,792 6,188 6,240 6,248 6,250.97 8,462.97 
          UUP John McCallister 9.64%4,4474,448 4,553 4,637 4,819 5,230 5,370 5,377 5,384.92 6,046.91 7,720.91
          SDLP Michael Carr6.45%2,9722,976 2,986 2,989 3,062 3,093 3,354 3,422 3,830.87 3,853.87 3,882.87
          DUP William Burns5.66%2,6112,613 2,667 2,721 2,741 3,040 3,061 3,062 3,064.97   
          Sinn Féin Eamonn McConvey5.77%2,6622,678 2,679 2,679 2,703 2,703 2,778     
          Green (NI) Ciaran Mussen3.52%1,6221,646 1,675 1,685 2,008 2,043      
          UKIP Henry Reilly 2.67%1,2291,229 1,239 1,326 1,354       
          Alliance David Griffin1.50%691700 743 755        
          Ind. Republican Martin Cunningham0.94%434441 448 448        
          UK Unionist Frederick Wharton0.92%424424 443         
          NI Conservatives Peter Bowles0.85%391391          
          Labour Party NI Malachi Curran 0.27%123          
          Electorate: 71,704  Valid: 46,110 (64.31%)  Spoilt: 513  Quota: 6,588  Turnout: 46,623 (65.02%)  

            2003

            2003 Assembly election: South Down – 6 seats [6]
            PartyCandidateFPv%Count
            123456789
            DUP Jim Wells 14.97%6,789        
            SDLP P. J. Bradley 11.77%5,3375,337.36 5,355.36 5,682.96 7,136.96    
            UUP Dermot Nesbitt 11.84%5,3685,411 5,420 5,759.04 5,797.2 5,802.72 5,822.72 8,325.72 
            Sinn Féin Caitríona Ruane 11.29%5,1185,118 5,124 5,211.08 5,415.08 5,450.04 6,024.42 6,026.54 6,035.54
            Sinn Féin Willie Clarke 9.00%4,0834,083.08 4,092.08 4,185.16 4,268.2 4,278.78 5,920.74 5,926.44 5,934.44
            SDLP Margaret Ritchie 9.40%4,2614,261.76 4,313.76 4,665.32 4,848.36 4,921.5 5,419.96 5,477.96 5,733.96
            SDLP Eamon O'Neill 8.69%3,9423,942.92 3,963.92 4,220.24 4,692.32 5,215.34 5,350.34 5,411.52 5,697.52
            UUP Jim Donaldson6.36%2,8852,984.52 2,989.52 3,254.96 3,264.12 3,265.96 3,269.42   
            Sinn Féin Eamonn McConvey6.19%2,8062,806.12 2,833.12 2,961.16 2,986.16 2,990.3    
            SDLP Marion Fitzpatrick5.25%2,3822,382.44 2,409.44 2,555.64      
            Green (NI) Raymond Blaney1.76%799799.76 851.76       
            NI Women's Coalition Trudy Miller1.25%565565.6 589.6       
            Alliance Neil Powell1.08%489489.48 495.48       
            UK Unionist Nelson Wharton0.54%245360.64 362.72       
            Independent Malachi Curran 0.36%162162.08        
            Workers' Party Des O'Hagan 0.25%115115.08        
            Electorate: 70,149  Valid: 45,346 (64.64%)  Spoilt: 666  Quota: 6,479  Turnout: 46,012 (65.59%)  

              1998

              1998 Assembly election: South Down – 6 seats [7]
              PartyCandidateFPv%Count
              1234567891011
              SDLP Eddie McGrady 20.20%10,373          
              Sinn Féin Mick Murphy 12.17%6,2516,418.33 6,514.51 6,517.51 6,574.08 7,761.08     
              UUP Dermot Nesbitt 10.67%5,4805,507.84 5,524.03 5,788.9 6,133.54 6,137.99 6,137.99 7,770.99   
              SDLP P. J. Bradley 10.85%5,5716,218.28 6,313.44 6,317.31 6,485.16 6,563.4 6,665.52 6,716.39 6,739.49 7,390.23 
              DUP Jim Wells 9.40%4,8264,830.06 4,840.35 5,261.35 5,270.35 5,272.35 5,273.27 5,631.85 5,792.85 5,849.34 8,170.34
              SDLP Eamon O'Neill 6.98%3,5824,752.73 4,889.94 4,892.52 5,006.57 5,144.92 5,289.36 5,323.39 5,342.29 6,120.06 6,163.2
              SDLP Hugh Carr 7.27%3,7314,132.36 4,230.24 4,232.24 4,379.71 4,438.47 4,501.03 4,517.9 4,528.4 5,114.14 5,186.72
              UK Unionist Frederick Wharton5.02%2,5762,577.16 2,581.16 2,886.45 2,904.74 2,905.74 2,906.20 3,125.36 3,271.66 3,313.71  
              NI Women's Coalition Anne Carr3.23%1,6581,811.41 2,000.03 2,009.32 2,563.74 2,675.11 2,785.05 2,890.12 2,955.57   
              UUP Norman Hanna3.78%1,9391,946.83 1,962.28 2,481.15 2,642.73 2,646.73 2,647.65     
              Sinn Féin Garret O'Fachtna2.96%1,5201,603.81 1,697.41 1,697.7 1,716.73       
              Alliance Anne-Marie Cunningham2.92%1,5021,586.39 1,675.63 1,697.5        
              Ind. Unionist George Graham 3.04%1,5621,567.51 1,578.51         
              Labour Party NI Malachi Curran 0.97%498634.01          
              Workers' Party Des O'Hagan 0.25%130151.17          
              Independent Labour Patrick O'Connor0.24%121148.84          
              Natural Law Thomas Mullins0.06%3338.51          
              Electorate: 71,000  Valid: 51,353 (72.33%)  Spoilt: 989  Quota: 7,337  Turnout: 52,342 (73.72%)  

                1996 forum

                Successful candidates are shown in bold. [8]

                PartyCandidate(s)VotesPercentage
                SDLP Eddie McGrady
                Hugh Carr
                Margaret Ritchie
                Marietta Farrell
                John Doris
                20,22043.2
                UUP Dermot Nesbitt
                Frederick Wharton
                Gerry Douglas
                Albert Colmer
                William Martin
                10,37922.2
                Sinn Féin Mick Murphy
                Frank McDowell
                Martin Gough
                Deidre Clark
                6,14213.1
                DUP William Alexander
                John Finlay
                William Burns
                5,06010.8
                Alliance Julian Crozier
                Michael Healy
                1,6853.6
                Labour coalition Malachi Curran
                Patrick O'Connor
                Edna Furey
                James Masson
                Michael Kearney
                9272.0
                PUP George Graham
                James McDonald
                4971.1
                NI Women's Coalition Bronagh Lawson
                Claire Hannah
                Lynn Carvill
                Ursula Leahy
                4641.0
                Ulster Democratic Norma Coulter
                Denis Paisley
                4040.9
                Green (NI) Maggie Burch
                Eugene O'Shea
                Christopher Busby
                2510.6
                NI Conservatives Paul Megarity
                Michael Henderson
                1970.4
                Workers' Party Marie O'Hagan
                Eddie O'Hagan
                1620.4
                Ulster Independence Samuel Pollock
                Stanley Watson
                James McElrath
                1300.3
                Democratic Partnership William Leneghan
                Sean O'Baoill
                1170.2
                Democratic Left Veronica McEneaney
                Jim Ryan
                650.1
                Natural Law Desmond Garrett
                William McCarthy
                300.1
                Independent Chambers George Chambers
                Doreen Larmour
                180.0

                1985 by-election [9]

                17 October 1985 by-election: South Down – 1 seat
                PartyCandidateFPv%Count
                1
                UUP Jeffrey Donaldson 86.1%17,528
                Ind. Unionist Ethel Smyth13.9%2,838
                Electorate: 98,126  Valid: 20,366  Spoilt: 486  Quota: 10,184  Turnout: 20,366 (21.3%)  

                  1982

                  1982 Assembly election: South Down – 7 seats [10]
                  PartyCandidateFPv%Count
                  1234567891011
                  SDLP Frank Feely 12.52%7,391          
                  SDLP Eddie McGrady 12.38%7,3137,636         
                  UUP William Brown 8.84%5,2205,227 5,234 5,441 5,441 7,593     
                  SDLP Patrick O'Donoghue 10.02%5,9166,252 6,440 6,449 6,449 6,455 8,181    
                  UUP Raymond McCullough 9.82%5,8025,808 5,809 5,903 5,903 6,451 6,458 6,471 6,497.28 9,553.28 
                  DUP George Graham 6.90%4,0754,081 4,082 5,366 5,336 5,533 5,543 5,548 5,552.14 6,518.35 7,596.35
                  DUP Jim Wells 6.40%3,7793,783 3,783 5,361 5,361 5,474 5,488 5,503 5,505.16 5,662.54 5,936.54
                  Alliance Patrick Forde6.17%3,6463,999 4,027 4,047 4,047 4,148 4,346 4,707 4,708.53 4,878.11 5,101.11
                  UUP William Coulter6.41%3,7873,794 3,795 3,828 3,828 4,490 4,497 4,508 4,664.96   
                  Sinn Féin Cyril Toman 5.75%3,3933,772 3,795 3,805 3,805 3,806      
                  UUP William Martin6.03%3,5623,567 3,568 3,798 3,798       
                  DUP Ethel Smyth5.92%3,4953,507 3,508         
                  Workers' Party Thomas Moore2.84%1,676          
                  Electorate: 93,261  Valid: 59,055 (63.32%)  Spoilt: 2,137  Quota: 7,382  Turnout: 61,192 (65.61%)  

                    1975 Constitutional Convention

                    1975 Constitutional Convention: South Down – 7 seats [11]
                    PartyCandidateFPv%Count
                    123456789
                    SDLP Frank Feely 16.02%9,730        
                    Vanguard Cecil Harvey 14.56%8,843        
                    SDLP Eddie McGrady 11.95%7,2578,560.28       
                    SDLP Patrick O'Donoghue 10.96%6,6577,335.26 7,336.52 8,231.08     
                    Unionist Party NI Brian Faulkner 9.94%6,0356,048.2 6,075.78 6,078.5 6,114.34 6,127.14 6,608.72 6,687.12 8,512.12
                    UUP Peter Brush 10.36%6,2936,294.32 6,520.56 6,520.46 6,520.46 6,520.56 6,813.24 6,891.16 6,995
                    UUP Herbert Heslip 10.50%6,3806,384.84 6,643.7 6,643.86 6,644.5 6,645.72 6,726.26 6,736.72 6,838.18
                    DUP David Herron6.18%3,7523,757.28 4,464 4,464.16 4,464.16 4,465.16 4,536.28 4,552.50 4,624.66
                    Alliance Anthony Williamson2.65%1,6121,659.96 1,660.24 1,676.08 1,882.8 1,931.02 1,937.46 2,136.46  
                    Alliance Denys Rowan-Hamilton2.48%1,5091,518.02 1,520.82 1,529.46 1,678.42 1,714.02 1,757.02 1,950.58  
                    Republican Clubs Raymond Blaney1.65%1,0021,018.5 1,018.64 1,022.16 1,056.72 1,672.28 1,673.5   
                    Unionist Party NI Ronald Broadhurst 1.64%994995.1 1,001.96 1,002.44 1,007.08 1,007.08    
                    Republican Clubs Gerard O'Hanlon1.12%680706.18 706.18 721.38 843.3     
                    Electorate: 89,912  Valid: 60,744 (67.56%)  Spoilt: 2,129  Quota: 7,594  Turnout: 62,873 (69.93%)  

                      1973

                      1973 Assembly election: South Down – 7 seats [12]
                      PartyCandidateFPv%Count
                      1234567891011121314151617
                      UUP Brian Faulkner 25.43%16,287                
                      SDLP Eddie McGrady 12.29%7,8707,894.99 7,913.50 7,926.5 7,927.5 7,972.01 8,050.01          
                      UUP Ronald Broadhurst 2.37%1,5156,049.41 6,075.02 6,075.02 6,266.74 6,268.25 6,270.27 6,273.78 6,344.42 6,370.62 6,374.13 9,108.64     
                      SDLP Frank Feely 10.71%6,8576,869.24 6,895.75 6,929.75 6,931.75 6,949.75 7,055.75 7,344.75 7,352.75 7,422.77 7,759.77 7,761.28 7,762.3 9,190.3   
                      SDLP Patrick O'Donoghue 6.75%4,3224,327.1 4,343.1 4,346.1 4,347.1 4,406.1 4,507.61 4,608.61 4,630.14 4,745.65 5,709.65 5,711.65 5,712.67 7,180.69 8,225.69  
                      Vanguard Cecil Harvey 7.82%5,0065,435.42 5,442.42 5,445.42 5,672.17 5,672.17 5,678.68 5,682.68 5,689.23 5,689.23 5,691.23 5,931.58 6,095.29 6,099.29 6,102.29 6,105.59 9,485.59
                      UUP Herbert Heslip 5.99%3,8384,709.08 4,715.61 4,715.61 4,758.81 4,760.81 4,765.81 4,768.83 4,776.87 4,779.89 4,780.89 5,360.47 5,960.23 5,967.27 5,969.27 5,971.25 7,177.36
                      Alliance Anthony Williamson2.33%1,4891,519.09 1,543.09 1,546.09 1,548.09 1,550.09 1,590.09 1,598.09 2,283.3 4,155.98 4,261.49 4,296.77 4,398.26 4,664.77 4,711.77 4,923.63 4,954.5
                      DUP David Herron6.27%4,0164,327.61 4,332.12 4,332.12 4,453.81 4,453.81 4,461.81 4,464.81 4,471.32 4,471.83 4,473.83 4,666.69 4,811.02 4,816.02 4,818.02 4,819.34  
                      Ind. Nationalist Rory McShane4.35%2,7852,790.1 2,799.61 2,827.61 2,827.61 2,881.61 2,979.61 3,312.12 3,325.63 3,340.14 4,059.14 4,061.14 4,061.14     
                      UUP William Martin3.12%1,9963,760.6 3,766.11 3,766.11 3,810.74 3,812.74 3,817.27 3,820.82 3,851.08 3,865.12 3,865.12       
                      Ind. Nationalist James O'Reilly 3.12%2,0002,001.02 2,008.02 2,016.02 2,018.02 2,092.02 2,268.53 2,397.53 2,405.04 2,447.04        
                      Alliance Michael O'Shea2.30%1,4751,503.05 1,557.09 1,558.09 1,561.09 1,565.09 1,588.6 1,605.6 2,209.04         
                      Alliance Denys Rowan-Hamilton2.06%1,3161,428.2 1,464.26 1,465.26 1,467.77 1,468.77 1,480.28 1,483.28          
                      Republican Clubs Noel Collins1.01%648652.08 652.08 959.08 965.08 1,378.08 1,402.1           
                      Ind. Nationalist Arthur Doran1.02%653658.1 678.61 686.63 696.14 705.14            
                      Republican Clubs Edward O'Hagan0.96%612613.02 614.02 695.02 695.53             
                      National Front William Annett0.92%591668.52 672.52 672.52              
                      Republican Clubs Samuel Dowling0.78%499499 502.02               
                      Ulster Liberal Berkley Farr0.41%263279.32                
                      Electorate: 89,234  Valid: 64,038 (71.76%)  Spoilt: 1,359  Quota: 8,005  Turnout: 65,397 (73.29%)  

                        References

                        1. "Statement of Persons Nominated – South Down" . Retrieved 8 April 2022.
                        2. "NI Assembly Election 2017". EONI. Retrieved 22 August 2021.
                        3. "NI Assembly Election 2016". EONI. Retrieved 22 August 2021.
                        4. "NI Assembly Election 2011" (PDF). EONI. Retrieved 21 August 2021.
                        5. "NI Assembly Election 2007". EONI. Retrieved 22 August 2021.
                        6. "NI Assembly Election 2003". EONI. Retrieved 22 August 2021.
                        7. "NI Assembly Election 1998". EONI. Retrieved 22 August 2021.
                        8. 1996 Candidates – South Down, Northern Ireland Elections
                        9. Morton, Robin (18 October 1985). "Easy election victory for OUP candidate". Belfast Telegraph. p. 34.
                        10. "NI Assembly Election 1982". EONI. Retrieved 22 August 2021.
                        11. "NI Convention Election 1975". EONI. Retrieved 22 August 2021.
                        12. "NI Assembly Election 1973". EONI. Retrieved 22 August 2021.

                        54°14′39″N5°57′03″W / 54.24417°N 5.95083°W / 54.24417; -5.95083