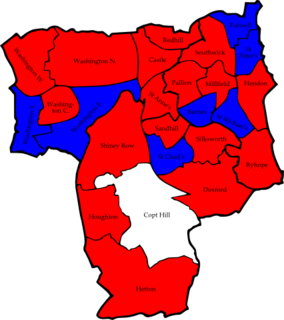
The 2002 Sunderland Council election took place on 2 May 2002 to elect members of Sunderland Metropolitan Borough Council in Tyne and Wear, England. One third of the council was up for election and the Labour party stayed in overall control of the council. [1]
The City of Sunderland is a local government district of Tyne and Wear, in North East England, with the status of a city and metropolitan borough. It is named after its largest settlement, Sunderland, but covers a far larger area which includes the towns of Hetton-le-Hole, Houghton-le-Spring, and Washington, as well as a range of suburban villages.
Tyne and Wear ( ) is a metropolitan county in the North East region of England around the mouths of the rivers Tyne and Wear. It came into existence in 1974 after the passage of the Local Government Act 1972. It consists of the five metropolitan boroughs of South Tyneside, North Tyneside, City of Newcastle upon Tyne, Gateshead and City of Sunderland. It is bounded on the east by the North Sea, and has borders with Northumberland to the north and County Durham to the south.
England is a country that is part of the United Kingdom. It shares land borders with Wales to the west and Scotland to the north-northwest. The Irish Sea lies west of England and the Celtic Sea lies to the southwest. England is separated from continental Europe by the North Sea to the east and the English Channel to the south. The country covers five-eighths of the island of Great Britain, which lies in the North Atlantic, and includes over 100 smaller islands, such as the Isles of Scilly and the Isle of Wight.
After the election, the composition of the council was
The Labour Party is a centre-left political party in the United Kingdom which has been described as an alliance of social democrats, democratic socialists and trade unionists. The party's platform emphasises greater state intervention, social justice and strengthening workers' rights. Labour is a full member of the Party of European Socialists and Progressive Alliance, and holds observer status in the Socialist International. As of 2017, the party was considered the "largest party in Western Europe" in terms of party membership, with more than half a million members.
The Conservative Party, officially the Conservative and Unionist Party, is a centre-right political party in the United Kingdom. Presently led by Theresa May, it has been the governing party since 2010. It presently has 314 Members of Parliament in the House of Commons, 249 members of the House of Lords, and 18 members of the European Parliament. It also has 31 Members of the Scottish Parliament, 12 members of the Welsh Assembly, eight members of the London Assembly and 9,008 local councillors. One of the major parties of UK politics, it has formed the government on 45 occasions, more than any other party.
The Liberal Democrats are a liberal, centrist political party in the United Kingdom. They presently have 11 Members of Parliament in the House of Commons, 96 members of the House of Lords, and one member of the European Parliament. They also have five Members of the Scottish Parliament and a member each in the Welsh Assembly and London Assembly. The party reached the height of its influence in the early 2010s, forming a junior partner in a coalition government from 2010 to 2015. It is presently led by Vince Cable.
66 candidates contested the 25 seats that were available in the election. [3] The election was said to be the "first time in recent memory" that every seat that was up for election was contested. [3] Candidates included 6 from the British National Party and an independent, former Conservative group leader Ron Smith, in Pallion ward. [3]
The British National Party (BNP) is a far-right, fascist political party in the United Kingdom. It is headquartered in Wigton, Cumbria, and its current leader is Adam Walker. A minor party, it has no elected representatives at any level of UK government. Founded in 1982, the party reached its greatest level of success in the 2000s, when it had over fifty seats in local government, one seat on the London Assembly, and two Members of the European Parliament.
Pallion is a suburb, civil parish and electoral ward in North West Sunderland, in Tyne and Wear, England. Most of the buildings in the area were built during the Victorian Era and consist of large terraced houses built for wealthy shipbuilders, but also smaller one-storey cottages in other areas for local shipyard workers.
Postal voting in the election was up on the 2001 general election with 9,770 postal votes returned by 1 May, an increase of 3,500 on the general election. [4]
Postal voting is voting in an election whereby ballot papers are distributed to electors or returned by post, in contrast to electors voting in person at a polling station or electronically via an electronic voting system. Historically, postal votes must be distributed and placed in return mail before the scheduled election day, it is sometimes referred to as a form of early voting. It can also be used as an absentee ballot. However, in recent times the model in the US has morphed, in municipalities that use postal voting exclusively, to be one of ballots being mailed out to voters, but the return method taking on alternatives of return by mail or dropping off the ballot in person via secure drop boxes and/or voting centers.
The results saw Labour easily holding control of the council after losing just 1 seat in the election. [5] The only change came in St Peter's ward with the Conservatives gaining the seat from Labour. [6] Meanwhile, none of the British National Party candidates managed to win a seat, [7] but the party did come second in 2 wards, Town End Farm and Southwick. [6] The results meant Labour held 62 seats after the election, compared to 11 for the Conservatives. [8]
Southwick is a former village and now a suburb on the north banks of the River Wear in the city of Sunderland in the county of Tyne and Wear, historically in County Durham.
Following the election the Labour leader of the council for the previous 3 years, Colin Anderson, was defeated in a leadership election by Bob Symonds. [9]
Party | Seats | Gains | Losses | Net gain/loss | Seats % | Votes % | Votes | +/− | |
---|---|---|---|---|---|---|---|---|---|
Labour | 21 | 0 | 1 | -1 | 84.0 | 56.9 | 27,882 | ||
Conservative | 3 | 1 | 0 | +1 | 12.0 | 31.9 | 15,629 | ||
Liberal Democrat | 1 | 0 | 0 | 0 | 4.0 | 7.9 | 3,852 | ||
BNP | 0 | 0 | 0 | 0 | 0 | 3.1 | 1,537 | ||
Independent | 0 | 0 | 0 | 0 | 0 | 0.2 | 121 |
Party | Candidate | Votes | % | ± | |
---|---|---|---|---|---|
Labour | Thomas Foster | 1,248 | 86.2 | ||
Conservative | Gwennyth Gibson | 199 | 13.8 | ||
Majority | 1,049 | 72.5 | |||
Turnout | 1,447 | ||||
Labour hold | Swing |
Party | Candidate | Votes | % | ± | |
---|---|---|---|---|---|
Labour | James Hollern | 949 | 59.3 | ||
Liberal Democrat | John Jackson | 337 | 21.1 | ||
Conservative | Dorreen Storey | 314 | 19.6 | ||
Majority | 612 | 38.3 | |||
Turnout | 1,600 | ||||
Labour hold | Swing |
Party | Candidate | Votes | % | ± | |
---|---|---|---|---|---|
Labour | Maureen Ambrose | 1,070 | 62.2 | ||
Conservative | John Brown | 651 | 37.8 | ||
Majority | 419 | 24.3 | |||
Turnout | 1,721 | ||||
Labour hold | Swing |
Party | Candidate | Votes | % | ± | |
---|---|---|---|---|---|
Labour | Elizabeth Bell | 1,239 | 67.0 | ||
Conservative | David Wilson | 611 | 33.0 | ||
Majority | 628 | 33.9 | |||
Turnout | 1,850 | ||||
Labour hold | Swing |
Party | Candidate | Votes | % | ± | |
---|---|---|---|---|---|
Conservative | Norman Bohill | 1,863 | 66.5 | ||
Labour | Gary Hollern | 609 | 21.7 | ||
Liberal Democrat | Amie Leung | 181 | 6.5 | ||
BNP | Joseph Dobbie | 148 | 5.3 | ||
Majority | 1,254 | 44.8 | |||
Turnout | 2,801 | ||||
Conservative hold | Swing |
Party | Candidate | Votes | % | ± | |
---|---|---|---|---|---|
Labour | James Scott | 902 | 67.0 | ||
Conservative | David Francis | 445 | 33.0 | ||
Majority | 457 | 33.9 | |||
Turnout | 1,347 | ||||
Labour hold | Swing |
Party | Candidate | Votes | % | ± | |
---|---|---|---|---|---|
Labour | Thomas Martin | 1,092 | 45.0 | ||
Conservative | Kathryn Chamberlin | 992 | 40.9 | ||
BNP | David Guynan | 340 | 14.0 | ||
Majority | 100 | 4.1 | |||
Turnout | 2,424 | ||||
Labour hold | Swing |
Party | Candidate | Votes | % | ± | |
---|---|---|---|---|---|
Labour | Richard Tate | 1,186 | 75.1 | ||
Conservative | Olwyn Bird | 394 | 24.9 | ||
Majority | 792 | 50.1 | |||
Turnout | 1,580 | ||||
Labour hold | Swing |
Party | Candidate | Votes | % | ± | |
---|---|---|---|---|---|
Labour | Joseph Lawson | 1,341 | 80.3 | ||
Conservative | Gordon Newton | 330 | 19.7 | ||
Majority | 1,011 | 60.5 | |||
Turnout | 1,671 | ||||
Labour hold | Swing |
Party | Candidate | Votes | % | ± | |
---|---|---|---|---|---|
Labour | Brian Dodds | 1,148 | 44.4 | ||
Conservative | Stephen Daughton | 1,032 | 39.9 | ||
Liberal Democrat | Elizabeth Foreman | 286 | 11.1 | ||
Independent | Ronald Smith | 121 | 4.7 | ||
Majority | 116 | 4.5 | |||
Turnout | 2,587 | ||||
Labour hold | Swing |
Party | Candidate | Votes | % | ± | |
---|---|---|---|---|---|
Labour | David Wares | 1,451 | 69.8 | ||
Conservative | William Dunn | 628 | 30.2 | ||
Majority | 823 | 39.6 | |||
Turnout | 2,079 | ||||
Labour hold | Swing |
Party | Candidate | Votes | % | ± | |
---|---|---|---|---|---|
Labour | Leslie Scott | 1,433 | 58.2 | ||
Conservative | Alistair Newton | 1,030 | 41.8 | ||
Majority | 403 | 16.4 | |||
Turnout | 2,463 | ||||
Labour hold | Swing |
Party | Candidate | Votes | % | ± | |
---|---|---|---|---|---|
Conservative | Margaret Forbes | 1,923 | 66.9 | ||
Labour | Phillip Gibson | 950 | 33.1 | ||
Majority | 973 | 33.9 | |||
Turnout | 2,873 | ||||
Conservative hold | Swing |
Party | Candidate | Votes | % | ± | |
---|---|---|---|---|---|
Conservative | Michael Arnott | 1,047 | 39.4 | ||
Labour | Christine Shattock | 952 | 35.8 | ||
Liberal Democrat | John Lennox | 657 | 24.7 | ||
Majority | 95 | 3.6 | |||
Turnout | 2,656 | ||||
Conservative gain from Labour | Swing | ||||
Party | Candidate | Votes | % | ± | |
---|---|---|---|---|---|
Labour | Kathryn Rolph | 1,423 | 72.5 | ||
Conservative | Marjorie Matthews | 539 | 27.5 | ||
Majority | 884 | 45.1 | |||
Turnout | 1,962 | ||||
Labour hold | Swing |
Party | Candidate | Votes | % | ± | |
---|---|---|---|---|---|
Labour | Peter Gibson | 1,623 | 72.2 | ||
Conservative | Patricia Francis | 484 | 21.5 | ||
BNP | David Rogers | 141 | 6.3 | ||
Majority | 1,139 | 50.7 | |||
Turnout | 2,248 | ||||
Labour hold | Swing |
Party | Candidate | Votes | % | ± | |
---|---|---|---|---|---|
Labour | Thomas Wright | 898 | 68.4 | ||
Conservative | Michael Dixon | 415 | 31.6 | ||
Majority | 483 | 36.8 | |||
Turnout | 1,313 | ||||
Labour hold | Swing |
Party | Candidate | Votes | % | ± | |
---|---|---|---|---|---|
Labour | Paul Stewart | 933 | 62.9 | ||
BNP | Alan Brettwood | 292 | 19.7 | ||
Liberal Democrat | Jane Walters | 167 | 11.3 | ||
Conservative | Alice Mclaren | 92 | 6.2 | ||
Majority | 641 | 43.2 | |||
Turnout | 1,484 | ||||
Labour hold | Swing |
Party | Candidate | Votes | % | ± | |
---|---|---|---|---|---|
Labour | Robert Kirby | 1,011 | 67.1 | ||
Conservative | Paula Wilkinson | 260 | 17.3 | ||
BNP | Joseph Dobbie | 235 | 15.6 | ||
Majority | 751 | 49.9 | |||
Turnout | 1,506 | ||||
Labour hold | Swing |
Party | Candidate | Votes | % | ± | |
---|---|---|---|---|---|
Liberal Democrat | Mark Greenfield | 1,113 | 56.6 | ||
Labour | Leonard Lamb | 594 | 30.2 | ||
Conservative | Neville Chamberlin | 260 | 13.2 | ||
Majority | 519 | 26.4 | |||
Turnout | 1,967 | ||||
Liberal Democrat hold | Swing |
Party | Candidate | Votes | % | ± | |
---|---|---|---|---|---|
Labour | Richard Bell | 831 | 61.1 | ||
BNP | John Martin | 381 | 28.0 | ||
Conservative | Gillian Connor | 149 | 10.9 | ||
Majority | 450 | 33.1 | |||
Turnout | 1,361 | ||||
Labour hold | Swing |
Party | Candidate | Votes | % | ± | |
---|---|---|---|---|---|
Labour | Derek Sleightholme | 1,463 | 62.1 | ||
Conservative | Jacqueline Atkinson | 537 | 22.8 | ||
Liberal Democrat | Avril Kitching | 357 | 15.1 | ||
Majority | 926 | 39.3 | |||
Turnout | 2,357 | ||||
Labour hold | Swing |
Party | Candidate | Votes | % | ± | |
---|---|---|---|---|---|
Labour | James Walker | 1,136 | 79.5 | ||
Conservative | Kathleen Irvine | 293 | 20.5 | ||
Majority | 843 | 59.0 | |||
Turnout | 1,429 | ||||
Labour hold | Swing |
Party | Candidate | Votes | % | ± | |
---|---|---|---|---|---|
Labour | Peter Young | 1,325 | 49.8 | ||
Conservative | Lee Martin | 871 | 32.7 | ||
Liberal Democrat | Owen Dumpleton | 466 | 17.5 | ||
Majority | 454 | 17.1 | |||
Turnout | 2,662 | ||||
Labour hold | Swing |
Party | Candidate | Votes | % | ± | |
---|---|---|---|---|---|
Labour | William Stephenson | 1,075 | 65.8 | ||
Liberal Democrat | David Griffin | 288 | 17.6 | ||
Conservative | Justin Garrod | 270 | 16.5 | ||
Majority | 787 | 48.2 | |||
Turnout | 1,633 | ||||
Labour hold | Swing |
The 2002 Redditch Borough Council election of 2 May 2002 elected members of Redditch Borough Council in the West Midlands region, England. One third of the council stood for re-election and the Labour party lost overall control of the council to no overall control for the first time in many years.
The 2007 Thurrock Council election took place on 3 May 2007 to elect members of Thurrock Council in Essex, England. One third of the council was up for election and the Conservative party lost overall control of the council to no overall control.
Elections to Hartlepool Borough Council in the ceremonial county of County Durham in England were held on 4 May 2000. One third of the council was up for election and the Labour party lost overall control of the council to no overall control.
Elections to Hartlepool Borough Council in the ceremonial county of County Durham in England were held on 2 May 2002. One third of the council was up for election and the council stayed under no overall control. At the same time an election took place for a directly elected mayor, which was won by independent candidate Stuart Drummond.
Elections to Gateshead Council in Tyne and Wear, England were held on 2 May 2002. One third of the council was up for election and the Labour party kept overall control of the council.
The 2002 St Albans City and District Council election took place on 2 May 2002 to elect members of St Albans District Council in Hertfordshire, England. One third of the council was up for election and the council stayed under no overall control.
The 2002 South Tyneside Metropolitan Borough Council election took place on 2 May 2002 to elect members of South Tyneside Metropolitan Borough Council in Tyne and Wear, England. One third of the council was up for election and the Labour party kept overall control of the council.
The 2003 South Tyneside Metropolitan Borough Council election took place on 1 May 2003 to elect members of South Tyneside Metropolitan Borough Council in Tyne and Wear, England. One third of the council was up for election and the Labour party kept overall control of the council.
The 2006 Solihull Metropolitan Borough Council election took place on 4 May 2006 to elect members of Solihull Metropolitan Borough Council in the West Midlands, England. One third of the council was up for election and the Conservative party stayed in overall control of the council.
The 1999 Sunderland Council election took place on 6 May 1999 to elect members of Sunderland Metropolitan Borough Council in Tyne and Wear, England. One third of the council was up for election and the Labour party stayed in overall control of the council.
The 2000 Sunderland Council election took place on 4 May 2000 to elect members of Sunderland Metropolitan Borough Council in Tyne and Wear, England. One third of the council was up for election and the Labour party stayed in overall control of the council.
The 2003 Sunderland Council election took place on 1 May 2003 to elect members of Sunderland Metropolitan Borough Council in Tyne and Wear, England. One third of the council was up for election and the Labour party stayed in overall control of the council.
The 2004 Sunderland City Council election took place on 10 June 2004 to elect members of Sunderland City Council Council in Tyne and Wear, England. The whole council was up for election following boundary changes since the last election in 2003. The Labour party stayed in overall control of the council.
The 2006 Sunderland Council election took place on 4 May 2006 to elect members of Sunderland City Council in Tyne and Wear, England. One third of the Council was up for election and the Labour party stayed in overall control.
The 2007 Sunderland Council election took place on 3 May 2007 to elect members of Sunderland Metropolitan Borough Council in Tyne and Wear, England. One third of the council was up for election and the Labour party stayed in overall control of the council.
The 2008 Sunderland Council election took place on 1 May 2008 to elect members of Sunderland Metropolitan Borough Council in Tyne and Wear, England. One third of the council was up for election and the Labour party stayed in overall control of the council.
The 2010 Sunderland Council election took place on 6 May 2010 to elect members of Sunderland Metropolitan Borough Council in Tyne and Wear, England. One third of the council was up for election and the Labour party stayed in overall control of the council. The election took place on the same day as the 2010 General Election.
The 2002 Harrogate Council election took place on 2 May 2002 to elect members of Harrogate Borough Council in North Yorkshire, England. The whole council was up for election with boundary changes since the last election in 2000 reducing the number of seats by 5. The Liberal Democrats lost overall control of the council to no overall control.
The 2003 Sandwell Metropolitan Borough Council election took place on 1 May 2003 to elect members of Sandwell Metropolitan Borough Council in the West Midlands, England. One third of the council was up for election and the Labour party stayed in overall control of the council.
The 2011 Sunderland Council election took place on 5 May 2011 to elect members of Sunderland Metropolitan Borough Council in Tyne and Wear, England. One third of the council was up for election and the Labour party stayed in overall control of the council.
Preceded by Sunderland City Council election, 2000 | Sunderland City Council elections | Succeeded by Sunderland City Council election, 2003 |