The economy of the state of Indiana is reflected in its gross state product in 2017 of US$359 billion and per capita income of $44,165.[9] A high percentage of Indiana's income is from manufacturing.[10] Indiana has been the largest steel producing state in the U.S. since 1975, with the Calumet Region of northwest Indiana being the largest single steel producing area in the U.S., accounting for 27% of all U.S. steel production. Indiana is also the 2nd largest auto manufacturing state. Indiana's other manufactures include pharmaceuticals and medical devices, automobiles, electrical equipment, transportation equipment, chemical products, rubber, petroleum and coal products, and factory machinery.
Indiana's earliest economy revolved around trade with the Native American tribes in the northern and central parts of the state, which were connected by rivers to the Great Lakes, and ultimately the Atlantic Ocean. The state government established a trading monopoly with the tribes who became the primary purchasers of Indiana settler's goods. Although the basis was established in the Northwest Ordinance[11] and well known, economic growth was slow to begin in the state, primarily due to the inability to ship goods to market affordably. After the Mississippi River was opened to American traffic following the Louisiana Purchase, agricultural grew rapidly in the state, but was still hampered by the lack of internal transportation in the state.[12]
The Indiana General Assembly attempted to remedy the transportation system in the late 1810s, but was thwarted by the Panic of 1819 which caused the state's only two banks to collapse. A second attempt was launched in the early 1830s leading to the passage of the Mammoth Internal Improvement Act. This state-funded development of canals, railroads and roads statewide resulted in a large rise in land and produce values, but it too was thwarted by the Panic of 1837; although this spending bankrupted the state, the foundation it provided allowed Indiana to grow into one of the leading farming states by the 1850s.
The 1860s Indiana in the American Civil War rapidly completed the state's railroad system and accelerated the growth of industry. Building railroad cars and glass manufacturing became the state early leading industries, established primarily in the central parts of the state. Southern Indiana, however was adversely affected by the war and never regained its economic dominance in the state. Prior to the war, the largest cities were along the Ohio River and had a thriving trade with the south and large ship building centers that languished in the war. In most of the state, the war led to a rise in the value of farm produce and significantly raised the state's standards of living.[13]
The Indiana Gas Boom began in the 1880s and lasted through 1910, when large-scale drilling and production of natural gas took place in the Trenton Gas Field of east-central Indiana. The Ball Corporation moved its headquarters from New York to Muncie, Indiana and built a glass factory to take advantage of the cheap natural gas, and became an icon of Muncie.
Indiana rapidly became a manufacturing powerhouse in the first 20 years of the 20th Century, as steel, oil refining, automobiles, railroad rolling stock, and consumer and industrial appliance companies established themselves, taking advantage of Indiana's central location, cheap and plentiful land, and the lower costs associated with smaller industrial cities. Enormous integrated steel mills were built in cities like East Chicago and Gary along the shore of Lake Michigan, with smaller mills built in cities like Muncie and Indianapolis. Railroads crisscrossed the state, the most iconinc being the Monon Line.
Indiana, being a manufacturing and agricultural state, was utterly devastated by the Great Depression in the 1930s. Unemployment exceeded 25% at the depths of the Depression in early 1933, with many coal-mining southern counties seeing unemployment rates exceed 50%.[14] The Indiana Republican Party, which previously dominated the state and gave precedent to business interests, was destroyed in the elections of 1932, and the Indiana Democrats, led by newly elected governor Paul V. McNutt, swept to power and radically transformed the state, implementing public works projects and completely overhauling the state government. Trade unions gained new strength during the 1935 - 1945 period, and peaked at 41% in 1964. Unions would be a potent political force in Indiana through the 1990s, with a unionization rate of 20% as recently as 1990.[15]
However, Indiana's factories went into overdrive during World War II (1939-1945) to support the Allied and American war efforts. Full employment and prosperity returned. Indiana manufactured 4.5 percent of total United States military armaments produced during World War II, ranking eighth among the 48 states.
During the post-World War II boom from 1945 to 1973, Indiana's economy prospered and Indiana was ranked 20th out of 50 states plus Washington, D.C. in the late-1960s for personal income. However, Indiana's economy began to struggle after the recession of 1969-1970 as the manufacturing sector began to decline. Foreign competition, corporate mergers, automation, and new management strategies lead to downsizing, mass layoffs, diversification, and chronic unemployment. Cities such as Muncie, Anderson, Indianapolis, Kokomo, Gary, East Chicago, Hammond, Michigan City, Fort Wayne, South Bend, Elkhart, and Evansville all witnessed population declines and rising unemployment and poverty during the 1970s and 1980s. Northwest Indiana was hit especially by the steel crisis of 1974 - 1983.
Since the early-1990s, Indiana has diversified its economy away from heavy industry and towards service (such as banking, insurance, healthcare, education, financial services, information technology) and high-tech manufacturing. In 2016, 516,000 workers were employed in manufacturing, down from 696,000 in 2000 and nearly 750,000 in 1969, but up from 424,000 in 2009 at the depths of the Great Recession. Heavy industries such as oil, autos, and steel still comprise a significant portion of the states' GDP, but other industries such as electrical goods, medical equipment, and pharmaceuticals have grown recently as well. However, Indiana's wage growth has lagged behind other states, and Indiana has fallen from 20th in personal income during the 1960s to 39th in 2017.
This section is empty. You can help by adding to it. (August 2014)
Renewable
Hydro
Indiana has six hydroelectric dams. The Norway and Oakdale Dams near Monticello provide electrical power, recreation, and other benefits to local citizens. The Norway Dam created Lake Shafer and the Oakdale Dam created Lake Freeman. The Markland Dam, on the Ohio River, near Vevay, Indiana also produces electricity. The city of Wabash was the first electrically lighted city in the country.
Biofuels
Indiana is becoming a leading state in the production of biofuels, such as ethanol and biodiesel. Indiana now has 12 ethanol and 4 biodiesel plants located in the state.[16]Reynolds, located north of Lafayette is now known as BioTown, USA. The town is experimenting with using biofuels and organic fuels, such as those made with manure, to power the town.[17]
Commercial wind power in Indiana began in 2008 when the Benton County Wind Farm came online. New estimates of wind resources in 2006 raised the potential wind power capacity for Indiana from 30 MW at 50 m turbine hub height to 40,000 MW at 70 m, which could double at 100 m, the height of newer turbines.[19] At the end of June, 2008, Indiana had installed 130 MW of wind turbines and had under construction another 400 MW.[20]As of 31December2009[update], Indiana had a total of 1035.95 MW of wind power nameplate capacity installed,[21] with more under construction or in planning.[22]
Geothermal
As of March2008[update] Indiana has no geothermal electrical power generation facility. The Indiana Geological Survey was conducting a study to catalogue all potentially exploitable sources of geothermal heat in the state.[23]
In 2010, the Indiana Heating and Air-Conditioning Incentive Program (IHIP) provides rebates of up to $1000 for the purchase and installation of Energy Star-rated geothermal heat pumps.[24]
One of the largest geothermal heat pump systems in the United States is a GeoExchange pond coupled loop system by Geothermal Design Associates at the St. Joseph Medical Center in Fort Wayne.[25]
Agriculture
Indiana is the eighth largest agricultural exporter in the nation, exporting just over $4.6 billion in 2017. Indiana is the tenth largest farming state in the nation. Top 5 commodities (by value of sales)
Corn: $3.28 billion Soybeans: $3.08 billion Meat animals: $1.62 billion Poultry and eggs: $1.18 billion Dairy: $750 million
Pharmaceuticals & medical devices
Indiana is home to the international headquarters of pharmaceutical manufacturer Eli Lilly in Indianapolis, the state's largest corporation. Evansville is home to Mead Johnson Nutritionals, a subsidiary of Bristol-Myers Squibb, another large producer. Elkhart has also had a strong economic base of pharmaceuticals, though it has decreased over with the closure of Whitehall Laboratories in the 1990s and of the large Bayer complex, announced in late 2005.[26] Overall, Indiana ranks fifth among all U.S. states in total sales and shipments of pharmaceutical products and second highest in the number of biopharmaceutical related jobs.[27] Warsaw is dubbed the "Orthopedic Capital of the World"; the Warsaw region is home to nearly one-third of the $38 billion global orthopaedic industry [28] including Zimmer, Biomet and DePuy. Other medical device companies include Roche Diagnostics in Indianapolis, and Cook in Bloomington.
Automotive
In 2013, Indiana's automobile industry rose to 2nd place in the country, behind Michigan, in terms of automotive gross domestic product.[29]
Mining
In mining, Indiana is probably best known for its decorative limestone from the southern, hilly portion of the state, especially from Lawrence County. One of the many public buildings faced with this stone is The Pentagon, and after the September 11, 2001, attacks, a special effort was made by the mining industry of Indiana to replace those damaged walls with as nearly identical type and cut of material as the original facing.[30] There are also large coal mines in the southern portion of the state. Like most Great Lakes states, Indiana has small to medium operating petroleum fields; the principal location of these today is in Southwestern Indiana, though operational oil derricks can be seen on the outskirts of Terre Haute.
↑ Northwest Ordinance Art 4: "The navigable waters leading into the Mississippi and St. Lawrence, and the carrying places between the same, shall be common highways and forever free, as well to the inhabitants of the said territory as to the citizens of the United States, and those of any other States that may be admitted into the confederacy, without any tax, impost, or duty therefor."
The economy of Illinois is the fifth largest by GDP in the United States and one of the most diversified economies in the world. Fueled by the economy of Chicago, the Chicago metropolitan area is home to many of the United States' largest companies, including Abbott Laboratories, AbbVie Inc., Allstate, Baxter International, Conagra, Crate and Barrel, Kraft Heinz, McDonald's, CNH Industrial, GE Healthcare, Aon PLC, Willis Towers Watson, Mondelez International, Motorola, United Airlines, US Foods, Walgreens, and more. The Chicago area is a global financial center and headquarters a wide variety of financial institutions including Citadel LLC, CNA Financial, Discover Financial Services, Morningstar, Inc., Nuveen, and more. Chicago is also home to the largest futures exchange in the world, the Chicago Mercantile Exchange.
The economy of West Virginia nominally would be the 62nd largest economy globally behind Iraq and ahead of Croatia according to 2009 World Bank projections, and the 64th largest behind Iraq and ahead of Libya according to 2009 International Monetary Fund projections. The state has a projected nominal GDP of $63.34 billion in 2009 according to the Bureau of Economic Analysis report of November 2010, and a real GDP of $55.04 billion. The real GDP growth of the state in 2009 of .7% was the 7th best in the country. West Virginia's economy accelerated in 2014 with a growth rate of 5.1%, ranking third among the fastest growing states in the United States alongside Wyoming and just behind North Dakota and Texas. In 2021, the state GDP was $72.48 billion, an increase over $69.71 billion in 2021.
Northern Indiana is a region of the U.S. State of Indiana, including 26 counties which border the states of Illinois, Michigan, and Ohio. Northern Indiana is also considered part of the Great Lakes Megalopolis. The area is generally classified into other sub-regions; Northwest Indiana is closely tied with Chicago economically, culturally, and politically and is part of the Chicago metropolitan area. The north central region centers on South Bend metropolitan area, with economic connections to southwest Michigan. Northeast Indiana is centered on the Fort Wayne metropolitan area.
Tamil Nadu has the second largest state economy in India. It is also the most industrialised state in the country. The state is 48.40% urbanised, accounting for around 9.26% of the urban population in the country, while the state as a whole accounted for 5.96% of India's total population in the 2011 census. Services contributes to 54% to the gross domestic product of the state, followed by manufacturing at 33% and agriculture at 13%.
The economy of the State of New York is reflected in its gross state product in 2022 of $2.053 trillion, ranking third in size behind the larger states of California and Texas. If New York State were an independent nation, it would rank as the 10th largest economy in the world. However, in 2019, the multi-state, New York City-centered metropolitan statistical area produced a gross metropolitan product (GMP) of $US2.0 trillion, ranking first nationally by a wide margin and would also rank as the 10th largest GDP in the world.
Renewable energy commercialization involves the deployment of three generations of renewable energy technologies dating back more than 100 years. First-generation technologies, which are already mature and economically competitive, include biomass, hydroelectricity, geothermal power and heat. Second-generation technologies are market-ready and are being deployed at the present time; they include solar heating, photovoltaics, wind power, solar thermal power stations, and modern forms of bioenergy. Third-generation technologies require continued R&D efforts in order to make large contributions on a global scale and include advanced biomass gasification, hot-dry-rock geothermal power, and ocean energy. In 2019, nearly 75% of new installed electricity generation capacity used renewable energy and the International Energy Agency (IEA) has predicted that by 2025, renewable capacity will meet 35% of global power generation.
Iran has the fourth largest oil reserves and the 2nd largest natural gas reserves in the world. The nation is a member of OPEC, and generates approximately 50% of state revenue through oil exports.
Iceland is a world leader in renewable energy. 100% of Iceland's electricity grid is produced from renewable resources. In terms of total energy supply, 85% of the total primary energy supply in Iceland is derived from domestically produced renewable energy sources. Geothermal energy provided about 65% of primary energy in 2016, the share of hydropower was 20%, and the share of fossil fuels was 15%.
Geothermal energy was first used for electric power production in the United States in 1960. The Geysers in Sonoma and Lake counties, California was developed into the largest geothermal steam electrical plant in the world, at 1,517 megawatts. Other geothermal steam fields operate in the western US and Alaska.
According to data from the US Energy Information Administration, renewable energy accounted for about 13.1% of total primary energy consumption and about 21.5% of total utility-scale electricity generation in the United States in 2022.
China is the world's leader in electricity production from renewable energy sources, with over triple the generation of the second-ranking country, the United States. China's renewable energy sector is growing faster than its fossil fuels and nuclear power capacity, and is expected to contribute 43 per cent of global renewable capacity growth. China's total renewable energy capacity exceeded 1,000 GW in 2021, accounting for 43.5 per cent of the country's total power generation capacity, 10.2 percentage points higher than in 2015. The country aims to have 80 per cent of its total energy mix come from non-fossil fuel sources by 2060, and achieve a combined 1,200 GW of solar and wind capacity by 2030. In 2023, it was reported that China was on track to reach 1,371 gigawatts of wind and solar by 2025, five years ahead of target due to new renewables installations breaking records.
Making up over 62% of the state's generated electricity in 2022, wind power is the largest source of electricity generation in Iowa. In 2020, over 34 billion kWh of electrical energy was generated by wind power. As of 2022, Iowa has over 12,200 megawatts (MW) of installed capacity with over 6,000 wind turbines, ranking 2nd and 3rd in the nation below Texas respectively.
This article is intended to give an overview of the economy of Delaware.
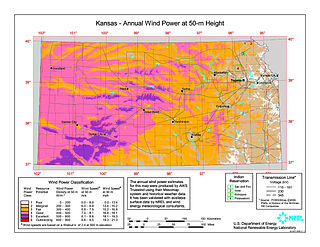
In the U.S. State of Kansas, wind power is the largest source of electricity, generating over 41% of the state's electricity in 2019. Kansas has a high potential capacity for wind power, second behind Texas. The most recent estimates (2012) are that Kansas has a potential for 952 GW of wind power capacity yet had only about 5.6 GW installed by year end 2018. Kansas could generate 3,102 TW·h of electricity each year, which represents over 75% of all the electricity generated in the United States in 2011. This electricity could be worth $290 billion per year.
The energy sector of Ohio consists of thousands of companies and cities representing the oil, natural gas, coal, solar, wind energy, fuel cell, biofuel, geothermal, hydroelectric, and other related industries. Oil and natural gas accounts for $3.1 billion annually in sales while ethanol generates $750 million. Toledo is a national hub in solar cell manufacturing, and the state has significant production of fuel cells. In 2008, the state led the country in alternative energy manufacturing according to Site Selection Magazine, while the natural gas industry has experienced growth due to the expansion of shale gas.
Renewable energy in Russia mainly consists of hydroelectric energy. Russia is rich not only in oil, gas and coal, but also in wind, hydro, geothermal, biomass and solar energy – the resources of renewable energy. Practically all regions have at least one or two forms of renewable energy that are commercially exploitable, while some regions are rich in all forms of renewable energy resources. However, fossil fuels dominate Russia’s current energy mix, while its abundant and diverse renewable energy resources play little role.
South Australia is a leader in utility-scale renewable energy generation, and also produces gas and uranium for electricity generation. Gas production is mostly concentrated in the Cooper Basin in the state's north-east. Gas is delivered from these fields by pipeline to users interstate and to Port Adelaide where it fuels three separate gas-fired power plants. Uranium is also mined in South Australia, though nuclear power generation is prohibited nationally. The Olympic Dam mine is the world's single largest known deposit of uranium and represents 30% of the world's total uranium resource. Many utility-scale wind farms and solar farms have been commissioned during the 21st century and geology with potential for geothermal energy has also been identified but is yet to be developed.
Solar power in Indiana has been growing in recent years due to new technological improvements and a variety of regulatory actions and financial incentives, particularly a 30% federal tax credit for any size project.
This page is based on this Wikipedia article Text is available under the CC BY-SA 4.0 license; additional terms may apply. Images, videos and audio are available under their respective licenses.