Shall Section 33, Article III of the Constitution of this State be amended by deleting the following sentence from the Constitution: 'The marriage of a white person with a Negro or mulatto, or person who shall have one-eighth or more of Negro blood, shall be unlawful and void'.
The interracial marriage ban clause in South Carolina's constitution dated back to 1895, when the document was rewritten "as part of a sometimes violent backlash against Reconstruction."[2] The 1895 constitution was written under Governor Ben Tillman, whose administration was run on the idea that control of the state government should be held by white people.[3]
In 1970 and 1972, following an opinion issued by AG Daniel McLeod in 1969 that the ban was unconstitutional, South Carolina repealed its statutory anti-miscegenation provisions. However, section 33 of article 3, the interracial marriage ban clause of South Carolina's constitution, still remained in place.[7][6][9] In 1998, at the time of repeal of the constitutional ban, South Carolina was the second-to-last state to have a defunct ban on interracial marriage; the final state to repeal its ban was Alabama in 2000.[10]
Legislation for Amendment 4
Bill 4303 from the 112th Session, 1997–1998 of the South Carolina General Assembly placed the question on the ballot. The bill was authored by State Rep. Brad Jordan; however, Jordan allowed for State Rep. Curtis Inabinett to be the bill's introducer and chief sponsor.[11][12][13] In the State House, the bill received 99 votes in favor, 4 votes against, and had 20 representatives not vote. The 4 opposition votes came from State Representatives John Graham Altman, Dan Cooper, Larry Koon, and Margaret Gamble.[14][12] In the State Senate, 45 votes were in favor, and none were in opposition.[15]
Fiscal estimates
Marci Andino, a member of the South Carolina Election Commission, estimated that the addition of the amendment to the ballot would cost between $25,000 and $30,000.[16]
Endorsements
Support
Supporters of the change had many arguments in favor, including religious stances,[12] that it was antiquated,[17] that it was racist,[12] that it limited individual freedom,[12] and that it fostered racial division.[18]
Those in opposition, such as state representative John Graham Altman, who was among the most outspoken opponents of the change,[28] argued that the change was political correctness.[28] Altman believed it to be wrong that the South Carolina legislature would attempt to repeal this provision but avoid removing other archaic clauses that had been ruled unconstitutional, such as women being denied the right to vote, and the requirement that a person be religious to be sworn into public office.[17] He felt that the ban should be left there "as a lesson for us never to do it again".[11]
The basis of other arguments in opposition included religion,[12] and that different animal species do not breed with each other.[12]
John Graham Altman, state representative from the 119th district (1997–2005) (Republican)[17]
Larry Koon, state representative from the 87th district (1975–2005) (Republican)[12]
Liston Barfield, state representative from the 58th district (1985–1989) (1997–2013) (Republican)[18]
Contents
The amendment, which took place along with the 1998 South Carolina elections on November 3, 1998,[29] had the following question and explanation shown to voters for Amendment 4:[29]
"Shall Section 33, Article III of the Constitution of this State be amended by deleting the following sentence from the Constitution: 'The marriage of a white person with a Negro or mulatto, or person who shall have one-eighth or more of Negro blood, shall be unlawful and void'.
Yes []
No []
Those voting in favor of the question shall deposit a ballot with a check or cross mark in the square after the word 'Yes', and those voting against the question shall deposit a ballot with a check or cross mark in the square after the word 'No'."
Explanation of above: This amendment, if approved, will remove the part of the Constitution that makes marriage between whites and blacks illegal.[b]
40 counties voted in favor of the measure, and 6 voted against. The highest level of support came from Beaufort County, which had 75.34% vote in favor, and the lowest level came from Cherokee County, which had 44.70% in favor.[29]
The following table details the results by county of the referendum:[29]
The Herald, days after the election took place, released an opinion section reaffirming its previously declared support for the measure, and described the fact that more than one-third of the state opposed it as "a black eye for the state."[33]
The Sun News also released an editorial after the amendment vote had occurred, saying that their concern lay with the fact that six counties had voted against the measure. The newspaper went on to say, "The times, they are a'changing, but not fast enough."[34] And, in February 1999, they released another paper following ratification of the amendment, declaring that the ban had been repealed, "And that is as it should be." The newspaper reasoned that it was a "Jim Crow part of the constitution" and "rightfully [was] expunged." It felt that South Carolina changed "all too slowly in things it needs to change quickly. But at least it is changing."[35]
Turnout
The level of voter turnout in the November 1998 election in South Carolina was 54%, or about 1.1 million registered voters.[29] This was viewed as encouraging for the South Carolina Election Commission, as this gave South Carolina the 29th highest voter turnout in this election, after years of the state having the lowest, or close to it, levels of turnout.[29]
Formalization
The amendment required a subsequent vote by the legislature in order to be ratified; Bill 332 of the 113th Session, which took effect on February 16, 1999, provided the needed ratification.[36] This officially removed the state's marriage ban, which had been legally unenforceable for over 31 years due to the Supreme Court's decision in Loving v. Virginia.[37]
Race of voters
An estimated 40% of white voters opposed the ballot measure, while about 23% of non-white voters were against it.[38][4] Based on the percentage of participants by race in the 1998 general election, all six counties that opposed the amendment had a majority-white percentage of people who voted.[39] Data gathered in the 2000 census shows that all six counties that opposed the amendment had a majority-white population in total.[40]
The three counties that backed the measure with more than 70% support—Beaufort, Charleston, and Richland—all had majority-white populations as well.[39][40] However, all three counties had histories involving African Americans. For example, in Beaufort, African Americans "dominate[d]" the political scene during Reconstruction;[41] in Charleston, they formed a majority of the population until the Great Migration;[42] and in Richland, according to one researcher, more public memorials for Black women exist than in any other county of the United States.[43]
Other interracial marriage referendums
Results by county of the three referendums, including the year when it occurred at the top of each state.
In comparison to South Carolina's vote, the two states had a higher percentage of county-level opposition, with 44 of the 82 Mississippi counties in opposition (53.66%) and 25 of Alabama's 67 (37.31%), while only 6 of South Carolina's 46 (13.04%) were opposed.[44][45][29]
When categorized by race, estimates show that ~49% of white Alabama voters opposed removing their state's ban compared to South Carolina's ~40%. Among non-white voters, ~8% in Alabama opposed repeal, while in South Carolina, ~23% were against.[4]
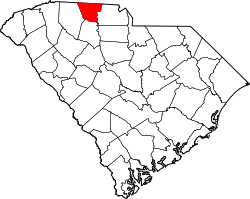
A map depicting Cherokee County, South Carolina, which voted against both gay and interracial marriage by the highest margins of any county in the state.
In 2011, the polling firm Public Policy Polling released a survey of 741 South Carolina voters, including the question: "Do you think interracial marriage should be legal or illegal?" The poll, which was conducted between June 2 and June 5 of that year with a +/-3.6% margin of error, found that 70% believed it should be legal, 16% believed it should be illegal, and 15% were unsure.[48]
In 2012, the same organization, PPP, released a survey containing, this time, only "likely Republican primary voters". The poll was conducted from January 11 to 13 on 803 of such individuals, and had a +/-3.5% margin of error. 66% were in favor of it being legal, 20% were opposed, and 14% were unsure.[49]
The following cross tabs are some of those that were provided:[e]
Cross tabs of the 2012 South Carolina Republicans[49]
↑Speizer, Jayne; Sovde, Roger; Plumb, Terry C.; Rassmann, Richard R.; Werrell Jr., James (November 5, 1998). "Controversial amendments". The Herald. Retrieved November 23, 2025– via Newspapers.com.
↑Ellis, Paula; Deans, Sue; Ausband, Jerry; Willis, Bill (November 11, 1998). "Catching up?". The Sun News. Retrieved November 23, 2025– via Newspapers.com.
↑Herman, Melissa R.; Campbell, Mary E. (March 2012). "I wouldn't, but you can: Attitudes toward interracial relationships". Social Science Research. 41 (2): 343–358. doi:10.1016/j.ssresearch.2011.11.007. PMID23017756.
This page is based on this Wikipedia article Text is available under the CC BY-SA 4.0 license; additional terms may apply. Images, videos and audio are available under their respective licenses.