East Hampshire District Council election, 2003

Last updated

Map of the results of the 2003 East Hampshire council election. Conservatives in blue and Liberal Democrats in yellow. East Hampshire UK local election 2003 map.svg
Map of the results of the 2003 East Hampshire council election. Conservatives in blue and Liberal Democrats in yellow.

The 2003 East Hampshire District Council election took place on 1 May 2003 to elect members of East Hampshire District Council in Hampshire England. The whole council was up for election with boundary changes since the last election in 1999 increasing the number of seats by 2. [1] The Conservative party stayed in overall control of the council. [2]

East Hampshire Non-metropolitan district in England

East Hampshire is a local government district in Hampshire, England. Its council is based in Petersfield. Other towns are Alton and Bordon.

Non-metropolitan district Type of local government district in England

Non-metropolitan districts, or colloquially "shire districts", are a type of local government district in England. As created, they are sub-divisions of non-metropolitan counties in a two-tier arrangement.

Hampshire County of England

Hampshire is a county on the southern coast of England. The county town, with city status, is Winchester, a frequent seat of the Royal Court before any fixed capital, in late Anglo-Saxon England. After the metropolitan counties and Greater London, Hampshire is the most populous ceremonial county in the United Kingdom. Its two largest settlements, Southampton and Portsmouth, are administered separately as unitary authorities and the rest of the area forms the administrative county, which is governed by Hampshire County Council.

Contents

Election result

East Hampshire Local Election Result 2003 [3] [2]
PartySeatsGainsLossesNet gain/lossSeats %Votes %Votes+/−
  Conservative 26 +4 59.1 53.5 18,866
  Liberal Democrat 18 +1 40.9 41.0 14,450
  Labour 0 0 0 4.4 1,537
  Independent 0 -3 0 0.8 273
  Green 0 0 0 0.3 114

3 Conservative and 1 Liberal Democrat candidates were unooposed at the election. [3]

Liberal Democrats (UK) Political party in the United Kingdom

The Liberal Democrats are a liberal political party in the United Kingdom. They presently have 11 Members of Parliament in the House of Commons, 96 members of the House of Lords, and one member of the European Parliament. They also have five Members of the Scottish Parliament and a member each in the Welsh Assembly and London Assembly. The party reached the height of its influence in the early 2010s, forming a junior partner in a coalition government from 2010 to 2015. It is presently led by Vince Cable.

Ward results

Alton Amery [3]
PartyCandidateVotes%±
Liberal Democrat Anthony Ludlow 333 56.6
Conservative Camilla Boreham 161 27.4
Labour Roger Godber 94 16.0
Majority 172 29.3
Turnout 588 31.1
Alton Ashdell [3]
PartyCandidateVotes%±
Conservative Robert Chilton 351 52.9
Liberal Democrat James McKell 312 47.1
Majority 39 5.9
Turnout 663 38.0
Alton Eastbrooke [3]
PartyCandidateVotes%±
Liberal Democrat Pamela Bradford 289 58.4
Conservative Christopher Butler 122 24.6
Labour Janice Treacher 84 17.0
Majority 167 33.7
Turnout 495 24.4
Alton Westbrooke [3]
PartyCandidateVotes%±
Liberal Democrat Robert Booker 449 70.2
Conservative Michael Baker 191 29.8
Majority 258 40.3
Turnout 640 30.5
Alton Whitedown [3]
PartyCandidateVotes%±
Liberal Democrat Allan Chick 397 50.9
Conservative Charles Glasgow 383 49.1
Majority 14 1.8
Turnout 780 41.6
Alton Wooteys [3]
PartyCandidateVotes%±
Liberal Democrat Jeremy Janes 257 52.9
Conservative Christopher Jones 121 24.9
Labour Barbara Burfoot 108 22.2
Majority 136 28.0
Turnout 486 27.1
Binstead and Bentley [3]
PartyCandidateVotes%±
Conservative Brian Dickinson unopposed
Bramshott and Liphook (3) [3]
PartyCandidateVotes%±
Conservative Anna James 1,130
Conservative Simon James 1,110
Conservative Evelyn Hope 1,017
Liberal Democrat Patricia Clarke 594
Liberal Democrat James Walters 587
Liberal Democrat Mary Walters 492
Labour Peter Dare 197
Independent Frederick Dawkins 141
Turnout 5,268 28.1
Clanfield and Finchdean (2) [3]
PartyCandidateVotes%±
Liberal Democrat Elizabeth Murray 700 34.9
Liberal Democrat Peter Rodgers 700 34.9
Conservative Kenneth Moon 605 30.2
Turnout 2,005 31.9
Downland [3]
PartyCandidateVotes%±
Conservative Patrick Burridge 532 71.5
Liberal Democrat Atul Patel 212 28.5
Majority 320 43.0
Turnout 744 40.1
East Meon [3]
PartyCandidateVotes%±
Conservative Marjorie Day unopposed
Four Marks and Medstead (2) [3]
PartyCandidateVotes%±
Conservative Maurice Johnson 1,013
Conservative Patricia Seward 962
Liberal Democrat Brian Timms 952
Liberal Democrat David Harrison 749
Labour Peter Treacher 129
Turnout 3,805 45.0
Froxfield and Steep [3]
PartyCandidateVotes%±
Conservative Jennifer Gray 503 63.8
Liberal Democrat Albert Perry 285 36.2
Majority 218 27.7
Turnout 788 41.2
Grayshott [3]
PartyCandidateVotes%±
Conservative Ferris Cowper 647 85.0
Green Clive Albone 114 15.0
Majority 533 70.0
Turnout 761 39.5
Headley (2) [3]
PartyCandidateVotes%±
Conservative Geoffrey Whittle 992
Conservative Anthony Williams 970
Liberal Democrat Sheila Drury 342
Liberal Democrat Moira Watkinson 292
Labour Mark Walsh 133
Turnout 2,729 31.0
Holybourne and Froyle [3]
PartyCandidateVotes%±
Conservative David O'Donnell 511 54.9
Liberal Democrat Robert Saunders 211 22.7
Independent Brian Nonhebel 132 14.2
Labour Donald Hammond 76 8.2
Majority 300 32.3
Turnout 930 41.8
Horndean Catherington & Lovedean [3]
PartyCandidateVotes%±
Conservative Sara Schillemore 356 57.3
Liberal Democrat Alan Ramsay 265 42.7
Majority 91 14.7
Turnout 621 33.6
Horndean Downs [3]
PartyCandidateVotes%±
Liberal Democrat Thomas Costello 454 66.9
Conservative John Munro 225 33.1
Majority 229 33.7
Turnout 679 34.5
Horndean Hazleton & Blendworth [3]
PartyCandidateVotes%±
Conservative Dorothy Denston 432 73.6
Liberal Democrat Elaine Woodard 155 26.4
Majority 277 47.2
Turnout 587 29.9
Horndean Kings [3]
PartyCandidateVotes%±
Liberal Democrat Kenneth Graham unopposed
Horndean Murray [3]
PartyCandidateVotes%±
Liberal Democrat Michael Ashton 345 67.6
Conservative Hilary Munro 165 32.4
Majority 180 35.3
Turnout 510 27.0
Lindford [3]
PartyCandidateVotes%±
Conservative Yvonne Parker Smith 349 68.2
Liberal Democrat Anthony Muldoon 163 31.8
Majority 186 36.3
Turnout 512 29.3
Liss (2) [3]
PartyCandidateVotes%±
Conservative Elizabeth Cartwright 1,114
Conservative David Onslow 802
Liberal Democrat Roger Mullenger 644
Labour Howard Linsley 284
Turnout 2,844 38.0
Petersfield Bell Hill [3]
PartyCandidateVotes%±
Conservative Guy Stacpoole 250 44.4
Liberal Democrat Penelope Wright 210 37.3
Labour Alan Stephens 103 18.3
Majority 40 7.1
Turnout 563 31.7
Petersfield Causeway [3]
PartyCandidateVotes%±
Liberal Democrat Anne Claxton 342 50.0
Conservative Kerry Dedman 272 39.8
Labour William Organ 70 10.2
Majority 70 10.2
Turnout 684 37.1
Petersfield Heath [3]
PartyCandidateVotes%±
Conservative Brian Dutton 346 55.6
Liberal Democrat Phillip Humphries 276 44.4
Majority 70 11.3
Turnout 622 36.9
Petersfield Rother [3]
PartyCandidateVotes%±
Conservative Robert Ayer 539 62.3
Liberal Democrat Karen Bradbury 235 27.2
Labour Maureen Stephens 91 10.5
Majority 304 35.1
Turnout 865 48.1
Petersfield St. Marys [3]
PartyCandidateVotes%±
Conservative Andrew Pattie 500 74.9
Labour Christine Straw 168 25.1
Majority 332 49.7
Turnout 668 43.0
Petersfield St. Peters [3]
PartyCandidateVotes%±
Conservative Hilary Ayer 373 64.8
Liberal Democrat David Jamieson 203 35.2
Majority 170 29.5
Turnout 576 32.2
Rowlands Castle [3]
PartyCandidateVotes%±
Liberal Democrat David Clegg 544 63.4
Conservative William Johnston 314 36.6
Majority 230 26.8
Turnout 858 41.6
Ropley and Tisted [3]
PartyCandidateVotes%±
Liberal Democrat Christopher Graham 506 51.4
Conservative Andrew Brown 479 48.6
Majority 27 2.7
Turnout 985 58.6
Selborne [3]
PartyCandidateVotes%±
Conservative Warwick Womack 418 52.1
Liberal Democrat Pelham Ravenscroft 385 47.9
Majority 33 4.1
Turnout 803 45.6
The Hangers and Forest [3]
PartyCandidateVotes%±
Conservative Judy Onslow unopposed
Whitehill Chase [3]
PartyCandidateVotes%±
Liberal Democrat Zoya Faddy 317 75.8
Conservative Joseph Davies 101 24.2
Majority 216 51.7
Turnout 418 22.9
Whitehill Deadwater [3]
PartyCandidateVotes%±
Liberal Democrat Helen Walters 247 61.0
Conservative Michael Cartwright 158 39.0
Majority 89 22.0
Turnout 405 20.4
Whitehill Hogmoor [3]
PartyCandidateVotes%±
Liberal Democrat William Watkinson 349 72.9
Conservative Valerie Ferns 130 27.1
Majority 219 45.7
Turnout 479 27.5
Whitehill Pinewood [3]
PartyCandidateVotes%±
Liberal Democrat Donald Mayes 153 59.8
Conservative Philip Cochrane 103 40.2
Majority 50 19.5
Turnout 256 13.7
Whitehill Walldown [3]
PartyCandidateVotes%±
Liberal Democrat Adam Carew 504 80.9
Conservative Barry Hope 119 19.1
Majority 385 61.8
Turnout 623 36.0

Related Research Articles

Rushmoor Borough & Non-metropolitan district in England

Rushmoor is a local government district and borough in Hampshire, England. It covers the towns of Aldershot and Farnborough.

City of Winchester Place in England

The City of Winchester is a local government district in Hampshire, England, with city status.

Chichester District Council in West Sussex, England is elected every four years. Since the last boundary changes in 2003, 48 councillors have been elected from 29 wards.

East Hampshire District Council in Hampshire England is elected every four years. Since the last boundary changes in 2003, 44 councillors have been elected from 38 wards.

New Forest District Council in Hampshire, England is elected every four years.

The 2003 South Lakeland District Council election took place on 1 May 2003 to elect members of South Lakeland District Council in Cumbria, England. One third of the council was up for election and the council stayed under no overall control.

East Dorset District Council elections

East Dorset District Council in Dorset, England is elected every four years. Since the last boundary changes in 2015, 29 councillors have been elected from 16 wards.

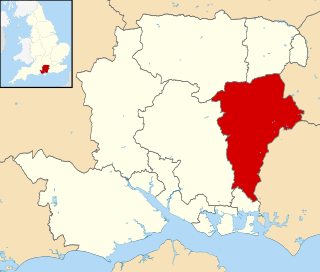
The 2003 Winchester Council election took place on 1 May 2003 to elect members of Winchester District Council in Hampshire, England. One third of the council was up for election and the Liberal Democrats stayed in overall control of the council.

2007 Winchester City Council election

The 2007 Winchester Council election took place on 3 May 2007 to elect members of Winchester District Council in Hampshire, England. One third of the council was up for election and the Conservative party stayed in overall control of the council.

The 2002 Hart Council election took place on 2 May 2002 to elect members of Hart District Council in Hampshire, England. The whole council was up for election with boundary changes since the last election in 2000. The Conservative party gained overall control of the council from no overall control.

The 2003 Hart Council election took place on 1 May 2003 to elect members of Hart District Council in Hampshire, England. One third of the council was up for election and the Conservative party stayed in overall control of the council.

The 2004 Hart Council election took place on 10 June 2004 to elect members of Hart District Council in Hampshire, England. One third of the council was up for election and the Conservative party stayed in overall control of the council.

2003 Southampton City Council election

The 2003 Southampton Council election took place on 1 May 2003 to elect members of Southampton Unitary Council in Hampshire, England. One third of the council was up for election and the council stayed under no overall control.

The 1999 East Hampshire District Council election took place on 6 May 1999 to elect members of East Hampshire District Council in Hampshire England. The whole council was up for election and the Conservative party gained overall control of the council from the Liberal Democrats.

2007 East Hampshire District Council election

The 2007 East Hampshire District Council election took place on 3 May 2007 to elect members of East Hampshire District Council in Hampshire England. The whole council was up for election and the Conservative party stayed in overall control of the council.

2011 East Hampshire District Council election

The 2011 East Hampshire District Council election took place on 5 May 2011 to elect members of East Hampshire District Council in Hampshire England. The whole council was up for election and the Conservative party stayed in overall control of the council.

2003 Havant Borough Council election

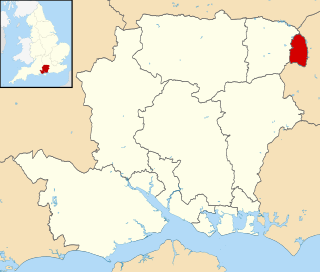
The 2003 Havant Borough Council election took place on 1 May 2003 to elect members of Havant Borough Council in Hampshire, England. One third of the council was up for election and the Conservative party stayed in overall control of the council.

2011 Torridge District Council election

The 2011 Torridge District Council election took place on 5 May 2011 to elect members of Torridge District Council in Devon, England. The whole council was up for election and the council stayed under no overall control.

2003 Rother District Council election

The 2003 Rother District Council election took place on 1 May 2003 to elect members of Rother District Council in East Sussex, England. The whole council was up for election after boundary changes reduced the number of seats by 7. The Conservative party stayed in overall control of the council.

2015 Rother District Council election

The 2015 Rother District Council election took place on 7 May 2015 to elect members of Rother District Council in East Sussex, England. The whole council was up for election and the Conservative party stayed in overall control of the council.

References