East Hampshire District Council election, 2007

Last updated

Map of the results of the 2007 East Hampshire council election. Conservatives in blue and Liberal Democrats in yellow. East Hampshire UK local election 2007 map.svg
Map of the results of the 2007 East Hampshire council election. Conservatives in blue and Liberal Democrats in yellow.

The 2007 East Hampshire District Council election took place on 3 May 2007 to elect members of East Hampshire District Council in Hampshire England. The whole council was up for election and the Conservative party stayed in overall control of the council. [1]

East Hampshire Non-metropolitan district in England

East Hampshire is a local government district in Hampshire, England. Its council is based in Petersfield. Other towns are Alton and Bordon.

Non-metropolitan district Type of local government district in England

Non-metropolitan districts, or colloquially "shire districts", are a type of local government district in England. As created, they are sub-divisions of non-metropolitan counties in a two-tier arrangement.

Hampshire County of England

Hampshire is a county on the southern coast of England. The county town, with city status, is Winchester, a frequent seat of the Royal Court before any fixed capital, in late Anglo-Saxon England. After the metropolitan counties and Greater London, Hampshire is the most populous ceremonial county in the United Kingdom. Its two largest settlements, Southampton and Portsmouth, are administered separately as unitary authorities and the rest of the area forms the administrative county, which is governed by Hampshire County Council.

Contents

Election result

East Hampshire Local Election Result 2007 [2] [1]
PartySeatsGainsLossesNet gain/lossSeats %Votes %Votes+/−
  Conservative 30 2 0 +2 68.2 60.6 23,667 +7.1%
  Liberal Democrat 14 0 2 -2 31.8 35.1 13,725 -5.9%
  Labour 0 0 0 0 0 3.7 1,433 -0.7%
  Independent 0 0 0 0 0 0.6 249 -0.2%

3 Conservative and 3 Liberal Democrat candidates were unopposed at the election. [3]

Liberal Democrats (UK) Political party in the United Kingdom

The Liberal Democrats are a liberal political party in the United Kingdom. They presently have 11 Members of Parliament in the House of Commons, 96 members of the House of Lords, and one member of the European Parliament. They also have five Members of the Scottish Parliament and a member each in the Welsh Assembly and London Assembly. The party reached the height of its influence in the early 2010s, forming a junior partner in a coalition government from 2010 to 2015. It is presently led by Vince Cable.

Ward results

Alton Amery [2]
PartyCandidateVotes%±
Liberal Democrat Tony Ludlow 357 57.4 +0.8
Conservative Glynis Watts 192 30.9 +3.5
Labour Peter Treacher 73 11.7 -4.3
Majority 165 26.5 -2.8
Turnout 622 33.1 +2.0
Liberal Democrat hold Swing
Alton Ashdell [2]
PartyCandidateVotes%±
Conservative Andrew Joy 489 61.1 +8.2
Liberal Democrat Robert Saunders 263 32.9 -14.2
Labour Barbara Burfoot 48 6.0 +6.0
Majority 226 28.3 +22.4
Turnout 800 43.3 +5.3
Conservative hold Swing
Alton Eastbrooke [2]
PartyCandidateVotes%±
Liberal Democrat Pamela Bradford 275 53.7 -4.7
Conservative Chris Butler 182 35.5 +10.9
Labour Janice Treacher 55 10.7 -6.3
Majority 93 18.2 -15.5
Turnout 512 24.7 +0.3
Liberal Democrat hold Swing
Alton Westbrooke [2]
PartyCandidateVotes%±
Liberal Democrat John Smith 438 60.9 -9.3
Conservative Jacqueline Saunders 281 39.1 +9.3
Majority 157 21.8 -18.5
Turnout 719 33.9 +3.4
Liberal Democrat hold Swing
Alton Whitedown [2]
PartyCandidateVotes%±
Liberal Democrat Allan Chick 517 54.1 +3.2
Conservative Barry Hope 386 40.4 -8.7
Labour Roger Godber 52 5.4 +5.4
Majority 131 13.7 +11.9
Turnout 955 42.7 +1.1
Liberal Democrat hold Swing
Alton Wooteys [3]
PartyCandidateVotes%±
Liberal Democrat Jerry Janes unopposed
Liberal Democrat hold Swing
Binstead and Bentley [2]
PartyCandidateVotes%±
Conservative Ken Carter 796 80.2
Liberal Democrat Jonathan Heard 196 19.8
Majority 600 60.5
Turnout 992 45.2
Conservative hold Swing
Bramshott and Liphook (3) [2]
PartyCandidateVotes%±
Conservative Anna James 1,230
Conservative Sam James 1,172
Conservative Evelyn Hope 1,146
Liberal Democrat Rob Evans 819
Liberal Democrat James Walters 771
Liberal Democrat David Raison 737
Labour Peter Dare 196
Labour John Tough 186
Turnout 6,257 34.3 +6.2
Conservative hold Swing
Clanfield and Finchdean (2) [2]
PartyCandidateVotes%±
Liberal Democrat Sam Payne 820
Conservative Ken Moon 782
Liberal Democrat Peters Rodgers 781
Conservative Dave Harvey 668
Turnout 3,051 41.6 +9.7
Liberal Democrat hold Swing
Conservative gain from Liberal Democrat Swing
Downland [2]
PartyCandidateVotes%±
Conservative Patrick Burridge 667 70.6 -0.9
Liberal Democrat Jimmy Patel 278 29.4 +0.9
Majority 389 41.2 -1.8
Turnout 945 49.8 +9.7
Conservative hold Swing
East Meon [3]
PartyCandidateVotes%±
Conservative David Parkinson unopposed
Conservative hold Swing
Four Marks and Medstead (2) [2]
PartyCandidateVotes%±
Conservative Patricia Seward 1,298
Conservative Maurice Johnson 1,287
Liberal Democrat John Hopkin 687
Liberal Democrat Jacky Powers 676
Turnout 3,948 48.0 +3.0
Conservative hold Swing
Froxfield and Steep [3]
PartyCandidateVotes%±
Conservative Jennifer Gray unopposed
Conservative hold Swing
Grayshott [2]
PartyCandidateVotes%±
Conservative Ferris Cowper 707 85.1 +0.1
Liberal Democrat Nicholas James 124 14.9 +14.9
Majority 583 70.2 +0.2
Turnout 831 43.0 +3.5
Conservative hold Swing
Headley (2) [2]
PartyCandidateVotes%±
Conservative Anthony Williams 1,094
Conservative Richard Millard 1,040
Liberal Democrat Richard Clifford 563
Liberal Democrat Gary Hopwood 493
Turnout 3,190 37.7 +6.7
Conservative hold Swing
Holybourne and Froyle [2]
PartyCandidateVotes%±
Conservative David O'Donnell 632 68.3 +13.4
Liberal Democrat Roger Fitzer 220 23.8 +1.1
Independent Brian Nonhebel 74 8.0 -6.2
Majority 412 44.5 +12.2
Turnout 926 43.2 +1.4
Conservative hold Swing
Horndean Catherington and Lovedean [2]
PartyCandidateVotes%±
Conservative Sara Schillemore 414 65.8 +8.5
Liberal Democrat Sarah McEwan 215 34.2 -8.5
Majority 199 31.6 +16.9
Turnout 629 33.1 -0.5
Conservative hold Swing
Horndean Downs [2]
PartyCandidateVotes%±
Conservative Julia Marshall 348 50.7 +17.6
Liberal Democrat Daphne Giddings 339 49.3 -17.6
Majority 9 1.3
Turnout 687 34.9 +0.4
Conservative gain from Liberal Democrat Swing
Horndean Hazleton & Blendworth [2]
PartyCandidateVotes%±
Conservative Dorothy Denston 536 75.6 +2.0
Liberal Democrat Ian Maiden 173 24.4 -2.0
Majority 363 51.2 +4.0
Turnout 709 36.4 +6.5
Conservative hold Swing
Horndean Kings [2]
PartyCandidateVotes%±
Liberal Democrat Ken Graham 511 62.2
Conservative William Gordon 310 37.8
Majority 201 24.5
Turnout 821 33.7
Liberal Democrat hold Swing
Horndean Murray [2]
PartyCandidateVotes%±
Liberal Democrat Mike Ashton 333 52.3 -15.3
Conservative Christine Kittredge 304 47.7 +15.3
Majority 29 4.6 -30.7
Turnout 637 34.0 +7.0
Liberal Democrat hold Swing
Lindford [2]
PartyCandidateVotes%±
Conservative Yvonne Parker-Smith 450 74.6 +6.4
Liberal Democrat Liz King 153 25.4 -6.4
Majority 297 49.3 +13.0
Turnout 603 33.5 +4.2
Conservative hold Swing
Liss (2) [2]
PartyCandidateVotes%±
Conservative Elizabeth Cartwright 1,171
Conservative Gina Logan 1,088
Labour Howard Linsley 298
Labour Leslie Hammond 297
Turnout 2,854 38.7 +0.7
Conservative hold Swing
Petersfield Bell Hill [2]
PartyCandidateVotes%±
Conservative John West 396 53.2 +8.8
Liberal Democrat Roger Mullenger 311 41.8 +4.5
Labour Moira Johnson 37 5.0 -13.3
Majority 85 11.4 +4.3
Turnout 744 39.8 +8.1
Conservative hold Swing
Petersfield Causeway [2]
PartyCandidateVotes%±
Liberal Democrat Anne Claxton 364 46.7 -3.3
Conservative Robert Matthews 346 44.4 +4.6
Labour Bill Organ 69 8.9 -1.3
Majority 18 2.3 -7.9
Turnout 779 43.1 +6.0
Liberal Democrat hold Swing
Petersfield Heath [2]
PartyCandidateVotes%±
Conservative Julie Butler 353 55.5 -0.1
Liberal Democrat Phillip Humphries 283 44.5 +0.1
Majority 70 11.0 -0.3
Turnout 636 38.4 +1.5
Conservative hold Swing
Petersfield Rother [3]
PartyCandidateVotes%±
Conservative Bob Ayer unopposed
Conservative hold Swing
Petersfield St Mary's [2]
PartyCandidateVotes%±
Conservative Guy Stacpoole 557 62.1 -12.8
Liberal Democrat Jonathan Coninx 218 24.3 +24.3
Labour Christine Straw 122 13.6 -11.5
Majority 339 37.8 -11.9
Turnout 897 44.1 +1.1
Conservative hold Swing
Petersfield St Peter's [2]
PartyCandidateVotes%±
Conservative Hilary Ayer 396 71.2 +6.4
Liberal Democrat Alex Pinhorn 160 28.8 -6.4
Majority 236 42.4 +12.9
Turnout 556 30.4 -1.8
Conservative hold Swing
Ropley and Tisted [2]
PartyCandidateVotes%±
Conservative Chris Graham 775 84.3 +35.7
Liberal Democrat Liz Ludlow 144 15.7 -35.7
Majority 631 68.7
Turnout 919 52.7 -5.9
Conservative hold Swing
Rowlands Castle [2]
PartyCandidateVotes%±
Conservative Marge Harvey 672 66.0 +29.4
Liberal Democrat Peter Whitaker 346 34.0 -29.4
Majority 326 32.0
Turnout 1,018 49.4 +7.8
Conservative hold Swing
Selborne [2]
PartyCandidateVotes%±
Conservative Maureen Comber 413 50.1 -2.0
Liberal Democrat Keith Pritchard 412 49.9 +2.0
Majority 1 0.1 -4.0
Turnout 825 46.4 +0.8
Conservative hold Swing
The Hangers and Forest [2]
PartyCandidateVotes%±
Conservative Judy Onslow 671 79.3
Independent Donald Jerrard 175 20.7
Majority 496 58.6
Turnout 846 45.0
Conservative hold Swing
Whitehill Chase [3]
PartyCandidateVotes%±
Liberal Democrat Zoya Faddy unopposed
Liberal Democrat hold Swing
Whitehill Deadwater [2]
PartyCandidateVotes%±
Liberal Democrat Tony Muldoon 227 63.4 +2.4
Conservative Colin Leach 131 36.6 -2.4
Majority 96 26.8 +4.8
Turnout 358 18.1 -2.3
Liberal Democrat hold Swing
Whitehill Hogmoor [2]
PartyCandidateVotes%±
Liberal Democrat Philip Drury 298 71.1 -1.8
Conservative Olivia Todd-Russett 121 28.9 +1.8
Majority 177 42.2 -3.5
Turnout 419 23.1 -4.4
Liberal Democrat hold Swing
Whitehill Pinewood [2]
PartyCandidateVotes%±
Liberal Democrat Ian Dowdle 223 57.3 -2.5
Conservative Chris Jones 166 42.7 +2.5
Majority 57 14.7 -4.8
Turnout 389 19.4 +5.7
Liberal Democrat hold Swing
Whitehill Walldown [3]
PartyCandidateVotes%±
Liberal Democrat Adam Carew unopposed
Liberal Democrat hold Swing

Related Research Articles

Farnborough, Hampshire town in Hampshire, England

Farnborough is a town in north east Hampshire, England, part of the borough of Rushmoor and the Farnborough/Aldershot Built-up Area. Farnborough was founded in Saxon times and is mentioned in the Domesday Book of 1086. The name is formed from Ferneberga which means "fern hill".

Hampshire County Council British administrative body

Hampshire County Council (HCC) is the county council that governs the majority of the county of Hampshire in England. It provides the upper tier of local government, below which are district councils, and town and parish councils. The county council has 78 elected councillors, and is based in the county town of Winchester.

Borough of Waverley Non-metropolitan district in England

The Borough of Waverley is a local government district with borough status in Surrey, England. The borough's headquarters are in the town of Godalming; other notable settlements are the towns of Farnham and Haslemere and the large village of Cranleigh. At the 2011 Census, the population of the borough was 121,572.

Basingstoke and Deane Borough and Non-metropolitan district in England

Basingstoke and Deane is a local government district and borough in Hampshire, England. Its primary settlement is Basingstoke. Other settlements include Bramley, Tadley, Kingsclere, Overton, Oakley, Whitchurch and the hamlet of Deane, some 7 miles (11 km) from Basingstoke.

Borough of Eastleigh Borough & Non-metropolitan district in England


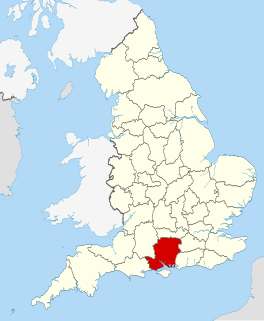
The Borough of Eastleigh is a local government district and borough in Hampshire, England, bordering the unitary authority of Southampton, Test Valley, the City of Winchester and the Borough of Fareham. Eastleigh is separated from the New Forest by Southampton Water. Water bounds much of the borough, with Southampton Water and the River Hamble bordering the east and southwest of the district. The built up nature of neighbouring Southampton and the urban area around the town of Eastleigh contrast with the rural nature of much of the borough, which lies within the Hampshire Basin.

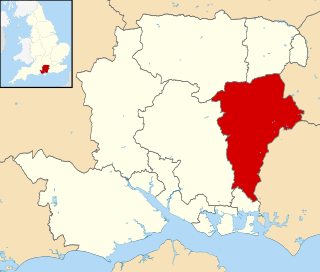
East Hampshire District Council in Hampshire England is elected every four years. Since the last boundary changes in 2003, 44 councillors have been elected from 38 wards.

New Forest District Council in Hampshire, England is elected every four years.

2007 South Lakeland District Council election

The 2007 South Lakeland District Council election took place on 3 May 2007 to elect members of South Lakeland District Council in Cumbria, England. One third of the council was up for election and the Liberal Democrats stayed in overall control of the council.

2007 Winchester City Council election

The 2007 Winchester Council election took place on 3 May 2007 to elect members of Winchester District Council in Hampshire, England. One third of the council was up for election and the Conservative party stayed in overall control of the council.

2007 Stroud District Council election

The 2007 Stroud Council election took place on 3 May 2007 to elect members of Stroud District Council in Gloucestershire, England. One third of the council was up for election and the Conservative party stayed in overall control of the council.

2007 Southampton City Council election

The 2007 Southampton Council election took place on 3 May 2007 to elect members of Southampton Unitary Council in Hampshire, England. One third of the council was up for election and the council stayed under no overall control.

2008 Southampton City Council election

The 2008 Southampton Council election took place on 1 May 2008 to elect members of Southampton Unitary Council in Hampshire, England. One third of the council was up for election and the Conservative party gained overall control of the council from no overall control.

2007 Basingstoke and Deane Borough Council election

The 2007 Basingstoke and Deane Council election took place on 3 May 2007 to elect members of Basingstoke and Deane Borough Council in Hampshire, England. One third of the council was up for election and the Conservative party stayed in overall control of the council.

The 1999 East Hampshire District Council election took place on 6 May 1999 to elect members of East Hampshire District Council in Hampshire England. The whole council was up for election and the Conservative party gained overall control of the council from the Liberal Democrats.

2003 East Hampshire District Council election

The 2003 East Hampshire District Council election took place on 1 May 2003 to elect members of East Hampshire District Council in Hampshire England. The whole council was up for election with boundary changes since the last election in 1999 increasing the number of seats by 2. The Conservative party stayed in overall control of the council.

2011 East Hampshire District Council election

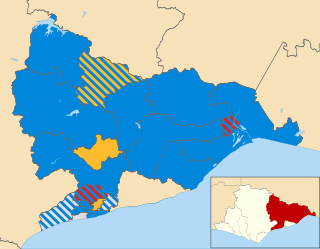
The 2011 East Hampshire District Council election took place on 5 May 2011 to elect members of East Hampshire District Council in Hampshire England. The whole council was up for election and the Conservative party stayed in overall control of the council.

2013 Hampshire County Council election

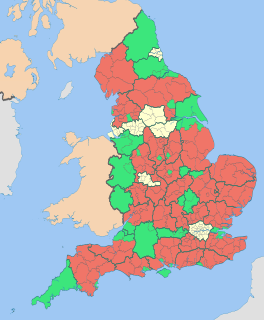
An election to Hampshire County Council took place on 2 May 2013 as part of the United Kingdom local elections, 2013. 78 councillors were elected from 75 electoral divisions, which returned either one or two county councillors each by first-past-the-post voting for a four-year term of office. The electoral divisions were the same as those of the previous election in 2009. No elections were held in Portsmouth and Southampton, which are unitary authorities outside the area covered by the County Council. The election saw the Conservative Party retain overall control of the council, with a reduced majority of five councillors.

2011 Rother District Council election

The 2011 Rother District Council election took place on 5 May 2011 to elect members of Rother District Council in East Sussex, England. The whole council was up for election and the Conservative party stayed in overall control of the council.

2015 Wychavon District Council election

The 2015 Wychavon District Council election took place on 7 May 2015 to elect members of Wychavon District Council in Worcestershire, England. The whole council was up for election and the Conservative party stayed in overall control of the council.

References

  1. 1 2 "East Hampshire". BBC News Online . Retrieved 31 August 2011.
  2. 1 2 3 4 5 6 7 8 9 10 11 12 13 14 15 16 17 18 19 20 21 22 23 24 25 26 27 28 29 30 31 32 33 "District Council election results 2007". East Hampshire District Council. Retrieved 31 August 2011.
  3. 1 2 3 4 5 6 7 "local Elections 2007". Local Elections Archive Project. Retrieved 1 September 2011.