Garcia Hernandez

Last updated
Garcia Hernandez
Municipality of Garcia Hernandez
Garcia-Hernandez Bohol 1.jpg
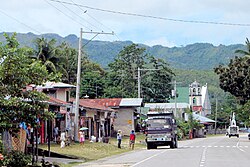
Garcia Hernandez – public market
Flag of Garcia Hernandez.png
Ph seal Garcia Hernandez, Bohol.png
Ph locator bohol garcia hernandez.png
Map of Bohol with Garcia Hernandez highlighted
OpenStreetMap
Garcia Hernandez
Philippines location map (square).svg
Red pog.svg
Garcia Hernandez
Location within the Philippines
Coordinates: 9°36′52″N124°17′41″E / 9.6144°N 124.2946°E / 9.6144; 124.2946
CountryPhilippines
Region Central Visayas
Province Bohol
District 3rd district
Founded May 27, 1854
Named after Victor Garcia
Narciso Hernandez
Barangays 30 (see Barangays)
Government
[1]
  Type Sangguniang Bayan
   Mayor Filadelfo Jess V. Baja III
   Vice Mayor Antonia J. Ladaga
   Representative Kristine Alexie B. Tutor
   Municipal Council
Members
  • An P. Baja
  • Edgar B. Galbizo
  • Carol Tejano-Tentativa
  • Lito O. Dajalos
  • Editha I. Virador
  • Nilo G. Salise
  • Antonio V. Baja
  • Aldrich Kent I. Ladesma
  • NBCOMELEC [2]
   Electorate 17,183 voters (2025)
Area
[3]
  Total
127.50 km2 (49.23 sq mi)
Elevation
[4]
2.0 m (6.6 ft)
Population
 (2024 census) [5]
  Total
24,450
  Density190/km2 (500/sq mi)
   Households
5,448
Economy
   Income class 4th municipal income class
   Poverty incidence
22.21
% (2021) [6]
   Revenue 172.4 million (2022)
   Assets 399.6 million (2022)
   Expenditure 117.9 million (2022)
   Liabilities 67.07 million (2022)
Service provider
  ElectricityBohol 2 Electric Cooperative (BOHECO 2)
Time zone UTC+8 (PST)
ZIP code
6307
PSGC
IDD : area code +63(0)38
Native languages Boholano dialect
Cebuano
Tagalog
Website garciahernandez.gov.ph

Garcia Hernandez, officially the Municipality of Garcia Hernandez (Cebuano : Munisipalidad sa Garcia Hernandez; Tagalog : Bayan ng Garcia Hernandez), is a municipality in the province of Bohol, Philippines. According to the 2020 census, it has a population of 24,430 people. [7]

Contents

Garcia Hernandez is 57 kilometres (35 mi) from Tagbilaran.

It was declared an independent municipality on May 27, 1854 from Jagna by the Spanish Superior Government in Manila, through its representative Voraledez. It was Voraledez who renamed this town from its old name Sinugbuan to what it is presently known today, as an expression of gratitude to Fathers Victor Garcia and Narciso Hernandez, then Parish Priests of the towns of Loay and Guindulman, respectively. These two Spanish Friars were instrumental in the realization of the residents desire to be independent from Jagna.

The town is home to the sacred burial cave of Kalagan. [8]

Geography

Barangays

Garcia Hernandez is politically subdivided into 30 barangays. Each barangay consists of puroks and some have sitios.

PSGC Barangay Population ±% p.a. AreaPD2024
2024 [9] 2010 [10] haacre/km2/sq mi
071222001 Abijilan 5.8% 1,411 1,479 −0.33% 8202,026 170 450
071222002 Antipolo 2.5% 613 627 −0.16% 5221,290 120 300
071222003 Basiao 2.2% 532 514 0.24% 236583 230 580
071222004 Cagwang 1.4% 351 340 0.22% 5321,315 66 170
071222005 Calma 3.1% 759 752 0.07% 126311 600 1,600
071222006 Cambuyo 2.6% 638 614 0.27% 6421,586 99 260
071222007 Canayaon East 3.8% 925 931 −0.05% 211521 440 1,100
071222008 Canayaon West 3.9% 965 945 0.15% 194479 500 1,300
071222009 Candanas 3.1% 765 771 −0.05% 7351,816 100 270
071222010 Candulao 1.9% 459 422 0.59% 132326 350 900
071222011 Catmon 1.1% 277 220 1.63% 240593 120 300
071222012 Cayam 4.7% 1,140 1,194 −0.33% 5411,337 210 550
071222013 Cupa 0.9% 218 212 0.20% 245605 89 230
071222014 Datag 5.2% 1,268 1,184 0.48% 1,2893,185 98 250
071222015 Estaca 0.8% 203 194 0.32% 194479 100 270
071222016 Libertad 1.8% 436 421 0.25% 380939 110 300
071222017 Lungsodaan East 4.6% 1,114 1,098 0.10% 7181,774 160 400
071222018 Lungsodaan West 4.5% 1,105 997 0.73% 6371,574 170 450
071222019 Malinao 5.5% 1,338 1,046 1.75% 6341,567 210 550
071222020 Manaba 7.0% 1,723 1,679 0.18% 296731 580 1,500
071222021 Pasong 4.5% 1,101 918 1.29% 6841,690 160 420
071222022 Poblacion East 5.6% 1,370 1,328 0.22% 4391,085 310 810
071222023 Poblacion West 3.7% 906 961 −0.41% 4221,043 210 560
071222024 Sacaon 2.6% 629 614 0.17% 253625 250 640
071222025 Sampong 1.0% 243 241 0.06% 5241,295 46 120
071222026 Tabuan 5.4% 1,318 1,277 0.22% 7501,853 180 460
071222027 Togbongon 1.3% 324 367 −0.87% 388959 84 220
071222028 Ulbujan East 2.8% 690 673 0.18% 4191,035 160 430
071222029 Ulbujan West 3.4% 831 745 0.77% 4261,053 200 510
071222030 Victoria 1.1% 272 274 −0.05% 118292 230 600
Total24,45023,0380.42%12,75031,50619014

Climate

Climate data for Garcia Hernandez, Bohol
MonthJanFebMarAprMayJunJulAugSepOctNovDecYear
Mean daily maximum °C (°F)28
(82)
29
(84)
30
(86)
31
(88)
31
(88)
30
(86)
30
(86)
30
(86)
30
(86)
29
(84)
29
(84)
29
(84)
30
(85)
Mean daily minimum °C (°F)23
(73)
22
(72)
23
(73)
23
(73)
24
(75)
25
(77)
24
(75)
24
(75)
24
(75)
24
(75)
23
(73)
23
(73)
24
(74)
Average precipitation mm (inches)102
(4.0)
85
(3.3)
91
(3.6)
75
(3.0)
110
(4.3)
141
(5.6)
121
(4.8)
107
(4.2)
111
(4.4)
144
(5.7)
169
(6.7)
139
(5.5)
1,395
(55.1)
Average rainy days18.614.816.516.723.926.425.624.124.426.323.720.5261.5
Source: Meteoblue [11]

Demographics

Population census of Garcia Hernandez
YearPop.±% p.a.
1903 6,060    
1918 8,555+2.33%
1939 11,486+1.41%
1948 13,690+1.97%
1960 12,828−0.54%
1970 13,604+0.59%
1975 16,701+4.20%
1980 16,715+0.02%
1990 18,956+1.27%
1995 21,323+2.23%
2000 21,428+0.11%
2007 21,308−0.08%
2010 23,038+2.88%
2015 24,194+0.94%
2020 24,430+0.20%
2024 24,450+0.02%
Source: Philippine Statistics Authority [12] [13] [10] [14] [15]

Economy

Poverty incidence of Garcia Hernandez

10
20
30
40
50
2000
38.33
2003
24.27
2006
35.30
2009
46.79
2012
28.01
2015
26.34
2018
17.60
2021
22.21

Source: Philippine Statistics Authority [16] [17] [18] [19] [20] [21] [22] [23]

Parishes

References

  1. Municipality of Garcia Hernandez | (DILG)
  2. "2025 Election Results - Region VII - Bohol - Garcia Hernandez". Commission on Elections (Philippines). May 12, 2025.
  3. "2015 Census of Population, Report No. 3 – Population, Land Area, and Population Density" (PDF). Philippine Statistics Authority. Quezon City, Philippines. August 2016. ISSN   0117-1453. Archived (PDF) from the original on May 25, 2021. Retrieved July 16, 2021.
  4. https://ph.geoview.info/garcia_hernandez,1713185.{{cite web}}: Missing or empty |title= (help)
  5. "2024 Census of Population (POPCEN) Population Counts Declared Official by the President". Philippine Statistics Authority. 17 July 2025. Retrieved 18 July 2025.
  6. "PSA Releases the 2021 City and Municipal Level Poverty Estimates". Philippine Statistics Authority. 2 April 2024. Retrieved 28 April 2024.
  7. "2024 Census of Population (POPCEN) Population Counts Declared Official by the President". Philippine Statistics Authority. 17 July 2025. Retrieved 18 July 2025.
  8. ""KALAGAN" Ancient Burial Cave". YouTube . 2 August 2011. Archived from the original on 2021-12-05.
  9. Census of Population (2020). "Region VII (Central Visayas)". Total Population by Province, City, Municipality and Barangay. Philippine Statistics Authority . Retrieved 8 July 2021.
  10. 1 2 Census of Population and Housing (2010). "Region VII (Central Visayas)" (PDF). Total Population by Province, City, Municipality and Barangay. National Statistics Office . Retrieved 29 June 2016.
  11. "Garcia Hernandez: Average Temperatures and Rainfall". Meteoblue. Retrieved 9 May 2020.
  12. "2024 Census of Population (POPCEN) Population Counts Declared Official by the President". Philippine Statistics Authority. 17 July 2025. Retrieved 18 July 2025.
  13. Census of Population (2015). "Region VII (Central Visayas)". Total Population by Province, City, Municipality and Barangay. Philippine Statistics Authority . Retrieved 20 June 2016.
  14. Censuses of Population (1903–2007). "Region VII (Central Visayas)". Table 1. Population Enumerated in Various Censuses by Province/Highly Urbanized City: 1903 to 2007. National Statistics Office.
  15. "Province of Bohol". Municipality Population Data. Local Water Utilities Administration Research Division. Retrieved 17 December 2016.
  16. "Poverty incidence (PI):". Philippine Statistics Authority. Retrieved December 28, 2020.
  17. "Estimation of Local Poverty in the Philippines" (PDF). Philippine Statistics Authority. 29 November 2005.
  18. "2003 City and Municipal Level Poverty Estimates" (PDF). Philippine Statistics Authority. 23 March 2009.
  19. "City and Municipal Level Poverty Estimates; 2006 and 2009" (PDF). Philippine Statistics Authority. 3 August 2012.
  20. "2012 Municipal and City Level Poverty Estimates" (PDF). Philippine Statistics Authority. 31 May 2016.
  21. "Municipal and City Level Small Area Poverty Estimates; 2009, 2012 and 2015". Philippine Statistics Authority. 10 July 2019.
  22. "PSA Releases the 2018 Municipal and City Level Poverty Estimates". Philippine Statistics Authority. 15 December 2021. Retrieved 22 January 2022.
  23. "PSA Releases the 2021 City and Municipal Level Poverty Estimates". Philippine Statistics Authority. 2 April 2024. Retrieved 28 April 2024.