With the usual IQ scoring methods, an IQ score of 100 means that the test-taker's performance on the test is of average performance in the sample of test-takers of about the same age as was used to norm the test. An IQ score of 115 means performance one standard deviation above the mean, while a score of 85 means performance one standard deviation below the mean, and so on.[5] This "deviation IQ" method is used for standard scoring of all IQ tests in large part because they allow a consistent definition of IQ for both children and adults. By the existing "deviation IQ" definition of IQ test standard scores, about two-thirds of all test-takers obtain scores from 85 to 115, and about 5 percent of the population scores above 125 (i.e.normal distribution).[6]
When IQ testing was first created, Lewis Terman and other early developers of IQ tests noticed that most child IQ scores come out to approximately the same number regardless of testing procedure. Variability in scores can occur when the same individual takes the same test more than once.[7][8] Further, a minor divergence in scores can be observed when an individual takes tests provided by different publishers at the same age.[9] There is no standard naming or definition scheme employed universally by all test publishers for IQ score classifications.
Even before IQ tests were invented, there were attempts to classify people into intelligence categories by observing their behavior in daily life.[10][11] Those other forms of behavioral observation were historically important for validating classifications based primarily on IQ test scores. Some early intelligence classifications by IQ testing depended on the definition of "intelligence" used in a particular case. Contemporary IQ test publishers take into account reliability and error of estimation in the classification procedure.
Differences in individual IQ classification
IQ scores can differ to some degree for the same person on different IQ tests, so a person does not always belong to the same IQ score range each time the person is tested (IQ score table data and pupil pseudonyms adapted from description of KABC-II norming study cited in Kaufman 2009).[12][13]
Pupil
KABC-II
WISC-III
WJ-III
Asher
90
95
111
Brianna
125
110
105
Colin
100
93
101
Danica
116
127
118
Elpha
93
105
93
Fritz
106
105
105
Georgi
95
100
90
Hector
112
113
103
Imelda
104
96
97
Jose
101
99
86
Keoku
81
78
75
Leo
116
124
102
IQ tests generally are reliable enough that most people 10 years of age and older have similar IQ scores throughout life.[14] Still, some individuals score very differently when taking the same test at different times or when taking more than one kind of IQ test at the same age.[15] About 42% of children change their score by 5 or more points when re-tested.[16]
For example, many children in the famous longitudinal Genetic Studies of Genius begun in 1921 by Lewis Terman showed declines in IQ as they grew up. Terman recruited school pupils based on referrals from teachers, and gave them his Stanford–Binet IQ test. Children with an IQ above 140 by that test were included in the study. There were 643 children in the main study group. When the students who could be contacted again (503 students) were retested at high school age, they were found to have dropped 9 IQ points on average in Stanford–Binet IQ. Some children dropped by 15 IQ points or by 25 points or more. Yet parents of those children thought that the children were still as bright as ever, or even brighter.[17]
Because all IQ tests have error of measurement in the test-taker's IQ score, a test-giver should always inform the test-taker of the confidence interval around the score obtained on a given occasion of taking each test.[18] IQ scores are ordinal scores and are not expressed in an interval measurement unit.[19][20][21][22][23] Besides the reported error interval around IQ test scores, an IQ score could be misleading if a test-giver failed to follow standardized administration and scoring procedures. In cases of test-giver mistakes, the usual result is that tests are scored too leniently, giving the test-taker a higher IQ score than the test-taker's performance justifies. On the other hand, some test-givers err by showing a "halo effect", with low-IQ individuals receiving IQ scores even lower than if standardized procedures were followed, while high-IQ individuals receive inflated IQ scores.[24]
The categories of IQ vary between IQ test publishers as the category labels for IQ score ranges are specific to each brand of test. The test publishers do not have a uniform practice of labeling IQ score ranges, nor do they have a consistent practice of dividing up IQ score ranges into categories of the same size or with the same boundary scores.[25] Thus psychologists should specify which test was given when reporting a test-taker's IQ category if not reporting the raw IQ score.[26] Psychologists and IQ test authors recommend that psychologists adopt the terminology of each test publisher when reporting IQ score ranges.[27][28]
IQ classifications from IQ testing are not the last word on how a test-taker will do in life, nor are they the only information to be considered for placement in school or job-training programs. There is still a dearth of information about how behavior differs between people with differing IQ scores.[29] For placement in school programs, for medical diagnosis, and for career advising, factors other than IQ can be part of an individual assessment as well.
The lesson here is that classification systems are necessarily arbitrary and change at the whim of test authors, government bodies, or professional organizations. They are statistical concepts and do not correspond in any real sense to the specific capabilities of any particular person with a given IQ. The classification systems provide descriptive labels that may be useful for communication purposes in a case report or conference, and nothing more.[30]
—Alan S. Kaufman and Elizabeth O. Lichtenberger, Assessing Adolescent and Adult Intelligence (2006)
IQ classification tables
There are a variety of individually administered IQ tests in use.[31][32] Not all report test results as "IQ", but most report a standard score with a mean score level of 100. When a test-taker scores higher or lower than the median score, the score is indicated as 15 standard score points higher or lower for each standard deviation difference higher or lower in the test-taker's performance on the test item content.
The Wechsler intelligence scales were developed from earlier intelligence scales by David Wechsler. David Wechsler, using the clinical and statistical skills he gained under Charles Spearman and as a World War I psychology examiner, crafted a series of intelligence tests. These eventually surpassed other such measures, becoming the most widely used and popular intelligence assessment tools for many years. The first Wechsler test published was the Wechsler–Bellevue Scale in 1939.[33] The Wechsler IQ tests for children and for adults are the most frequently used individual IQ tests in the English-speaking world[34] and in their translated versions are perhaps the most widely used IQ tests worldwide.[35] The Wechsler tests have long been regarded as the "gold standard" in IQ testing.[36] The Wechsler Adult Intelligence Scale—Fourth Edition (WAIS–IV) was published in 2008 by The Psychological Corporation.[31] The Wechsler Intelligence Scale for Children—Fifth Edition (WISC–V) was published in 2014 by The Psychological Corporation, and the Wechsler Preschool and Primary Scale of Intelligence—Fourth Edition (WPPSI–IV) was published in 2012 by The Psychological Corporation. Like all contemporary IQ tests, the Wechsler tests report a "deviation IQ" as the standard score for the full-scale IQ, with the norming sample mean raw score defined as IQ 100 and a score one standard deviation higher defined as IQ 115 (and one deviation lower defined as IQ 85).
During the First World War in 1917, adult intelligence testing gained prominence as an instrument for assessing drafted soldiers in the United States. Robert Yerkes, an American psychologist, was assigned to devise psychometric tools to allocate recruits to different levels of military service, leading to the development of the Army Alpha and Army Beta group-based tests. The collective efforts of Binet, Simon, Terman, and Yerkes laid the groundwork for modern intelligence test series.[37]
Psychologists have proposed alternative language for Wechsler IQ classifications.[41][42] The term "borderline", which implies being very close to being intellectually disabled (defined as IQ under 70), is replaced in the alternative system by a term that doesn't imply a medical diagnosis.
Alternate Wechsler IQ Classifications (after Groth-Marnat 2009)[43]
The fifth edition of the Stanford–Binet scales (SB5) was developed by Gale H. Roid and published in 2003 by Riverside Publishing.[31] Unlike scoring on previous versions of the Stanford–Binet test, SB5 IQ scoring is deviation scoring in which each standard deviation up or down from the norming sample median score is 15 points from the median score, IQ 100, just like the standard scoring on the Wechsler tests.
The Woodcock–Johnson a III NU Tests of Cognitive Abilities (WJ III NU) was developed by Richard W. Woodcock, Kevin S. McGrew and Nancy Mather and published in 2007 by Riverside.[31] The WJ III classification terms are not applied.
The Kaufman Adolescent and Adult Intelligence Test was developed by Alan S. Kaufman and Nadeen L. Kaufman and published in 1993 by American Guidance Service.[31] Kaufman test scores "are classified in a symmetrical, nonevaluative fashion",[46] in other words the score ranges for classification are just as wide above the mean as below the mean, and the classification labels do not purport to assess individuals.
The Kaufman Assessment Battery for Children, Second Edition was developed by Alan S. Kaufman and Nadeen L. Kaufman and published in 2004 by American Guidance Service.[31]
The Differential Ability Scales Second Edition (DAS–II) was developed by Colin D. Elliott and published in 2007 by Psychological Corporation.[31] The DAS-II is a test battery given individually to children, normed for children from ages two years and six months through seventeen years and eleven months.[50] It was normed on 3,480 noninstitutionalized, English-speaking children in that age range.[51] The DAS-II yields a General Conceptual Ability (GCA) score scaled like an IQ score with the mean standard score set at 100 and 15 standard score points for each standard deviation up or down from the mean. The lowest possible GCA score on DAS–II is 30, and the highest is 170.[52]
Reynolds Intellectual Ability Scales (RIAS) were developed by Cecil Reynolds and Randy Kamphaus. The RIAS was published in 2003 by Psychological Assessment Resources.[31]
RIAS 2003 Scheme of Verbal Descriptors of Intelligence Test Performance[54]
Intelligence test score range
Verbal descriptor
≥ 130
Significantly above average
120–129
Moderately above average
110–119
Above average
90–109
Average
80–89
Below average
70–79
Moderately below average
≤ 69
Significantly below average
Historical IQ classification tables
Reproduction of an item from the 1908 Binet–Simon intelligence scale, showing three pairs of pictures, about which the tested child was asked, "Which of these two faces is the prettier?" Reproduced from the article "A Practical Guide for Administering the Binet–Simon Scale for Measuring Intelligence" by J. E. Wallace Wallin in the March 1911 issue of the journal The Psychological Clinic (volume 5 number 1), public domain.
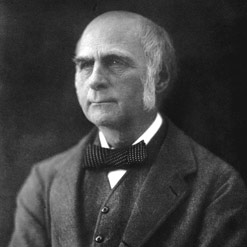
Lewis Terman, developer of the Stanford–Binet Intelligence Scales, based his English-language Stanford–Binet IQ test on the French-language Binet–Simon test developed by Alfred Binet. Terman believed his test measured the "general intelligence" construct advocated by Charles Spearman (1904).[55][56] Terman differed from Binet in reporting scores on his test in the form of intelligence quotient ("mental age" divided by chronological age) scores after the 1912 suggestion of German psychologist William Stern. Terman chose the category names for score levels on the Stanford–Binet test. When he first chose classification for score levels, he relied partly on the usage of earlier authors who wrote, before the existence of IQ tests, on topics such as individuals unable to care for themselves in independent adult life. Terman's first version of the Stanford–Binet was based on norming samples that included only white, American-born subjects, mostly from California, Nevada, and Oregon.[57]
Terman's Stanford–Binet original (1916) classification[58][59]
IQ Range ("ratio IQ")
IQ Classification
Above 140
"Near" genius or genius
120–140
Very superior intelligence
110–120
Superior intelligence
90–110
Normal, or average, intelligence
80–90
Dullness, rarely classifiable as feeble-mindedness
70–80
Borderline deficiency, sometimes classifiable as dullness, often as feeble-mindedness
69 and below
Definite feeble-mindedness
Rudolph Pintner proposed a set of classification terms in his 1923 book Intelligence Testing: Methods and Results.[4] Pintner commented that psychologists of his era, including Terman, went about "the measurement of an individual's general ability without waiting for an adequate psychological definition."[60] Pintner retained these terms in the 1931 second edition of his book.[61]
Albert Julius Levine and Louis Marks proposed a broader set of categories in their 1928 book Testing Intelligence and Achievement.[62][63] Some of the entries came from contemporary terms for people with intellectual disability.
The second revision (1937) of the Stanford–Binet test retained "quotient IQ" scoring, despite earlier criticism of that method of reporting IQ test standard scores.[64] The term "genius" was no longer used for any IQ score range.[65] The second revision was normed only on children and adolescents (no adults), and only "American-born white children".[66]
Terman's Stanford–Binet Second Revision (1937) classification[65]
IQ Range ("ratio IQ")
IQ Classification
140 and above
Very superior
120–139
Superior
110–119
High average
90–109
Normal or average
80–89
Low average
70–79
Borderline defective
69 and below
Mentally defective
A data table published later as part of the manual for the 1960 Third Revision (Form L-M) of the Stanford–Binet test reported score distributions from the 1937 second revision standardization group.
Score Distribution of Stanford–Binet 1937 Standardization Group[65]
IQ Range ("ratio IQ")
Percent of Group
160–169
0.03
150–159
0.2
140–149
1.1
130–139
3.1
120–129
8.2
110–119
18.1
100–109
23.5
90–99
23.0
80–89
14.5
70–79
5.6
60–69
2.0
50–59
0.4
40–49
0.2
30–39
0.03
David Wechsler, developer of the Wechsler–Bellevue Scale of 1939 (which was later developed into the Wechsler Adult Intelligence Scale) popularized the use of "deviation IQs" as standard scores of IQ tests rather than the "quotient IQs" ("mental age" divided by "chronological age") then used for the Stanford–Binet test.[67] He devoted a whole chapter in his book The Measurement of Adult Intelligence to the topic of IQ classification and proposed different category names from those used by Lewis Terman. Wechsler also criticized the practice of earlier authors who published IQ classification tables without specifying which IQ test was used to obtain the scores reported in the tables.[68]
Wechsler–Bellevue 1939 IQ classification
IQ Range ("deviation IQ")
IQ Classification
Percent Included
128 and over
Very Superior
2.2
120–127
Superior
6.7
111–119
Bright Normal
16.1
91–110
Average
50.0
80–90
Dull normal
16.1
66–79
Borderline
6.7
65 and below
Defective
2.2
In 1958, Wechsler published another edition of his book Measurement and Appraisal of Adult Intelligence. He revised his chapter on the topic of IQ classification and commented that "mental age" scores were not a more valid way to score intelligence tests than IQ scores.[69] He continued to use the same classification terms.
The third revision (Form L-M) in 1960 of the Stanford–Binet IQ test used the deviation scoring pioneered by David Wechsler. For rough comparability of scores between the second and third revision of the Stanford–Binet test, scoring table author Samuel Pinneau set 100 for the median standard score level and 16 standard score points for each standard deviation above or below that level. The highest score obtainable by direct look-up from the standard scoring tables (based on norms from the 1930s) was IQ 171 at various chronological ages from three years six months (with a test raw score "mental age" of six years and two months) up to age six years and three months (with a test raw score "mental age" of ten years and three months).[71] The classification for Stanford–Binet L-M scores does not include terms such as "exceptionally gifted" and "profoundly gifted" in the test manual itself. David Freides, reviewing the Stanford–Binet Third Revision in 1970 for the Buros Seventh Mental Measurements Yearbook (published in 1972), commented that the test was obsolete by that year.[72]
Terman's Stanford–Binet Third Revision (Form L-M) classification[44]
IQ Range ("deviation IQ")
IQ Classification
140 and above
Very superior
120–139
Superior
110–119
High average
90–109
Normal or average
80–89
Low average
70–79
Borderline defective
69 and below
Mentally defective
The first edition of the Woodcock–Johnson Tests of Cognitive Abilities was published by Riverside in 1977. The classifications used by the WJ-R Cog were "modern in that they describe levels of performance as opposed to offering a diagnosis."[45]
The revised version of the Wechsler Adult Intelligence Scale (the WAIS-R) was developed by David Wechsler and published by Psychological Corporation in 1981. Wechsler changed a few of the boundaries for classification categories and a few of their names compared to the 1958 version of the test. The test's manual included information about how the actual percentage of people in the norming sample scoring at various levels compared to theoretical expectations.
The Kaufman Assessment Battery for Children (K-ABC) was developed by Alan S. Kaufman and Nadeen L. Kaufman and published in 1983 by American Guidance Service.
The fourth revision of the Stanford–Binet scales (S-B IV) was developed by Thorndike, Hagen, and Sattler and published by Riverside Publishing in 1986. It retained the deviation scoring of the third revision with each standard deviation from the mean being defined as a 16 IQ point difference. The S-B IV adopted new classification terminology. After this test was published, psychologist Nathan Brody lamented that IQ tests had still not caught up with advances in research on human intelligence during the twentieth century.[74]
The third edition of the Wechsler Adult Intelligence Scale (WAIS-III) used different classification terminology from the earliest versions of Wechsler tests.
The earliest terms for classifying individuals of low intelligence were medical or legal terms that preceded the development of IQ testing.[10][11] The legal system recognized a concept of some individuals being so cognitively impaired that they were not responsible for criminal behavior. Medical doctors sometimes encountered adult patients who could not live independently, being unable to take care of their own daily living needs. Various terms were used to attempt to classify individuals with varying degrees of intellectual disability. Many of the earliest terms are now considered extremely offensive.
In modern medical diagnosis, IQ scores alone are not conclusive for a finding of intellectual disability. Recently adopted diagnostic standards place the major emphasis on the adaptive behavior of each individual, with IQ score a factor in diagnosis in addition to adaptive behavior scales. Some advocate for no category of intellectual disability to be defined primarily by IQ scores.[77] Psychologists point out that evidence from IQ testing should always be used with other assessment evidence in mind: "In the end, any and all interpretations of test performance gain diagnostic meaning when they are corroborated by other data sources and when they are empirically or logically related to the area or areas of difficulty specified in the referral."[78]
In the United States, the Supreme Court ruled in the case Atkins v. Virginia, 536 U.S. 304 (2002) that states could not impose capital punishment on people with "mental retardation", defined in subsequent cases as people with IQ scores below 70.[citation needed] This legal standard continues to be actively litigated in capital cases.[79]
Historical
Historically, terms for intellectual disability eventually became perceived as an insult, in a process commonly known as the euphemism treadmill.[80][81][82] The terms mental retardation and mentally retarded became popular in the middle of the 20th century to replace the previous set of terms, which included "imbecile", "idiot", "feeble-minded", and "moron",[83] among others. By the end of the 20th century, retardation and retard became widely seen as disparaging and politically incorrect, although they are still used in some clinical contexts.[84]
The long-defunct American Association for the Study of the Feeble-minded divided adults with intellectual deficits into three categories in 1916: Idiot indicated the greatest degree of intellectual disability in which a person's mental age is below three years. Imbecile indicated an intellectual disability less severe than idiocy and a mental age between three and seven years. Moron was defined as someone a mental age between eight and twelve.[85] Alternative definitions of these terms based on IQ were also used.[citation needed]
Mongolism and Mongoloid idiot were terms used to identify someone with Down syndrome, as the doctor who first described the syndrome, John Langdon Down, believed that children with Down syndrome shared facial similarities with the now-obsolete category of "Mongolian race". The Mongolian People's Republic requested that the medical community cease the use of the term; in 1960, the World Health Organization agreed the term should cease being used.[86]
Retarded comes from the Latin retardare, 'to make slow, delay, keep back, or hinder', so mental retardation meant the same as mentally delayed. The first record of retarded in relation to being mentally slow was in 1895. The term mentally retarded was used to replace terms like idiot, moron, and imbecile because retarded was not then a derogatory term. By the 1960s, however, the term had taken on a partially derogatory meaning. The noun retard is particularly seen as pejorative; a BBC survey in 2003 ranked it as the most offensive disability-related word.[87] The terms mentally retarded and mental retardation are still fairly common, but organizations such as the Special Olympics and Best Buddies are striving to eliminate their use and often refer to retard and its variants as the "r-word". These efforts resulted in U.S. federal legislation, known as Rosa's Law, which replaced the term mentally retarded with the term intellectual disability in federal law.[88][89]
Francis Galton (1822–1911) was a pioneer in investigating both eminent human achievement and mental testing. In his book Hereditary Genius, written before the development of IQ testing, he proposed that hereditary influences on eminent achievement are strong, and that eminence is rare in the general population. Lewis Terman chose "'near' genius or genius" as the classification label for the highest classification on his 1916 version of the Stanford–Binet test.[58] By 1926, Terman began publishing about a longitudinal study of California schoolchildren who were referred for IQ testing by their schoolteachers, called Genetic Studies of Genius, which he conducted for the rest of his life. Catherine M. Cox, a colleague of Terman's, wrote a whole book, The Early Mental Traits of 300 Geniuses, published as volume 2 of The Genetic Studies of Genius book series, in which she analyzed biographical data about historic geniuses. Although her estimates of childhood IQ scores of historical figures who never took IQ tests have been criticized on methodological grounds,[90][91][92] Cox's study was thorough in finding out what else matters besides IQ in becoming a genius.[93] By the 1937 second revision of the Stanford–Binet test, Terman no longer used the term "genius" as an IQ classification, nor has any subsequent IQ test.[65][94] In 1939, Wechsler wrote "we are rather hesitant about calling a person a genius on the basis of a single intelligence test score."[95]
The Terman longitudinal study in California eventually provided historical evidence on how genius is related to IQ scores.[96] Many California pupils were recommended for the study by schoolteachers. Two pupils who were tested but rejected for inclusion in the study because their IQ scores were too low, grew up to be Nobel Prize winners in physics: William Shockley[97][98] and Luis Walter Alvarez.[99][100] Based on the historical findings of the Terman study and on biographical examples such as Richard Feynman, who had an IQ of 125 and went on to win the Nobel Prize in physics and become widely known as a genius,[101][102] the view of psychologists and other scholars[who?] of genius is that a minimum IQ, about 125, is strictly necessary for genius,[citation needed] but that IQ is sufficient for the development of genius only when combined with the other influences identified by Cox's biographical study: an opportunity for talent development along with the characteristics of drive and persistence. Charles Spearman, bearing in mind the influential theory that he originated—that intelligence comprises both a "general factor" and "special factors" more specific to particular mental tasks—wrote in 1927, "Every normal man, woman, and child is, then, a genius at something, as well as an idiot at something."[103]
A major point of consensus among all scholars of intellectual giftedness is that there is no generally agreed upon definition of giftedness.[104] Although there is no scholarly agreement about identifying gifted learners, there is a de facto reliance on IQ scores for identifying participants in school gifted education programs. In practice, many school districts in the United States use an IQ score of 130, including roughly the upper 2 to 3 percent of the national population as a cut-off score for inclusion in school gifted programs.[105]
Five levels of giftedness have been suggested to differentiate the vast difference in abilities that exists between children on varying ends of the gifted spectrum.[106] Although there is no strong consensus on the validity of these quantifiers, they are accepted by many experts of gifted children.
As long ago as 1937, Lewis Terman pointed out that error of estimation in IQ scoring increases as IQ score increases, so that there is less and less certainty about assigning a test-taker to one band of scores or another as one looks at higher bands.[107] Modern IQ tests also have large error bands for high IQ scores.[108] As an underlying reality, such distinctions as those between "exceptionally gifted" and "profoundly gifted" have never been well established. All longitudinal studies of IQ have shown that test-takers can bounce up and down in score, and thus switch up and down in rank order as compared to one another, over the course of childhood. IQ classification categories such as "profoundly gifted" are those based on the obsolete Stanford–Binet Third Revision (Form L-M) test.[109] The highest reported standard score for most IQ tests is IQ 160, approximately the 99.997th percentile.[110] IQ scores above this level have wider error ranges as there are fewer normative cases at this level of intelligence.[111][112] Moreover, there has never been any validation of the Stanford–Binet L-M on adult populations, and there is no trace of such terminology in the writings of Lewis Terman. Although two contemporary tests attempt to provide "extended norms" that allow for classification of different levels of giftedness, those norms are not based on well validated data.[113]
↑Hunt 2011, p.5 "As mental testing expanded to the evaluation of adolescents and adults, however, there was a need for a measure of intelligence that did not depend upon mental age. Accordingly the intelligence quotient (IQ) was developed.... The narrow definition of IQ is a score on an intelligence test... where 'average' intelligence, that is the median level of performance on an intelligence test, receives a score of 100, and other scores are assigned so that the scores are distributed normally about 100, with a standard deviation of 15. Some of the implications are that: 1. Approximately two-thirds of all scores lie between 85 and 115. 2. Five percent (1/20) of all scores are above 125, and one percent (1/100) are above 135. Similarly, five percent are below 75 and one percent below 65."
↑Anastasi & Urbina 1997, p.326 "Correlation studies of test scores provide actuarial data, applicable to group predictions.... Studies of individuals, on the other hand, may reveal large upward or downward shifts in test scores."
↑Kaufman 2009, pp.151–153 "Thus, even for tests that measure similar CHC constructs and that represent the most sophisticated, high–quality IQ tests ever available at any point in time, IQs differ."
12Terman 1916, p.79 "What do the above IQ's imply in such terms as feeble-mindedness, border-line intelligence, dullness, normality, superior intelligence, genius, etc.? When we use these terms two facts must be borne in mind: (1) That the boundary lines between such groups are absolutely arbitrary, a matter of definition only; and (2) that the individuals comprising one of the groups do not make up a homogeneous type."
12Wechsler 1939, p.37 "The earliest classifications of intelligence were very rough ones. To a large extent they were practical attempts to define various patterns of behavior in medical-legal terms."
↑Kaufman 2009, Figure 5.1 IQs earned by preadolescents (ages 12–13) who were given three different IQ tests in the early 2000s
↑Kaufman 2013, Figure 3.1 "Source: A. S. Kaufman. IQ Testing 101 (New York: Springer, 2009). Adapted with permission."
↑Mackintosh 2011, p.169 "after the age of 8–10, IQ scores remain relatively stable: the correlation between IQ scores from age 8 to 18 and IQ at age 40 is over 0.70."
↑Uzieblo et al. 2012, p.34 "Despite the increasing disparity between total test scores across intelligence batteries—as the expanding factor structures cover an increasing amount of cognitive abilities (Flanagan, et al., 2010)—Floyd et al. (2008) noted that still 25% of assessed individuals will obtain a 10-point IQ score difference with another IQ battery. Even though not all studies indicate significant discrepancies between intelligence batteries at the group level (e.g., Thompson et al., 1997), the absence of differences at the individual level cannot be automatically assumed."
↑Shurkin 1992, pp.89–90 (citing Burks, Jensen & Terman, The Promise of Youth: Follow–up Studies of a Thousand Gifted Children 1930) "Twelve even dropped below the minimum for the Terman study, and one girl fell below 104, barely above average for the general population. ... Interestingly, while his tests measured decreases in test scores, the parents of the children noted no changes at all. Of all the parents who filled out the home questionnaire, 45 percent perceived no change in their children, 54 percent thought their children were getting brighter, including the children whose scores actually dropped."
↑Sattler 2008, p.121 "Whenever you report an overall standard score (e.g., a Full Scale IQ or a similar standard score), accompany it with a confidence interval (see Chapter 4). The confidence interval is a function of both the standard error of measurement and the confidence level: the greater the confidence level (e.g., 99% > 95% > 90% > 85% > 68%) or the lower the reliablility of the test (rxx = .80 <rxx = .85 <rxx = .90), the wider the confidence interval. Psychologists usually use a confidence interval of 95%."
↑Matarazzo 1972, p.121 "The psychologist's effort at classifying intelligence utilizes, at present, an ordinal scale, and is akin to what a layman does when he tries to distinguish colors of the rainbow." (emphasis in original)
↑Gottfredson 2009, pp.32–33 "We cannot be sure that IQ tests provide interval–level measurement rather than just ordinal–level (i.e., rank–order) measurement. ... we really do not know whether a 10–point difference measures the same intellectual difference at all ranges of IQ."
↑Mackintosh 2011, pp.33–34 "Although many psychometricians have argued otherwise (e.g., Jensen 1980), it is not immediately obvious that IQ is even an interval scale, that is, one where, say, the ten–point difference between IQ scores of 110 and 100 is the same as the ten–point difference between IQs of 160 and 150. The most conservative view would be that IQ is simply an ordinal scale: to say that someone has an IQ of 130 is simply to say that their test score lies within the top 2.5% of a representative sample of people the same age."
↑Jensen 2011, p.172 "The problem with IQ tests and virtually all other scales of mental ability in popular use is that the scores they yield are only ordinal (i.e., rank-order) scales; they lack properties of true ratio scales, which are essential to the interpretation of the obtained measures."
↑Kaufman & Lichtenberger 2006, pp.198–202 (section "Scoring Errors") "Bias errors were in the direction of leniency for all subtests, with Comprehension producing the strongest halo effect."
↑Reynolds & Horton 2012, Table 4.1 Descriptions for Standard Score Performances Across Selected Pediatric Neuropsychology Tests
↑Sattler 2001, p.698 "Tests usually provide some system by which to classify scores. Follow the specified classification system strictly, labeling scores according to what is recommended in the test manual. If you believe that a classification does not accurately reflect the examinee's status, state your concern in the report when you discuss the reliability and validity of the findings."
↑Gottfredson 2009, p.32 "One searches in vain, for instance, for a good accounting of the capabilities that 10-year-olds, 15-year-olds, or adults of 110 usually possess but similarly aged individuals of IQ 90 do not... IQ tests are not intended to isolate and measure highly specific skills and knowledge. This is the job of suitably designed achievement tests."
↑Flanagan & Harrison 2012, chapters 8-13, 15-16 (discussing Wechsler, Stanford–Binet, Kaufman, Woodcock–Johnson, DAS, CAS, and RIAS tests)
↑Mackintosh 2011, p.32 "The most widely used individual IQ tests today are the Wechsler tests, first published in 1939 as the Wechsler–Bellevue Scale."
↑Saklofske et al. 2003, p.3 "To this day, the Wechsler tests remain the most often used individually administered, standardized measures for assessing intelligence in children and adults" (citing Camara, Nathan & Puente, 2000; Prifitera, Weiss & Saklofske, 1998)
↑Georgas et al. 2003, p.xxv "The Wechsler tests are perhaps the most widely used intelligence tests in the world"
↑Kaufman, Alan S.; Engi Raiford, Susan; Coalson, Diane L. (2016). Intelligent Testing With the WISC-V. Hoboken, New Jersey: John Wiley & Sons. p.237. ISBN978-1-118-58923-6.
↑Kamphaus 2005, p.519 "Although the Wechsler classification system for intelligence test scores is by far the most popular, it may not be the most appropriate (Reynolds & Kaufman 1990)."
↑Wasserman 2012, pp.19–20 "The scale does not pretend to measure the entire mentality of the subject, but only general intelligence. (citing Terman, 1916, p. 48, emphasis in original)
↑Wasserman 2012, p.19 "No foreign-born or minority children were included.... The overall sample was predominantly white, urban, and middle-class"
↑Naglieri 1999, p.7 "The concept of general intelligence was assumed to exist, and psychologists went about 'the measurement of an individual's general ability without waiting for an adequate psychological definition.' (Pintner, 1923, p. 52)."
↑Wasserman 2012, p.35 "Inexplicably, Terman and Merrill made the mistake of retaining a ratio IQ (i.e., mental age/chronological age) on the 1937 Stanford–Binet, even though the method had long been recognized as producing distorted IQ estimates for adolescents and adults (e.g., Otis, 1917). Terman and Merrill (1937, pp. 27–28) justified their decision on the dubious ground that it would have been too difficult to reeducate teachers and other test users familiar with ratio IQ."
↑Wasserman 2012, p.35 "The 1939 test battery (and all subsequent Wechsler intelligence scales) also offered a deviation IQ, the index of intelligence based on statistical difference from the normative mean in standardized units, as Arthur Otis (1917) had proposed. Wechsler deserves credit for popularizing the deviation IQ, although the Otis Self-Administering Tests and the Otis Group Intelligence Scale had already used similar deviation-based composite scores in the 1920s."
↑Wechsler 1939, pp.39–40 "We have seen equivalent Binet I.Q. ratings reported for nearly every intelligence test now in use. In most cases the reporters proceeded to interpret the I.Q.'s obtained as if the tests measured the same thing as the Binet, and the indices calculated were equivalent to those obtained on the Stanford–Binet. ... The examiners were seemingly unaware of the fact that identical I.Q.'s on the different tests might well represent very different orders of intelligence."
↑Wechsler 1958, pp.42–43 "In brief, mental age is no more an absolute measure of intelligence than any other test score."
↑Wechsler 1958, p.42 Table 3 Intelligence classification of WAIS IQ's
↑Freides 1972, pp.772–773 "My comments in 1970 [published in 1972] are not very different from those made by F. L. Wells 32 years ago in The 1938 Mental Measurements Yearbook. The Binet scales have been around for a long time and their faults are well known."
12Gregory 1995, Table 4 Ability classifications, IQ ranges, and percent of norm sample for contemporary tests
↑Naglieri 1999, p.7 "In fact, the stagnation of intelligence tests is apparent in Brody's (1992) statement: 'I do not believe that our intellectual progress has had a major impact on the development of tests of intelligence' (p. 355)."
↑Sattler 1988, Table BC-2 Classification Ratings on Stanford–Binet: Fourth Edition, Wechsler Scales, and McCarthy Scales
↑American Psychiatric Association 2013, pp.33–37 Intellectual Disability (Intellectual Development Disorder): Specifiers "The various levels of severity are defined on the basis of adaptive functioning, and not IQ scores, because it is adaptive functioning that determines the level of supports required. Moreover, IQ measures are less valid in the lower end of the IQ range."
↑Rafter, Nicole Hahn (1998). Creating Born Criminals. University of Illinois Press, ISBN978-0-252-06741-9
↑Cummings NA, Wright RH (2005). "Chapter 1, Psychology's surrender to political correctness". Destructive trends in mental health: the well-intentioned path to harm. New York: Routledge. ISBN978-0-415-95086-2.
↑Pintner 1931, pp.356–357 "From a study of these boyhood records, estimates of the probable I.Q.s of these men in childhood have been made. ... It is of course obvious that much error may creep into an experiment of this sort, and the I.Q. assigned to any one individual is merely a rough estimate, depending to some extent upon how much information about his boyhood years has come down to us."
↑Shurkin 1992, pp.70–71 "She, of course, was not measuring IQ, she was measuring the length of biographies in a book. Generally, the more information, the higher the IQ. Subjects were dragged down if there was little information about their early lives."
↑Eysenck 1995, p.59 "Cox might well have been advised to reject a few of her geniuses for lack of evidence." Eysenck 1998, p.126 "Cox found that the more was known about a person's youthful accomplishments, that is, what he had done before he was engaged in doing the things that made him known as a genius, the higher was his IQ... So she proceeded to make a statistical correction in each case for lack of knowledge; this bumped up the figure considerably for the geniuses about whom little was in fact known.... I am rather doubtful about the justification for making the correction."
↑Cox 1926, pp.215–219, 218 (Chapter XIII: Conclusions) "3. That all equally intelligent children do not as adults achieve equal eminence is in part accounted for by our last conclusion: youths who achieve eminence are characterized not only by high intellectual traits, but also by persistence of motive and effort, confidence in their abilities, and great strength or force of character." (emphasis in original)
↑Kaufman 2009, p.117 "Terman (1916), as I indicated, used near genius or genius for IQs above 140, but mostly very superior has been the label of choice" (emphasis in original)
↑Eysenck 1998, pp.127–128 "Terman, who originated those 'Genetic Studies of Genius', as he called them, selected ... children on the basis of their high IQs, the mean was 151 for both sexes. Seventy–seven who were tested with the newly translated and standardized Binet test had IQs of 170 or higher–well at or above the level of Cox's geniuses. What happened to these potential geniuses–did they revolutionize society? ... The answer in brief is that they did very well in terms of achievement, but none reached the Nobel Prize level, let alone that of genius. ... It seems clear that these data powerfully confirm the suspicion that intelligence is not a sufficient trait for truly creative achievement of the highest grade."
↑Simonton 1999, p.4 "When Terman first used the IQ test to select a sample of child geniuses, he unknowingly excluded a special child whose IQ did not make the grade. Yet a few decades later that talent received the Nobel Prize in physics: William Shockley, the cocreator of the transistor. Ironically, not one of the more than 1,500 children who qualified according to his IQ criterion received so high an honor as adults."
↑Leslie 2000. "We also know that two children who were tested but didn't make the cut -- William Shockley and Luis Alvarez -- went on to win the Nobel Prize in Physics. According to Hastorf, none of the Terman kids ever won a Nobel or Pulitzer."
↑Park, Lubinski & Benbow 2010. "There were two young boys, Luis Alvarez and William Shockley, who were among the many who took Terman's tests but missed the cutoff score. Despite their exclusion from a study of young 'geniuses,' both went on to study physics, earn PhDs, and win the Nobel prize."
↑Gleick 2011, p.32 "Still, his score on the school IQ test was a merely respectable 125."
↑Robinson 2011, p.47 "After all, the American physicist Richard Feynman is generally considered an almost archetypal late 20th-century genius, not just in the United States but wherever physics is studied. Yet, Feynman's school-measured IQ, reported by him as 125, was not especially high"
↑Terman & Merrill 1937, p.44 "The reader should not lose sight of the fact that a test with even a high reliability yields scores which have an appreciable probable error. The probable error in terms of mental age is of course larger with older than with young children because of the increasing spread of mental age as we go from younger to older groups. For this reason it has been customary to express the P.E. [probable error] of a Binet score in terms of I.Q., since the spread of Binet I.Q.'s is fairly constant from age to age. However, when our correlation arrays [between Form L and Form M] were plotted for separate age groups they were all discovered to be distinctly fan-shaped. Figure 3 is typical of the arrays at every age level. From Figure 3 it becomes clear that the probable error of an I.Q. score is not a constant amount, but a variable which increases as I.Q. increases. It has frequently been noted in the literature that gifted subjects show greater I.Q. fluctuation than do clinical cases with low I.Q.'s... we now see that this trend is inherent in the I.Q. technique itself, and might have been predicted on logical grounds."
↑Lohman & Foley Nicpon 2012, Section "Conditional SEMs" "The concerns associated with SEMs [standard errors of measurement] are actually substantially worse for scores at the extremes of the distribution, especially when scores approach the maximum possible on a test... when students answer most of the items correctly. In these cases, errors of measurement for scale scores will increase substantially at the extremes of the distribution. Commonly the SEM is from two to four times larger for very high scores than for scores near the mean (Lord, 1980)."
↑Lohman & Foley Nicpon 2012, Section "Scaling Issues" "The spreading out of scores for young children at the extremes of the ratio IQ scale is viewed as a positive attribute of the SB-LM by clinicians who want to distinguish among the highly and profoundly gifted (Silverman, 2009). Although spreading out the test scores in this way may be helpful, the corresponding normative scores (i.e., IQs) cannot be trusted both because they are based on out-of-date norms and because the spread of IQ scores is a necessary consequence of the way ratio IQs are constructed, not a fact of nature."
↑Perleth, Schatz & Mönks 2000, p.301 "Norm tables that provide you with such extreme values are constructed on the basis of random extrapolation and smoothing but not on the basis of empirical data of representative samples."
↑Urbina 2011, Chapter 2: Tests of Intelligence. "[Curve-fitting] is just one of the reasons to be suspicious of reported IQ scores much higher than 160"
↑Lohman & Foley Nicpon 2012, Section "Scaling Issues" "Modern tests do not produce such high scores, in spite of heroic efforts to provide extended norms for both the Stanford Binet, Fifth Edition (SB-5) and the WISC-IV (Roid, 2003; Zhu, Clayton, Weiss, & Gabel, 2008)."
Bibliography
Aiken, Lewis (1979). Psychological Testing and Assessment (Thirded.). Boston: Allyn and Bacon. ISBN978-0-205-06613-1.
Campbell, Jonathan M. (2006). "Chapter 3: Mental Retardation/Intellectual Disability". In Campbell, Jonathan M.; Kamphaus, Randy W. (eds.). Psychodiagnostic Assessment of Children: Dimensional and Categorical Approaches. Hoboken (NJ): Wiley. ISBN978-0-471-21219-5.
Cox, Catherine M. (1926). The Early Mental Traits of 300 Geniuses. Genetic Studies of Genius Volume 2. Stanford (CA): Stanford University Press.
Foote, William E. (2007). "Chapter 17: Evaluations of Individuals for Disability in Insurance and Social Security Contexts". In Jackson, Rebecca (ed.). Learning Forensic Assessment. International Perspectives on Forensic Mental Health. New York: Routledge. pp.449–480. ISBN978-0-8058-5923-2.
Freides, David (1972). "Review of Stanford–Binet Intelligence Scale, Third Revision". In Oscar Buros (ed.). Seventh Mental Measurements Yearbook. Highland Park (NJ): Gryphon Press. pp.772–773.
Gallagher, Sherri L.; Sullivan, Amanda L. (2011). "Chapter 30: Kaufman Assessment Battery for Children, Second Edition". In Davis, Andrew (ed.). Handbook of Pediatric Neuropsychology. New York: Springer Publishing. pp.343–352. ISBN978-0-8261-0629-2.
Georgas, James; Weiss, Lawrence; van de Vijver, Fons; Saklofske, Donald (2003). "Preface". In Georgas, James; Weiss, Lawrence; van de Vijver, Fons; Saklofske, Donald (eds.). Culture and Children's Intelligence: Cross-Cultural Analysis of the WISC-III. San Diego (CA): Academic Press. pp.xvx–xxxii. ISBN978-0-12-280055-9.
Gottfredson, Linda S. (2009). "Chapter 1: Logical Fallacies Used to Dismiss the Evidence on Intelligence Testing". In Phelps, Richard F. (ed.). Correcting Fallacies about Educational and Psychological Testing. Washington (DC): American Psychological Association. ISBN978-1-4338-0392-5.
Kamphaus, Randy W. (2005). Clinical Assessment of Child and Adolescent Intelligence (Seconded.). New York: Springer. ISBN978-0-387-26299-4.
Kamphaus, Randy; Winsor, Ann Pierce; Rowe, Ellen W.; Kim, Songwon (2012). "Chapter 2: A History of Intelligence Test Interpretation". In Flanagan, Dawn P.; Harrison, Patti L. (eds.). Contemporary Intellectual Assessment: Theories, tests, and issues (Thirded.). New York (NY): Guilford Press. pp.56–70. ISBN978-1-60918-995-2.
Kaufman, Alan S.; Lichtenberger, Elizabeth O.; Fletcher-Janzen, Elaine; Kaufman, Nadeen L. (2005). Essentials of KABC-II Assessment. Hoboken (NJ): Wiley. ISBN978-0-471-66733-9.
Lohman, David F.; Foley Nicpon, Megan (2012). "Chapter 12: Ability Testing & Talent Identification"(PDF). In Hunsaker, Scott (ed.). Identification: The Theory and Practice of Identifying Students for Gifted and Talented Education Services. Waco (TX): Prufrock. pp.287–386. ISBN978-1-931280-17-4. Archived from the original(PDF) on 2016-03-15. Retrieved 2013-07-15.
Matarazzo, Joseph D. (1972). Wechsler's Measurement and Appraisal of Adult Intelligence (fifth and enlargeded.). Baltimore (MD): Williams & Witkins.
McIntosh, David E.; Dixon, Felicia A.; Pierson, Eric E. (2012). "Chapter 25: Use of Intelligence Tests in the Identification of Giftedness". In Flanagan, Dawn P.; Harrison, Patti L. (eds.). Contemporary Intellectual Assessment: Theories, tests, and issues (Thirded.). New York (NY): Guilford Press. pp.623–642. ISBN978-1-60918-995-2.
Meyer, Robert G.; Weaver, Christopher M. (2005). Law and Mental Health: A Case-Based Approach. New York: Guilford Press. ISBN978-1-59385-221-4.
Naglieri, Jack A. (1999). Essentials of CAS Assessment. Essentials of Psychological Assessment. Hoboken (NJ): Wiley. ISBN978-0-471-29015-5.
Park, Gregory; Lubinski, David; Benbow, Camilla P. (2 November 2010). "Recognizing Spatial Intelligence". Scientific American. Retrieved 5 June 2013.
Reynolds, Cecil R.; Horton, Arthur M. (2012). "Chapter 3: Basic Psychometrics and Test Selection for an Independent Pediatric Forensic Neuropsychology Evaluation". In Sherman, Elizabeth M.; Brooks, Brian L. (eds.). Pediatric Forensic Neuropsychology (Thirded.). Oxford: Oxford University Press. pp.41–65. ISBN978-0-19-973456-6.
Robinson, Andrew (2011). Genius: A Very Short Introduction. Oxford: Oxford University Press. ISBN978-0-19-959440-5.
Sattler, Jerome M. (2001). Assessment of Children: Cognitive Applications (Fourthed.). San Diego (CA): Jerome M. Sattler, Publisher. ISBN978-0-9618209-7-8.
Sattler, Jerome M. (2008). Assessment of Children: Cognitive Foundations. La Mesa (CA): Jerome M. Sattler, Publisher. ISBN978-0-9702671-4-6.
Strauss, Esther; Sherman, Elizabeth M.; Spreen, Otfried (2006). A Compendium of Neuropsychological Tests: Administration, Norms, and Commentary (Thirded.). Cambridge: Oxford University Press. ISBN978-0-19-515957-8.
Wasserman, John D. (2012). "Chapter 1: A History of Intelligence Assessment". In Flanagan, Dawn P.; Harrison, Patti L. (eds.). Contemporary Intellectual Assessment: Theories, tests, and issues (Thirded.). New York (NY): Guilford Press. pp.3–55. ISBN978-1-60918-995-2.
Wechsler, David (1939). The Measurement of Adult Intelligence (firsted.). Baltimore (MD): Williams & Witkins. LCCN39014016.
Weiss, Lawrence G.; Saklofske, Donald H.; Prifitera, Aurelio; Holdnack, James A., eds. (2006). WISC-IV Advanced Clinical Interpretation. Practical Resources for the Mental Health Professional. Burlington (MA): Academic Press. ISBN978-0-12-088763-7. This practitioner's handbook includes chapters by L.G. Weiss, J.G. Harris, A. Prifitera, T. Courville, E. Rolfhus, D.H. Saklofske, J.A. Holdnack, D. Coalson, S.E. Raiford, D.M. Schwartz, P. Entwistle, V. L. Schwean, and T. Oakland.
This page is based on this Wikipedia article Text is available under the CC BY-SA 4.0 license; additional terms may apply. Images, videos and audio are available under their respective licenses.