This article may be too long to read and navigate comfortably. Consider splitting content into sub-articles, condensing it, or adding subheadings. Please discuss this issue on the article's talk page.(October 2025)
The g factor[a] is a construct developed in psychometric investigations of cognitive abilities and human intelligence. It is a variable that summarizes positive correlations among different cognitive tasks, reflecting the assertion that an individual's performance on one type of cognitive task tends to be comparable to that person's performance on other kinds of cognitive tasks.[citation needed] The g factor typically accounts for 40 to 50 percent of the between-individual performance differences on a given cognitive test, and composite scores ("IQ scores") based on many tests are frequently regarded as estimates of individuals' standing on the g factor.[1] The terms IQ, general intelligence, general cognitive ability, general mental ability, and simply intelligence are often used interchangeably to refer to this common core shared by cognitive tests.[2] However, the g factor itself is a mathematical construct indicating the level of observed correlation between cognitive tasks.[3] The measured value of this construct depends on the cognitive tasks that are used, and little is known about the underlying causes of the observed correlations.
The existence of the g factor was originally proposed by the English psychologist Charles Spearman in the early years of the 20th century. He observed that children's performance ratings, across seemingly unrelated school subjects, were positively correlated, and reasoned that these correlations reflected the influence of an underlying general mental ability that entered into performance on all kinds of mental tests. Spearman suggested that all mental performance could be conceptualized in terms of a single general ability factor, which he labeled g, and many narrow task-specific ability factors. Soon after Spearman proposed the existence of g, it was challenged by Godfrey Thomson, who presented evidence that such intercorrelations among test results could arise even if no g-factor existed.[4]
Traditionally, research on g has concentrated on psychometric investigations of test data, with a special emphasis on factor analytic approaches. However, empirical research on the nature of g has also drawn upon experimental cognitive psychology and mental chronometry, brain anatomy and physiology, quantitative and molecular genetics, and primate evolution.[5]:545 Research in the field of behavioral genetics has shown that the construct of g is heritable in measured populations. It has a number of other biological correlates, including brain size. It is also a significant predictor of individual differences in many social outcomes, particularly in education and employment.
Critics have contended that an emphasis on g is misplaced and entails a devaluation of other important abilities. Some scientists, including Stephen J. Gould, have argued that the concept of g is a merely reified construct rather than a valid measure of human intelligence.
Concept
Spearman's correlation matrix for six measures of school performance. All the correlations are positive, the positive manifold phenomenon. The bottom row shows the g loadings of each performance measure.[6]
Classics
French
English
Math
Pitch
Music
Classics
–
French
.83
–
English
.78
.67
–
Math
.70
.67
.64
–
Pitch discrimination
.66
.65
.54
.45
–
Music
.63
.57
.51
.51
.40
–
g
.958
.882
.803
.750
.673
.646
Subtest intercorrelations in a sample of Scottish subjects who completed the WAIS-R battery. The subtests are Vocabulary, Similarities, Information, Comprehension, Picture arrangement, Block design, Arithmetic, Picture completion, Digit span, Object assembly, and Digit symbol. The bottom row shows the g loadings of each subtest. [7]
V
S
I
C
PA
BD
A
PC
DSp
OA
DS
V
–
S
.67
-
I
.72
.59
-
C
.70
.58
.59
-
PA
.51
.53
.50
.42
-
BD
.45
.46
.45
.39
.43
-
A
.48
.43
.55
.45
.41
.44
–
PC
.49
.52
.52
.46
.48
.45
.30
-
DSp
.46
.40
.36
.36
.31
.32
.47
.23
-
OA
.32
.40
.32
.29
.36
.58
.33
.41
.14
-
DS
.32
.33
.26
.30
.28
.36
.28
.26
.27
.25
-
g
.83
.80
.80
.75
.70
.70
.68
.68
.56
.56
.48
Correlations between mental tests
In a famous research paper published in 1904,[8] English psychologist Charles Spearman observed that children's performance measures across seemingly unrelated school subjects were positively correlated. The consistent finding of universally positive correlation matrices of mental test results (or the "positive manifold"), despite large differences in tests' contents, has been described as "arguably the most replicated result in all psychology".[9]
Using factor analysis or related statistical methods, it is possible to identify a single common factor that can be regarded as a summary variable characterizing the correlations between all the different tests in a test battery. Spearman referred to this common factor as the general factor, or simply g. (By convention, g is always printed as a lower case italic.) Mathematically, the g factor is a source of variance among individuals, which means that one cannot meaningfully speak of any one individual's mental abilities consisting of g or other factors to any specified degree. One can only speak of an individual's standing on g (or other factors) compared to other individuals in a relevant population.[10][11][12]
Different tests in a test battery may correlate with (or "load onto") the g factor of the battery to different degrees. These correlations are known as g loadings. An individual test taker's g factor score, representing their relative standing on the g factor in the total group of individuals, can be estimated using the g loadings. Full-scale IQ scores from a test battery will usually be highly correlated with g factor scores, and they are often regarded as estimates of g. For example, the correlations between g factor scores and full-scale IQ scores from David Wechsler's tests have been found to be greater than .95.[1][10][13] The terms IQ, general intelligence, general cognitive ability, general mental ability, or simply intelligence are frequently used interchangeably to refer to the common core shared by cognitive tests.[2]
The g loadings of mental tests are always positive and usually range between .10 and .90, with a mean of about .60 and a standard deviation of about .15. Raven's Progressive Matrices is among the tests with the highest g loadings, around .80. Tests of vocabulary and general information are also typically found to have high g loadings.[14][15] However, the g loading of the same test may vary somewhat depending on the composition of the test battery.[16]
The complexity of tests and the demands they place on mental manipulation are related to the tests' g loadings. For example, in the forward digit span test the subject is asked to repeat a sequence of digits in the order of their presentation after hearing them once at a rate of one digit per second. The backward digit span test is otherwise the same except that the subject is asked to repeat the digits in the reverse order to that in which they were presented. The backward digit span test is more complex than the forward digit span test, and it has a significantly higher g loading. Similarly, the g loadings of arithmetic computation, spelling, and word reading tests are lower than those of arithmetic problem solving, text composition, and reading comprehension tests, respectively.[10][17]
Test difficulty and g loadings are distinct concepts that may or may not be empirically related in any specific situation. Tests that have the same difficulty level, as indexed by the proportion of test items that are failed by test takers, may exhibit a wide range of g loadings. For example, tests of rote memory have been shown to have the same level of difficulty but considerably lower g loadings than many tests that involve reasoning.[17][18]
Spearman's research on intelligence originated from his research on measurement. He studied Francis Galton's theories of intelligence and was intriuged by why Galton failed to find associations between different performance metrics and common indicators of intelligence.[5]:22 Spearman posited that the tests Galton used contained substantial measurement error and were unreliable–the same person obtained a different score upon being tested again.[5]:22 Spearman developed procedures to correct correlation coefficients for various influences to estimate the "true relationship", including a procedure to disattenuate correlations.[19]:3–4 These ideas regarding true scores, measurement error and procedures for correcting correlations form the basis for what is now known as classical test theory.[19]:3–4 When he applied these procedures to the data he had gathered for measures of intelligence and what he called sensory discrimination ability, he obtained correlations approaching 1.[19]:3[20]:186-187
The concept of "general intelligence" first arose from Spearman's 1904 paper "'General Intelligence', Objectively Determined and Measured",[21] where he applied his new statistical methods for correcting correlations to tests of ability to propose a two-factor theory of intelligence.[19]:2–3 Based on the observation that tests of ability typically positively correlate with each other, he proposed that these tests all measure the same thing—general intelligence—and that individual tests measure a combination of two factors: 'general intelligence' (g), common to all tests, and a 'specific ability' (s), specific to one test.[5]:30[19]:3[22]:372–373 This concept of "general intelligence" was supposed to provide an undisputed definition of intelligence which could be described as "objectively determined and measured".[23]:194 There were several corollaries of his theory, such as the claim that it is "possible to rank order the measures in terms of their g-to-s ratio".[19] The most important was Spearman's law of tetrad differences, demonstrated by Spearman in 1924. It states that the pairwise products of two sets of correlations are equal–that is, their difference is zero. For four traits labeled 1, 2, 3, 4, this is r13⋅r24-r23r14=0.[19]:4[24]:288 This is equivalent to the prediction that for a correlation matrix statistically removing the common factor "g" would yield a matrix of partial correlations that are all 0.[23]:194[25]:209–210
Early critics
The first psychologist to raise problems with Spearman's work was Cyril Burt, who noted that mental effort was not factored into his analysis.[26] Burt marshalled a larger set of data and showed that more factors than a single general factor were required to explain the correlations: the law of tetrad differences was not satisfied by the data.[5]:31[25]:213–214It was shown that correlations between certain pairs of tests were much higher than expected on Spearman's theory that their only common factor was general intelligence.[19]:13 Spearman knew about these problems as early as 1906, but attempted to dismiss the criticism by proposing that these higher than expected correlations were because the tests weren't meaningfully distinct.[5]:31[19]:13 In subsequent years, many other psychologists showed a wider array of factors was needed to explain various sets of data: Spearman's two-factory theory didn't explain the correlations.[5]:18:32[25]:213–214
Other psychologists like Thomson provided alternative explanations for the same phenomena that he used to support the concept with what is now known as sampling theory.[4][27] Thomson accepted Spearman's data and methodology of factor analysis, but interpreted the results differently.[28]:3–4 He proposed that the mind was composed of innumerable independent bonds or units and any test sampled some subset of these bonds.[19]:10Simultaneous to Spearman's development of his theory of g was an alternative theory from Godfrey Thomson and Edward Thorndike who proposed that the positive intercorrelation of tests (positive manifold) was compatible with a theory of many common factors. Thorndike argued that performance on cognitive tests drew from numerous cognitive processes and that different cognitive tests draw from these different processes and can produce positive correlations as observed in test batteries.[25]:219–220
Despite these issues, Spearman's theory garnered early support. Lewis Terman, Stanford professor of psychology, drew upon Spearman's "general intelligence factor" when he revised Alfred Binet's intelligence scales to develop the Stanford-Binet Scales for American children.[28]:3
The Abilities of Man
Spearman's 1927 book The Abilities of Man attempted to provide a comprehensive account of human intelligence, responding to his critics and compiling evidence in favor of his theory. He now argued that general intelligence was a reflection of "mental energy" that flowed throughout the brain, but different neural systems served as "mental engines" that explain the specific factors.[25]:214–215 He also refined his concept of "g", not as equivalent to as concrete entity or synonym for intelligence, but as a magnitude that is identified as the common factor that underlies all mental abilities, and could be identified with tests of the tetrad equation.[25]:215–216 By now, he reluctantly accepted the existence of group factors in addition to his general factor and specific factors.[5]:32 Following recognition that the arguments in his book did not sufficiently respond to critics evidence that not all data satisfied the tetrad condition, he put forth a different theory: that g was reflected in every ability measure and that this was proven by the positive correlations between tests of abilities, known as the "indifference of the indicator".[25]:218 This shift between theories has been noted as transforming "g" from a falsifiable hypothesis to an unfalsifiable result of mathematical necessity.[23]:198-199[29]:10
Another early criticism raised of the g theory was factor indeterminacy.[30][31]:275–276,376 In a review of Spearman's Ability of Man, Edwin Wilson pointed out that Spearman's theory did not define g uniquely because it proposed more independent factors than observed psychological tests.[23]:194–195 and it was possible to generate a different set of factor scores for a set of students that reproduces the same correlation matrix.[22]:382–383[20]:237
In response to these criticisms, some psychologists tried to rescue Spearman's theory by producing batteries of tests that would reflect g without introducing specific factor overlap that produces common factors other than g. Invariably these attempts failed and psychologists acknowledged that many common factors were needed to explain correlations between tests, as many as one third as many factors as tests in a battery.[23]:195[25]:220–221
Later theories
In 1938, Louis Thurstone developed a theory of intelligence contrary to both Spearman and Thomson.[19]:14[32]:14 He, like Thomson, proposed that there were separate factors that were unrelated to each other,[19] but he proposed a smaller set of just seven primary mental abilities.[32]:14 Thurstone developed the method of multiple factor analysis to identify the number of factors needed to explain a matrix of observed correlations.[19]:14 His early results using orthogonal factors identified as many as 13 factors, which he believed conclusively refuted Spearman's theory, though a reanalysis of his results showed that Spearman's g theory could explain the data as well.[19]:15–16 Later Thurstone abandoned the idea of completely independent factors and posited correlated factors, analyzing test data using oblique factor analysis but left him without a strong criticism of Spearman's theory.[19]:16–17 After the 1940s, studies using Thurstone's methods proliferated, identifying increasing numbers of mental abilities.[25]:232 One example was Joy Paul Guilford's "Structure-of-Intellectual" model which proposed 3 facets of ability - contents, products, operations - that can be composed in different ways to obtain 150 different abilities.[5]:115[33]:10 Lloyd Humphries argued that following Thurstone's publications, "psychometrists and factor analysts have tended to lose sight of the general factor in intelligence".[34]
By 1941, Raymond Cattell, who had worked with Spearman, proposed a two common factor theory of intelligence.[25]:228 Cattell's theory proposed two high level factors: Gc (crystallized intelligence) that reflected learned knowledge and general information and Gf (fluid intelligence) that closely resembled Spearman's conceptualization of g.[25]:228–229 Since proposing these factors, Cattell and his student John Horn proposed a number of other 'general factors' or 'broad factors' like Gs (visual inspection speed), Ga (auditory thinking), Gv (visual-spatial reasoning), Gq (quantitative reasoning), Gr (fluency in recall).[5]:124 Their theory is what Arthur Jensen calls a "truncated hierarchy", as it extracts many factors but not one unitary "general" factor on top of the hierarchy.[5]:124
Jensen
Jensen mounted defenses of the g-factor from its many critics over the course of his career. His first major work How Much Can We Boost IQ and Scholastic Achievement? described Spearman's development of the concept of "general intelligence" in support of what Urbach calls the "hard core of the hereditarian program".[35]:9[36]:65[37] In the dispute among psychometricians over general intelligence, Jensen fiercely argued for its existence,[38]:397 presenting it as a fact that no self-respecting psychometrician could deny.[38]:398 In that article, Jensen presented a hierarchical model of intelligence, where abilities operate two levels: Level I and Level II.[35]:110[39]:65 In his later work The g Factor: The Science of Mental Ability, Jensen offered an extensive synthesis of a large body of research to argue that g is a legitimate scientific construct based in human biology with far-reaching effects on human life.[40][41]
In some ways, Arthur Jensen resuscitated Spearman's g theory,[28]:50[42]:7 but his arguments reflect a marked shift from Spearman's theory of factors to its replacement with principal components.[23]:199[42]
Measurement
An illustration of Spearman's two-factor intelligence theory. Each small oval is a hypothetical mental test. The blue areas correspond to test-specific variance (s), while the purple areas represent the variance attributed to g.
Factor analysis is a family of mathematical techniques that can be used to represent correlations between intelligence tests in terms of a smaller number of variables known as factors. The purpose is to simplify the correlation matrix by using hypothetical underlying factors to explain the patterns in it. When all correlations in a matrix are positive, as they are in the case of IQ, factor analysis will yield a general factor common to all tests. The general factor of IQ tests is referred to as the g factor, and it typically accounts for 40 to 50 percent of the variance in IQ test batteries.[43] The presence of correlations between many widely varying cognitive tests has often been taken as evidence for the existence of g, but mathematically the correlations do not provide any more or less support for the existence of g than for the existence of multiple factors of intelligence.[44]
Charles Spearman developed factor analysis in order to study correlations between tests. Initially, he developed a model of intelligence in which variations in all intelligence test scores are explained by only two kinds of variables: first, factors that are specific to each test (denoted s); and second, a g factor that accounts for the positive correlations across tests. This is known as Spearman's two-factor theory. Later research based on more diverse test batteries than those used by Spearman demonstrated that g alone could not account for all correlations between tests. Specifically, it was found that even after controlling for g, some tests were still correlated with each other. This led to the postulation of group factors that represent variance that groups of tests with similar task demands (e.g., verbal, spatial, or numerical) have in common in addition to the shared g variance.[45]
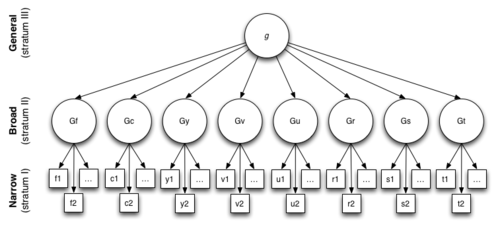
An illustration of John B. Carroll's three stratum theory, an influential contemporary model of cognitive abilities. The broad abilities recognized by the model are fluid intelligence (Gf), crystallized intelligence (Gc), general memory and learning (Gy), broad visual perception (Gv), broad auditory perception (Gu), broad retrieval ability (Gr), broad cognitive speediness (Gs), and processing speed (Gt). Carroll regarded the broad abilities as different "flavors" of g.
Through factor rotation, it is, in principle, possible to produce an infinite number of different factor solutions that are mathematically equivalent in their ability to account for the intercorrelations among cognitive tests. These include solutions that do not contain a g factor. Thus factor analysis alone cannot establish what the underlying structure of intelligence is. In choosing between different factor solutions, researchers have to examine the results of factor analysis together with other information about the structure of cognitive abilities.[46]
There are many psychologically relevant reasons for preferring factor solutions that contain a g factor. These include the existence of the positive manifold, the fact that certain kinds of tests (generally the more complex ones) have consistently larger g loadings, the substantial invariance of g factors across different test batteries, the impossibility of constructing test batteries that do not yield a g factor, and the widespread practical validity of g as a predictor of individual outcomes. The g factor, together with group factors, best represents the empirically established fact that, on average, overall ability differences between individuals are greater than differences among abilities within individuals, while a factor solution with orthogonal factors without g obscures this fact. Moreover, g appears to be the most heritable component of intelligence.[47] Research utilizing the techniques of confirmatory factor analysis has also provided support for the existence of g.[46]
A g factor can be computed from a correlation matrix of test results using several different methods. These include exploratory factor analysis, principal components analysis (PCA), and confirmatory factor analysis. Different factor-extraction methods produce highly consistent results, although PCA has sometimes been found to produce inflated estimates of the influence of g on test scores.[16][48]
While the existence of g as a statistical regularity is well-established and uncontroversial among experts, there is no consensus as to what causes the positive intercorrelations. Several explanations have been proposed.[49]
Mental energy or efficiency
Charles Spearman reasoned that correlations between tests reflected the influence of a common causal factor, a general mental ability that enters into performance on all kinds of mental tasks. However, he thought that the best indicators of g were those tests that reflected what he called the eduction of relations and correlates, which included abilities such as deduction, induction, problem solving, grasping relationships, inferring rules, and spotting differences and similarities. Spearman hypothesized that g was equivalent with "mental energy". However, this was more of a metaphorical explanation, and he remained agnostic about the physical basis of this energy, expecting that future research would uncover the exact physiological nature of g.[50]
Following Spearman, Arthur Jensen maintained that all mental tasks tap into g to some degree. According to Jensen, the g factor represents a "distillate" of scores on different tests rather than a summation or an average of such scores, with factor analysis acting as the distillation procedure.[15] He argued that g cannot be described in terms of the item characteristics or information content of tests, pointing out that very dissimilar mental tasks may have nearly equal g loadings. Wechsler similarly contended that g is not an ability at all but rather some general property of the brain. Jensen hypothesized that g corresponds to individual differences in the speed or efficiency of the neural processes associated with mental abilities.[51] He also suggested that given the associations between g and elementary cognitive tasks, it should be possible to construct a ratio scale test of g that uses time as the unit of measurement.[52]
Sampling theory
The so-called sampling theory of g, originally developed by Edward Thorndike and Godfrey Thomson, proposes that the existence of the positive manifold can be explained without reference to a unitary underlying capacity. According to this theory, there are a number of uncorrelated mental processes, and all tests draw upon different samples of these processes. The inter correlations between tests are caused by an overlap between processes tapped by the tests.[53][54] Thus, the positive manifold arises due to a measurement problem, an inability to measure more fine-grained, presumably uncorrelated mental processes.[12]
It has been shown that it is not possible to distinguish statistically between Spearman's model of g and the sampling model; both are equally able to account for inter correlations among tests.[55] The sampling theory is also consistent with the observation that more complex mental tasks have higher g loading, because more complex tasks are expected to involve a larger sampling of neural elements and therefore have more of them in common with other tasks.[56]
Some researchers have argued that the sampling model invalidates g as a psychological concept, because the model suggests that g factors derived from different test batteries simply reflect the shared elements of the particular tests contained in each battery rather than a g that is common to all tests. Similarly, high correlations between different batteries could be due to them measuring the same set of abilities rather than the same ability.[57]
Critics have argued that the sampling theory is incongruent with certain empirical findings. Based on the sampling theory, one might expect that related cognitive tests share many elements and thus be highly correlated. However, some closely related tests, such as forward and backward digit span, are only modestly correlated, while some seemingly completely dissimilar tests, such as vocabulary tests and Raven's matrices, are consistently highly correlated. Another problematic finding is that brain damage frequently leads to specific cognitive impairments rather than a general impairment one might expect based on the sampling theory.[12][58]
Mutualism
The "mutualism" model of g proposes that cognitive processes are initially uncorrelated, but that the positive manifold arises during individual development due to mutual beneficial relations between cognitive processes. Thus there is no single process or capacity underlying the positive correlations between tests. During the course of development, the theory holds, any one particularly efficient process will benefit other processes, with the result that the processes will end up being correlated with one another. Thus similarly high IQs in different persons may stem from quite different initial advantages that they had.[12][59] Critics have argued that the observed correlations between the g loadings and the heritability coefficients of subtests are problematic for the mutualism theory.[60]
Raymond Cattell, a student of Charles Spearman's, modified the unitary g factor model and divided g into two broad, relatively independent domains: fluid intelligence (Gf) and crystallized intelligence (Gc). Gf is conceptualized as a capacity to figure out novel problems, and it is best assessed with tests with little cultural or scholastic content, such as Raven's matrices. Gc can be thought of as consolidated knowledge, reflecting the skills and information that an individual acquires and retains throughout his or her life. Gc is dependent on education and other forms of acculturation, and it is best assessed with tests that emphasize scholastic and cultural knowledge.[2][61][62] Gf can be thought to primarily consist of current reasoning and problem solving capabilities, while Gc reflects the outcome of previously executed cognitive processes.[63]
The rationale for the separation of Gf and Gc was to explain individuals' cognitive development over time. While Gf and Gc have been found to be highly correlated, they differ in the way they change over a lifetime. Gf tends to peak at around age 20, slowly declining thereafter. In contrast, Gc is stable or increases across adulthood. A single general factor has been criticized as obscuring this bifurcated pattern of development. Cattell argued that Gf reflected individual differences in the efficiency of the central nervous system. Gc was, in Cattell's thinking, the result of a person "investing" his or her Gf in learning experiences throughout life.[2][57][61][64]
Cattell, together with John Horn, later expanded the Gf-Gc model to include a number of other broad abilities, such as Gq (quantitative reasoning) and Gv (visual-spatial reasoning). While all the broad ability factors in the extended Gf-Gc model are positively correlated and thus would enable the extraction of a higher order g factor, Cattell and Horn maintained that it would be erroneous to posit that a general factor underlies these broad abilities. They argued that g factors computed from different test batteries are not invariant and would give different values of g, and that the correlations among tests arise because it is difficult to test just one ability at a time.[2][65][66]
However, several researchers have suggested that the Gf-Gc model is compatible with a g-centered understanding of cognitive abilities. For example, John B. Carroll's three-stratum model of intelligence includes both Gf and Gc together with a higher-order g factor. Based on factor analyses of many data sets, some researchers have also argued that Gf and g are one and the same factor and that g factors from different test batteries are substantially invariant provided that the batteries are large and diverse.[61][67][68]
Theories of uncorrelated abilities
Several theorists have proposed that there are intellectual abilities that are uncorrelated with each other. Among the earliest was L.L. Thurstone who created a model of primary mental abilities representing supposedly independent domains of intelligence. However, Thurstone's tests of these abilities were found to produce a strong general factor. He argued that the lack of independence among his tests reflected the difficulty of constructing "factorially pure" tests that measured just one ability. Similarly, J.P. Guilford proposed a model of intelligence that comprised up to 180 distinct, uncorrelated abilities, and claimed to be able to test all of them. Later analyses have shown that the factorial procedures Guilford presented as evidence for his theory did not provide support for it, and that the test data that he claimed provided evidence against g did in fact exhibit the usual pattern of intercorrelations after correction for statistical artifacts.[69][70]
Gardner's theory of multiple intelligences
More recently, Howard Gardner has developed the theory of multiple intelligences. He posits the existence of nine different and independent domains of intelligence, such as mathematical, linguistic, spatial, musical, bodily-kinesthetic, meta-cognitive, and existential intelligences, and contends that individuals who fail in some of them may excel in others. According to Gardner, tests and schools traditionally emphasize only linguistic and logical abilities while neglecting other forms of intelligence.
While popular among educationalists, Gardner's theory has been much criticized by psychologists and psychometricians. One criticism is that the theory contradicts both scientific and everyday usages of the word intelligence. Several researchers have argued that not all of Gardner's intelligences fall within the cognitive sphere. For example, Gardner contends that a successful career in professional sports or popular music reflects bodily-kinesthetic intelligence and musical intelligence, respectively, even though one might usually talk of athletic and musical skills, talents, or abilities instead.
Another criticism of Gardner's theory is that many of his purportedly independent domains of intelligence are in fact correlated with each other. Responding to empirical analyses showing correlations between the domains, Gardner has argued that the correlations exist because of the common format of tests and because all tests require linguistic and logical skills. His critics have in turn pointed out that not all IQ tests are administered in the paper-and-pencil format, that aside from linguistic and logical abilities, IQ test batteries contain also measures of, for example, spatial abilities, and that elementary cognitive tasks (for example, inspection time and reaction time) that do not involve linguistic or logical reasoning correlate with conventional IQ batteries, too.[71][72][73][74]
Sternberg's three classes of intelligence
Robert Sternberg, working with various colleagues, has also suggested that intelligence has dimensions independent of g. He argues that there are three classes of intelligence: analytic, practical, and creative. According to Sternberg, traditional psychometric tests measure only analytic intelligence, and should be augmented to test creative and practical intelligence as well. He has devised several tests to this effect. Sternberg equates analytic intelligence with academic intelligence, and contrasts it with practical intelligence, defined as an ability to deal with ill-defined real-life problems. Tacit intelligence is an important component of practical intelligence, consisting of knowledge that is not explicitly taught but is required in many real-life situations. Assessing creativity independent of intelligence tests has traditionally proved difficult, but Sternberg and colleagues have claimed to have created valid tests of creativity, too.
The validation of Sternberg's theory requires that the three abilities tested are substantially uncorrelated and have independent predictive validity. Sternberg has conducted many experiments which he claims confirm the validity of his theory, but several researchers have disputed this conclusion. For example, in his reanalysis of a validation study of Sternberg's STAT test, Nathan Brody showed that the predictive validity of the STAT, a test of three allegedly independent abilities, was almost solely due to a single general factor underlying the tests, which Brody equated with the g factor.[75][76]
Flynn's model
James Flynn has argued that intelligence should be conceptualized at three different levels: brain physiology, cognitive differences between individuals, and social trends in intelligence over time. According to this model, the g factor is a useful concept with respect to individual differences but its explanatory power is limited when the focus of investigation is either brain physiology, or, especially, the effect of social trends on intelligence. Flynn has criticized the notion that cognitive gains over time, or the Flynn effect, are "hollow" if they cannot be shown to be increases in g. He argues that the Flynn effect reflects shifting social priorities and individuals' adaptation to them. To apply the individual differences concept of g to the Flynn effect is to confuse different levels of analysis. On the other hand, according to Flynn, it is also fallacious to deny, by referring to trends in intelligence over time, that some individuals have "better brains and minds" to cope with the cognitive demands of their particular time. At the level of brain physiology, Flynn has emphasized both that localized neural clusters can be affected differently by cognitive exercise, and that there are important factors that affect all neural clusters.[77]
Related theories
"Indifference of the indicator"
Spearman proposed the principle of the indifference of the indicator, according to which the precise content of intelligence tests is unimportant for the purposes of identifying g, because g enters into performance on all kinds of tests. Any test can therefore be used as an indicator of g.[78] Following Spearman, Arthur Jensen more recently argued that a g factor extracted from one test battery will always be the same, within the limits of measurement error, as that extracted from another battery, provided that the batteries are large and diverse.[79] According to this view, every mental test, no matter how distinctive, calls on g to some extent. Thus a composite score of a number of different tests will load onto g more strongly than any of the individual test scores, because the g components cumulate into the composite score, while the uncorrelated non-g components will cancel each other out. Theoretically, the composite score of an infinitely large, diverse test battery would, then, be a perfect measure of g.[80]
In contrast, L. L. Thurstone argued that a g factor extracted from a test battery reflects the average of all the abilities called for by the particular battery, and that g therefore varies from one battery to another and "has no fundamental psychological significance."[81] Along similar lines, John Horn argued that g factors are meaningless because they are not invariant across test batteries, maintaining that correlations between different ability measures arise because it is difficult to define a human action that depends on just one ability.[65][82]
To show that different batteries reflect the same g, one must administer several test batteries to the same individuals, extract g factors from each battery, and show that the factors are highly correlated. This can be done within a confirmatory factor analysis framework.[49] Wendy Johnson and colleagues have published two such studies[83][84] finding correlations between g factors extracted from different batteries between .95–1.00 for most batteries, while the correlations ranged from .79 to .96 for the Cattell Culture Fair Intelligence Test (the CFIT). They attributed the somewhat lower correlations with the CFIT battery to its lack of content diversity for it contains only matrix-type items, and interpreted the findings as supporting the contention that g factors derived from different test batteries are the same provided that the batteries are diverse enough. This approach has been criticized by psychologist Lazar Stankov in the Handbook of Understanding and Measuring Intelligence, who concluded "Correlations between the g factors from different test batteries are not unity."[85]
A study authored by Scott Barry Kaufman and colleagues showed that the general factor extracted from the Woodjock-Johnson cognitive abilities test, and the general factor extracted from the Achievement test batteries are highly correlated, but not isomorphic.[86]
Spearman's law of diminishing returns
A number of researchers have suggested that the proportion of variation accounted for by g may not be uniform across all subgroups within a population. Spearman's law of diminishing returns (SLODR), also termed the cognitive ability differentiation hypothesis, predicts that the positive correlations among different cognitive abilities are weaker among more intelligent subgroups of individuals. More specifically, SLODR predicts that the g factor will account for a smaller proportion of individual differences in cognitive tests scores at higher scores on the g factor.
SLODR was originally proposed in 1927 by Charles Spearman,[87] who reported that the average correlation between 12 cognitive ability tests was .466 in 78 normal children, and .782 in 22 "defective" children. Detterman and Daniel rediscovered this phenomenon in 1989.[88] They reported that for subtests of both the WAIS and the WISC, subtest intercorrelations decreased monotonically with ability group, ranging from approximately an average intercorrelation of .7 among individuals with IQs less than 78 to .4 among individuals with IQs greater than 122.[89]
SLODR has been replicated in a variety of child and adult samples who have been measured using broad arrays of cognitive tests. The most common approach has been to divide individuals into multiple ability groups using an observable proxy for their general intellectual ability, and then to either compare the average interrelation among the subtests across the different groups, or to compare the proportion of variation accounted for by a single common factor, in the different groups.[90] However, as both Deary et al. (1996)[90] and Tucker-Drob (2009)[91] have pointed out, dividing the continuous distribution of intelligence into an arbitrary number of discrete ability groups is less than ideal for examining SLODR. Tucker-Drob (2009)[91] extensively reviewed the literature on SLODR and the various methods by which it had been previously tested, and proposed that SLODR could be most appropriately captured by fitting a common factor model that allows the relations between the factor and its indicators to be nonlinear in nature. He applied such a factor model to a nationally representative data of children and adults in the United States and found consistent evidence for SLODR. For example, Tucker-Drob (2009) found that a general factor accounted for approximately 75% of the variation in seven different cognitive abilities among very low IQ adults, but only accounted for approximately 30% of the variation in the abilities among very high IQ adults.
A recent meta-analytic study by Blum and Holling[92] also provided support for the differentiation hypothesis. As opposed to most research on the topic, this work made it possible to study ability and age variables as continuous predictors of the g saturation, and not just to compare lower- vs. higher-skilled or younger vs. older groups of testees. Results demonstrate that the mean correlation and g loadings of cognitive ability tests decrease with increasing ability, yet increase with respondent age. SLODR, as described by Charles Spearman, could be confirmed by a g-saturation decrease as a function of IQ as well as a g-saturation increase from middle age to senescence. Specifically speaking, for samples with a mean intelligence that is two standard deviations (i.e., 30 IQ-points) higher, the mean correlation to be expected is decreased by approximately .15 points. The question remains whether a difference of this magnitude could result in a greater apparent factorial complexity when cognitive data are factored for the higher-ability sample, as opposed to the lower-ability sample. It seems likely that greater factor dimensionality should tend to be observed for the case of higher ability, but the magnitude of this effect (i.e., how much more likely and how many more factors) remains uncertain.
Evidence of a general factor of intelligence has also been observed in non-human animals. Studies have shown that g is responsible for 47% of the variance at the species level in primates[93] and around 55% of the individual variance observed in mice.[94][95] A review and meta-analysis of general intelligence, however, found that the average correlation among cognitive abilities was 0.18 and suggested that overall support for g is weak in non-human animals.[96]
Although it is not assessable using the same intelligence measures used in humans, cognitive ability can be measured with a variety of interactive and observational tools focusing on innovation, habit reversal, social learning, and responses to novelty. Non-human models of g such as mice are used to study genetic influences on intelligence and neurological developmental research into the mechanisms behind and biological correlates of g.[97]
Similar to g for individuals, a new research path aims to extract a general collective intelligence factor c for groups displaying a group's general ability to perform a wide range of tasks.[98] Definition, operationalization and statistical approach for this c factor are derived from and similar to g. Causes, predictive validity as well as additional parallels to g are investigated.[99]
g has a number of correlates in the brain. Studies using magnetic resonance imaging (MRI) have established that g and total brain volume are moderately correlated (r~.3–.4). External head size has a correlation of ~.2 with g. MRI research on brain regions indicates that the volumes of frontal, parietal and temporal cortices, and the hippocampus are also correlated with g, generally at .25 or more, while the correlations, averaged over many studies, with overall grey matter and overall white matter have been found to be .31 and .27, respectively. Some but not all studies have also found positive correlations between g and cortical thickness. However, the underlying reasons for these associations between the quantity of brain tissue and differences in cognitive abilities remain largely unknown.[2]
Most researchers believe that intelligence cannot be localized to a single brain region, such as the frontal lobe. Brain lesion studies have found small but consistent associations indicating that people with more white matter lesions tend to have lower cognitive ability. Research utilizing NMR spectroscopy has discovered somewhat inconsistent but generally positive correlations between intelligence and white matter integrity, supporting the notion that white matter is important for intelligence.[2]
Some research suggests that aside from the integrity of white matter, also its organizational efficiency is related to intelligence. The hypothesis that brain efficiency has a role in intelligence is supported by functional MRI research showing that more intelligent people generally process information more efficiently, i.e., they use fewer brain resources for the same task than less intelligent people.[2]
Heritability is the proportion of phenotypic variance in a trait in a population that can be attributed to genetic factors. The heritability of g has been estimated to fall between 40 and 80 percent using twin, adoption, and other family study designs as well as molecular genetic methods. Estimates based on the totality of evidence place the heritability of g at about 50%.[102] It has been found to increase linearly with age.
As with heritability in general, the heritability of g can be understood in reference to a specific population at a specific place and time, and findings for one population do not apply to a different population that is exposed to different environmental factors.[103] A population that is exposed to strong environmental factors can be expected to have a lower level of heritability than a population that is exposed to only weak environmental factors. For example, one twin study found that genotype differences almost completely explain the variance in IQ scores within affluent families, but make close to zero contribution towards explaining IQ score differences in impoverished families.[104] Notably, heritability findings also only refer to total variation within a population and do not support a genetic explanation for differences between groups.[105] It is theoretically possible for the differences between the average g of two groups to be 100% due to environmental factors even if the variance within each group is 100% heritable.
Much research points to g being a highly polygenic trait influenced by many common genetic variants, each having only small effects. Another possibility is that heritable differences in g are due to individuals having different "loads" of rare, deleterious mutations, with genetic variation among individuals persisting due to mutation–selection balance.[106][107]
Cross-cultural studies indicate that the g factor can be observed whenever a battery of diverse, complex cognitive tests is administered to a human sample. In some studies, the factor structure of IQ tests has also been found to be consistent across sexes and ethnic groups in the U.S. and elsewhere.[101]
Most studies suggest that there are negligible differences in the mean level of g between the sexes, but that sex differences in cognitive abilities are to be found in more narrow domains. For example, males generally outperform females in spatial tasks, while females generally outperform males in verbal tasks.[108] Another difference that has been found in many studies is that males show more variability in both general and specific abilities than females, with proportionately more males at both the low end and the high end of the test score distribution.[109]
Differences in g between racial and ethnic groups have been found, particularly in the U.S. between black- and white-identifying test takers, though these differences appear to have diminished significantly over time,[110] and to be attributable to environmental (rather than genetic) causes.[110][111] Some researchers have suggested that the magnitude of the black-white gap in cognitive test results is dependent on the magnitude of the test's g loading, with tests showing higher g loading producing larger gaps (see Spearman's hypothesis),[112] while others have criticized this view as methodologically unfounded.[113][114] Still others have noted that despite the increasing g loading of IQ test batteries over time, the performance gap between racial groups continues to diminish.[110] Comparative analysis has shown that while a gap of approximately 1.1 standard deviation in mean IQ (around 16 points) between white and black Americans existed in the late 1960s, between 1972 and 2002 black Americans gained between 4 and 7 IQ points relative to non-Hispanic Whites, and that "the g gap between Blacks and Whites declined virtually in tandem with the IQ gap."[110] In contrast, Americans of East Asian descent generally slightly outscore white Americans.[115] It has been claimed that racial and ethnic differences similar to those found in the U.S. can be observed globally,[116] but the significance, methodological grounding, and truth of such claims have all been disputed.[117][118][119][120][121]
An illustration of the Jensen box, an apparatus for measuring choice reaction time
Elementary cognitive tasks (ECTs) also correlate strongly with g. ECTs are, as the name suggests, simple tasks that apparently require very little intelligence, but still correlate strongly with more exhaustive intelligence tests. Determining whether a light is red or blue and determining whether there are four or five squares drawn on a computer screen are two examples of ECTs. The answers to such questions are usually provided by quickly pressing buttons. Often, in addition to buttons for the two options provided, a third button is held down from the start of the test. When the stimulus is given to the subject, they remove their hand from the starting button to the button of the correct answer. This allows the examiner to determine how much time was spent thinking about the answer to the question (reaction time, usually measured in small fractions of second), and how much time was spent on physical hand movement to the correct button (movement time). Reaction time correlates strongly with g, while movement time correlates less strongly.[122] ECT testing has allowed quantitative examination of hypotheses concerning test bias, subject motivation, and group differences. By virtue of their simplicity, ECTs provide a link between classical IQ testing and biological inquiries such as fMRI studies.
Working memory
One theory holds that g is identical or nearly identical to working memory capacity. Among other evidence for this view, some studies have found factors representing g and working memory to be perfectly correlated. However, in a meta-analysis the correlation was found to be considerably lower.[123] One criticism that has been made of studies that identify g with working memory is that "we do not advance understanding by showing that one mysterious concept is linked to another."[124]
Piagetian tasks
Psychometric theories of intelligence aim at quantifying intellectual growth and identifying ability differences between individuals and groups. In contrast, Jean Piaget's theory of cognitive development seeks to understand qualitative changes in children's intellectual development. Piaget designed a number of tasks to verify hypotheses arising from his theory. The tasks were not intended to measure individual differences, and they have no equivalent in psychometric intelligence tests.[125][126] For example, in one of the best-known Piagetian conservation tasks a child is asked if the amount of water in two identical glasses is the same. After the child agrees that the amount is the same, the investigator pours the water from one of the glasses into a glass of different shape so that the amount appears different although it remains the same. The child is then asked if the amount of water in the two glasses is the same or different.
Notwithstanding the different research traditions in which psychometric tests and Piagetian tasks were developed, the correlations between the two types of measures have been found to be consistently positive and generally moderate in magnitude. A common general factor underlies them. It has been shown that it is possible to construct a battery consisting of Piagetian tasks that is as good a measure of g as standard IQ tests.[125][127]
The traditional view in psychology is that there is no meaningful relationship between personality and intelligence, and that the two should be studied separately. Intelligence can be understood in terms of what an individual can do, or what his or her maximal performance is, while personality can be thought of in terms of what an individual will typically do, or what his or her general tendencies of behavior are. Large-scale meta-analyses have found that there are hundreds of connections >.20 in magnitude between cognitive abilities and personality traits across the Big Five. This is despite the fact that correlations with the global Big Five factors themselves being small, except for Openness (.26).[128] More interesting relations emerge at other levels (e.g., .23 for the activity facet of extraversion with general mental ability, -.29 for the uneven-tempered facet of neuroticism, .32 for the industriousness aspect of conscientiousness, .26 for the compassion aspect of agreeableness).[129]
The associations between intelligence and personality have generally been interpreted in two main ways. The first perspective is that personality traits influence performance on intelligence tests. For example, a person may fail to perform at a maximal level on an IQ test due to his or her anxiety and stress-proneness. The second perspective considers intelligence and personality to be conceptually related, with personality traits determining how people apply and invest their cognitive abilities, leading to knowledge expansion and greater cognitive differentiation.[130][131] Other theories (e.g., Cybernetic Trait Complexes Theory) view personality and cognitive ability as intertwined parameters of individuals that co-evolved and are also co-influenced during development (e.g., by early life starvation).[132]
Creativity
Some researchers believe that there is a threshold level of g below which socially significant creativity is rare, but that otherwise there is no relationship between the two. It has been suggested that this threshold is at least one standard deviation above the population mean. Above the threshold, personality differences are believed to be important determinants of individual variation in creativity.[133][134]
Others have challenged the threshold theory. While not disputing that opportunity and personal attributes other than intelligence, such as energy and commitment, are important for creativity, they argue that g is positively associated with creativity even at the high end of the ability distribution. The longitudinal Study of Mathematically Precocious Youth has provided evidence for this contention. It has shown that individuals identified by standardized tests as intellectually gifted in early adolescence accomplish creative achievements (for example, securing patents or publishing literary or scientific works) at several times the rate of the general population, and that even within the top 1 percent of cognitive ability, those with higher ability are more likely to make outstanding achievements. The study has also suggested that the level of g acts as a predictor of the level of achievement, while specific cognitive ability patterns predict the realm of achievement.[135][136]
Criticism
Connection with eugenics and racialism
Research on the G-factor, as well as other psychometric values, has been widely criticized for not properly taking into account the eugenicist background of its research practices.[137] The reductionism of the G-factor has been attributed to having evolved from pseudoscientific theories about race and intelligence.[138] Spearman's g and the concept of inherited, immutable intelligence were a boon for eugenicists and pseudoscientists alike.[139]
Joseph L. Graves Jr. and Amanda Johnson have argued that g "...is to the psychometricians what Huygens' ether was to early physicists: a nonentity taken as an article of faith instead of one in need of verification by real data."[140]
Some scientists have described the g factor, and psychometrics, as forms of pseudoscience.[141]
Conceptual critiques
Paleontologist and biologist Stephen Jay Gould presented a critique in his 1981 book The Mismeasure of Man. He argued that psychometricians fallaciously reified the g factor into an ineluctable "thing" that provided a convenient explanation for human intelligence, grounded only in mathematical theory rather than the rigorous application of mathematical theory to biological knowledge.[24] An example is provided in the work of Cyril Burt, published posthumously in 1972: "The two main conclusions we have reached seem clear and beyond all question. The hypothesis of a general factor entering into every type of cognitive process, tentatively suggested by speculations derived from neurology and biology, is fully borne out by the statistical evidence; and the contention that differences in this general factor depend largely on the individual's genetic constitution appears incontestable.The concept of an innate, general cognitive ability, which follows from these two assumptions, though admittedly sheerly an abstraction, is thus wholly consistent with the empirical facts."[142]
Several researchers have criticized Gould's arguments. For example, they have rejected the accusation of reification, maintaining that the use of extracted factors such as g as potential causal variables whose reality can be supported or rejected by further investigations constitutes a normal scientific practice that in no way distinguishes psychometrics from other sciences. Critics have also suggested that Gould did not understand the purpose of factor analysis, and that he was ignorant of relevant methodological advances in the field. While different factor solutions may be mathematically equivalent in their ability to account for intercorrelations among tests, solutions that yield a g factor are psychologically preferable for several reasons extrinsic to factor analysis, including the phenomenon of the positive manifold, the fact that the same g can emerge from quite different test batteries, the widespread practical validity of g, and the linkage of g to many biological variables.[46][47][pageneeded]
John Horn and John McArdle have argued that the modern g theory, as espoused by, for example, Arthur Jensen, is unfalsifiable, because the existence of a common factor like g follows tautologically from positive correlations among tests. They contrasted the modern hierarchical theory of g with Spearman's original two-factor theory which was readily falsifiable (and indeed was falsified).[25]
↑Adapted from Jensen 1998, 24. The correlation matrix was originally published in Spearman 1904, and it is based on the school performance of a sample of English children. While this analysis is historically important and has been highly influential, it does not meet modern technical standards. See Mackintosh 2011, 44ff. and Horn & McArdle 2007 for discussion of Spearman's methods.
12Schonemann, Peter (2006). "Jensen's g: Outmoded Theories and Unconquered Frontiers". In Modgil, Sohan; Mogdil, Cecil (eds.). Arthur Jensen: Consensus And Controversy. Hoboken: Taylor and Francis. ISBN978-1-85000-093-8.
123456Schonemann, Peter (2005). "Psychometrics of Intelligence". In Kempf Leonard, Kimberly (ed.). Encyclopedia of social measurement. Amsterdam London: Elsevier/Academic Press. ISBN978-0-12-369398-3.
12Gould, Stephen Jay (1981). The Mismeasure of Man. New York, NY: W.W. Norton & Company. p.273. OCLC470800842.
123456789101112Horn, John; McArdle, John (2007). "Understanding Human Intelligence". In Cudeck, Robert; MacCallum, Robert C. (eds.). Factor analysis at 100: historical developments and future directions. Mahwah, N.J: Lawrence Erlbaum Associates. ISBN978-0-8058-6212-6.
123Li, Rex (1996). A theory of conceptual intelligence: thinking, learning, creativity, and giftedness (1sted.). Westport, Conn.: Praeger. ISBN978-0-275-95326-3.
↑Steiger, James; Schonemann, Peter (1978). "A History of Factor Indeterminacy"(PDF). In Shye, Samuel (ed.). Theory construction and data analysis in the behavioral sciences. Jossey-Bass social and behavioral science series (1ed.). San Francisco: Jossey-Bass Publishers. pp.136–178. ISBN978-0-87589-379-2.
↑Mulaik, Stanley A. (2010). Foundations of factor analysis. Chapman & Hall/CRC statistics in the social and behavioral sciences series (2nded.). Boca Raton, Fla.: CRC Press. ISBN978-1-4200-9961-4.
12Sternberg, Robert J. (2020). The nature of intelligence and its development in childhood. Cambridge elements. Elements in child development. Cambridge: Cambridge University Press. ISBN978-1-108-86621-7.
↑Carroll, John Bissell (1993). Human cognitive abilities: a survey of factor-analytic studies. Cambridge: Cambridge University Press. ISBN978-0-511-57131-2.
12Das, J. B. (2004). "Theories of Intelligence: Issues and Application". In Goldstein, Gerald; Beers, Sue R.; Hersen, Michel (eds.). Comprehensive Handbook of Psychological Assessment, Volume 1: Intellectual and Neuropsychological Assessment. John Wiley & Sons. ISBN978-0-471-41611-1.
↑McFarland, Dennis J. (2012). "A single g factor is not necessary to simulate positive correlations between cognitive tests". Journal of Clinical and Experimental Neuropsychology. 34 (4): 378–384. doi:10.1080/13803395.2011.645018. ISSN1744-411X. PMID22260190. S2CID4694545. The fact that diverse cognitive tests tend to be positively correlated has been taken as evidence for a single general ability or "g" factor...the presence of a positive manifold in the correlations between diverse cognitive tests does not provide differential support for either single factor or multiple factor models of general abilities.
↑Jensen 1998, 18–19, 35–36, 38. The idea of a general, unitary mental ability was introduced to psychology by Herbert Spencer and Francis Galton in the latter half of the 19th century, but their work was largely speculative, with little empirical basis.
↑Spearman, C. (1927). The abilities of man. New York: MacMillan.
↑Detterman, D.K.; Daniel, M.H. (1989). "Correlations of mental tests with each other and with cognitive variables are highest for low IQ groups". Intelligence. 13 (4): 349–359. doi:10.1016/s0160-2896(89)80007-8.
↑Locurto, C., & Durkin, E. Problem-solving and individual differences in mice (Mus musculus) using water reinforcement. J Comp Psychol.
↑Locurto, C. & Scanlon, C. Individual differences and a spatial learning factor in two strains of mice (Mus musculus). J. Comp. Psychol. 112, 344–352 (1998).
↑Woolley, Anita Williams; Aggarwal, Ishani; Malone, Thomas W. (1 December 2015). "Collective Intelligence and Group Performance". Current Directions in Psychological Science. 24 (6): 420–424. doi:10.1177/0963721415599543. ISSN0963-7214. S2CID146673541.
↑Shuttleworth-Edwards, Ann B.; Van der Merwe, Adele S. (2002). "WAIS-III and WISC-IV South African Cross-Cultural Normative Data Stratified for Quality of Education". In Ferraro, F. Richard (ed.). Minority and cross-cultural aspects of neuropsychological assessment. Exton, PA: Swets & Zeitlinger. pp.72–75. ISBN90-265-1830-7.
↑Stanek, Kevin C.; Ones, Deniz S. (20 November 2023). Our Constellations. A Primer for "Of Anchors & Sails: Personality-ability trait constellations". United States of America: Pleiades Press.
↑Graves, Joseph L.; Johnson, Amanda (1995). "The Pseudoscience of Psychometry and the Bell Curve". The Journal of Negro Education. 64 (3): 277–294. doi:10.2307/2967209. JSTOR2967209.
↑Cosmides L, Tooby J (2001). "8. Unraveling the Enigma of Human Intelligence: Evolutionary Psychology and the Multimodular Mind". In Sternberg RJ, Kaufman JC (eds.). The Evolution of Intelligence. Mahwah, NJ: Lawrence Erlbaum Associates. pp.145–198. ISBN978-0-585-38085-8.
↑Pinker, Steven (2019). "10. Tech Prophecy and the Underappreciated Causal Power of Ideas". In Brockman, John (ed.). Possible Minds: 25 Ways of Looking at AI. New York: Penguin Press. pp.109–110. ISBN978-0525557999.
Bundled references
Bibliography
Ackerman, P. L.; Beier, M. E.; Boyle, M. O. (2005). "Working memory and intelligence: The same or different constructs?". Psychological Bulletin. 131 (1): 30–60. doi:10.1037/0033-2909.131.1.30. PMID15631550. S2CID14087289.
Brody, N. (2006). Geocentric theory: A valid alternative to Gardner's theory of intelligence. In Schaler J. A. (Ed.), Howard Gardner under fire: The rebel psychologist faces his critics. Chicago: Open Court.
Davidson, J.E. & Kemp, I.A. (2011). Contemporary models of intelligence. In R.J. Sternberg & S.B. Kaufman (Eds.), The Cambridge Handbook of Intelligence. New York, NY: Cambridge University Press.
Deary, I.J.; Pagliari, C. (1991). "The strength of g at different levels of ability: Have Detterman and Daniel rediscovered Spearman's "law of diminishing returns"?". Intelligence. 15 (2): 247–250. doi:10.1016/0160-2896(91)90033-A.
Deary, I.J.; Egan, V.; Gibson, G.J.; Brand, C.R.; Austin, E.; Kellaghan, T. (1996). "Intelligence and the differentiation hypothesis". Intelligence. 23 (2): 105–132. doi:10.1016/S0160-2896(96)90008-2.
Detterman, D.K.; Daniel, M.H. (1989). "Correlations of mental tests with each other and with cognitive variables are highest for low-IQ groups". Intelligence. 13 (4): 349–359. doi:10.1016/S0160-2896(89)80007-8.
Eysenck, H.J. (1995). Creativity as a product of intelligence and personality. In Saklofske, D.H. & Zeidner, M. (Eds.), International Handbook of Personality and Intelligence (pp.231–247). New York, NY, US: Plenum Press.
Flynn, J. (2011). Secular changes in intelligence. Pages 647–665 in R.J. Sternberg & S.B. Kaufman (eds.), Cambridge Handbook of Intelligence. New York, NY: Cambridge University Press.
Gottfredson, L. S. (1998). "Winter). The general intelligence factor". Scientific American Presents. 9 (4): 24–29.
Gottfredson, L. S. (2002). g: Highly general and highly practical. Pages 331–380 in R. J. Sternberg & E. L. Grigorenko (Eds.), The general factor of intelligence: How general is it? Mahwah, NJ: Erlbaum.
Horn, J. L. & McArdle, J.J. (2007). Understanding human intelligence since Spearman. In R. Cudeck & R. MacCallum, (Eds.). Factor Analysis at 100 years (pp.205–247). Mahwah, NJ: Lawrence Erlbaum Associates, Inc.
Humphreys, L.G.; Rich, S.A.; Davey, T.C. (1985). "A Piagetian Test of General Intelligence". Developmental Psychology. 21 (5): 872–877. doi:10.1037/0012-1649.21.5.872.
Hunt, E.B. (2011). Human Intelligence. Cambridge, UK: Cambridge University Press.
Jensen, A.R. (1980). Bias in Mental Testing. New York: The Free Press.
Jensen, A.R. (2002). Psychometric g: Definition and substantiation. In R.J. Sternberg & E.L. Grigorenko (Eds.), General factor of intelligence: How general is it? (pp.39–54). Mahwah, NJ: Erlbaum.
Johnson, W.; Bouchard, T.J.; Krueger, R.F.; McGue, M.; Gottesman, I.I. (2004). "Just one g: Consistent results from three test batteries". Intelligence. 32: 95–107. doi:10.1016/S0160-2896(03)00062-X.
Johnson, W.; te Nijenhuis, J.; Bouchard Jr, T. (2008). "Still just 1 g: Consistent results from five test batteries". Intelligence. 36: 81–95. doi:10.1016/j.intell.2007.06.001.
Judge, T. A.; Jackson, C. L.; Shaw, J. C.; Scott, B. A.; Rich, B. L. (2007). "Self-efficacy and work-related performance: The integral role of individual differences". Journal of Applied Psychology. 92 (1): 107–127. doi:10.1037/0021-9010.92.1.107. PMID17227155. S2CID333238.
Kamphaus, R.W., Winsor, A.P., Rowe, E.W., & Kim, S. (2005). A history of intelligence test interpretation. In D.P. Flanagan and P.L. Harrison (Eds.), Contemporary intellectual assessment: Theories, tests, and issues (2nd Ed.) (pp.23–38). New York: Guilford.
Keith, T.Z.; Kranzler, J.H.; Flanagan, D.P. (2001). "What does the Cognitive Assessment System (CAS) measure? Joint confirmatory factor analysis of the CAS and the Woodcock-Johnson Tests of Cognitive Ability (3rd Edition)". School Psychology Review. 30: 89–119. doi:10.1080/02796015.2001.12086102. S2CID141437006.
Kvist, A. & Gustafsson, J.-E. (2008). The relation between fluid intelligence and the general factor as a function of cultural background: A test of Cattell's Investment theory. Intelligence 36, 422–436.
Lautrey, J. (2002). Is there a general factor of cognitive development? In Sternberg, R.J. & Grigorenko, E.L. (Eds.), The general factor of intelligence: How general is it? Mahwah, NJ: Erlbaum.
Lynn, R. (2003). The Geography of Intelligence. In Nyborg, H. (ed.), The Scientific Study of General Intelligence: Tribute to Arthur R. Jensen (pp. 126–146). Oxford: Pergamon.
Mackintosh, N.J. (2011). IQ and Human Intelligence. Oxford, UK: Oxford University Press.
McGrew, K.S. (2005). The Cattell-Horn-Carroll Theory of Cognitive Abilities: Past, Present, and Future. Contemporary Intellectual Assessment: Theories, Tests, and Issues. (pp. 136–181) New York, NY, US: Guilford Press Flanagan, Dawn P. (Ed); Harrison, Patti L. (Ed), (2005). xvii, 667 pp.
Oberauer, K.; Schulze, R.; Wilhelm, O.; Süß, H.-M. (2005). "Working memory and intelligence – their correlation and their relation: A comment on Ackerman, Beier, and Boyle (2005)". Psychological Bulletin. 131 (1): 61–65. doi:10.1037/0033-2909.131.1.61. PMID15631551. S2CID2508020.
Robertson, K.F.; Smeets, S.; Lubinski, D.; Benbow, C.P. (2010). "Beyond the Threshold Hypothesis: Even Among the Gifted and Top Math/Science Graduate Students, Cognitive Abilities, Vocational Interests, and Lifestyle Preferences Matter for Career Choice, Performance, and Persistence". Current Directions in Psychological Science. 19 (6): 346–351. doi:10.1177/0963721410391442. S2CID46218795.
Roth, P.L.; Bevier, C.A.; Bobko, P.; Switzer III, F.S.; Tyler, P. (2001). "Ethnic group differences in cognitive ability in employment and educational settings: A meta-analysis". Personnel Psychology. 54 (2): 297–330. CiteSeerX10.1.1.372.6092. doi:10.1111/j.1744-6570.2001.tb00094.x.
Rushton, J.P.; Jensen, A.R. (2010). "The rise and fall of the Flynn Effect as a reason to expect a narrowing of the Black–White IQ gap". Intelligence. 38 (2): 213–219. doi:10.1016/j.intell.2009.12.002.
Sackett, P.R.; Borneman, M.J.; Connelly, B.S. (2008). "High-Stakes Testing in Higher Education and Employment. Appraising the Evidence for Validity and Fairness". American Psychologist. 63 (4): 215–227. CiteSeerX10.1.1.189.2163. doi:10.1037/0003-066x.63.4.215. PMID18473607.
Spearman, C.E. (1927). The Abilities of Man. London: Macmillan.
Stauffer, J.; Ree, M.J.; Carretta, T.R. (1996). "Cognitive-Components Tests Are Not Much More than g: An Extension of Kyllonen's Analyses". The Journal of General Psychology. 123 (3): 193–205. doi:10.1080/00221309.1996.9921272.
Sternberg, R. J.; Conway, B. E.; Ketron, J. L.; Bernstein, M. (1981). "People's conception of intelligence". Journal of Personality and Social Psychology. 41: 37–55. doi:10.1037/0022-3514.41.1.37.
von Stumm, S.; Chamorro-Premuzic, T.; Quiroga, M.Á.; Colom, R. (2009). "Separating narrow and general variances in intelligence-personality associations". Personality and Individual Differences. 47 (4): 336–341. doi:10.1016/j.paid.2009.03.024.
von Stumm, S., Chamorro-Premuzic, T., Ackerman, P. L. (2011). Re-visiting intelligence-personality associations: Vindicating intellectual investment. In T. Chamorro-Premuzic, S. von Stumm, & A. Furnham (eds.), Handbook of Individual Differences. Chichester, UK: Wiley-Blackwell.
This page is based on this Wikipedia article Text is available under the CC BY-SA 4.0 license; additional terms may apply. Images, videos and audio are available under their respective licenses.