List of 2008 Minnesota tornadoes

Last updated

Map of the tornadoes that touched down in Minnesota during 2008 2008mntor.jpg
Map of the tornadoes that touched down in Minnesota during 2008

The following is a list of 2008 Minnesota tornadoes. Minnesota is a state located in the North Central United States along the northern edge of Tornado Alley, and on average receives 24 tornadoes per year. 2008 was a more active year historically, with 43 confirmed tornado touchdowns. Thirty-eight of the tornadoes (or 88%) were considered minor, rated EF0 or EF1 on the Enhanced Fujita scale. The remaining five tornadoes were rated as significant, at EF2 or EF3. [1]

Contents

The 43 tornadoes combined to cause $42.7 million in damage: $40.06 million in property damage and $2.66 million in crop damage. The tornadoes combined to injure 24 people, with one fatality reported from an EF3 tornado in Hugo on May 25. The date range of the tornadoes was smaller than normal, lasting exactly two months, from just May 25July 24.

Confirmed tornadoes

Confirmed tornadoes by Enhanced Fujita rating
EFUEF0EF1EF2EF3EF4EF5Total
02315230043

May

May 25

List of confirmed tornadoes (5) Sunday, May 25, 2008
EF# LocationCountyCoord.Time (UTC)Path lengthDamage
EF1 Coon Rapids, Blaine Anoka 45°07′N93°12′W / 45.12°N 93.2°W / 45.12; -93.2 21356 miles (9.7 km)2 injuries Damaged many trees and homes in the northern suburbs of the Twin Cities. Caused $700,000 in damages. [2]
EF3 Lino Lakes/
Hugo
Anoka, Washington 45°06′N93°18′W / 45.1°N 93.3°W / 45.1; -93.3 21556 miles (9.7 km)
Damage to homes from the EF3 tornado in Hugo, Minnesota. Hugo damage1.jpg
Damage to homes from the EF3 tornado in Hugo, Minnesota.

1 death, 17 injuries The tornado touched down in Anoka County in the town of Lino Lakes before crossing into Washington County. It quickly strengthened to an EF3, where it caused severe damage in the town of Hugo, killing a 2-year-old boy. The Creekview Preserve subdivision was especially hard hit. A 62-year-old woman died a few days after the tornado when she suffered a heart attack while clearing debris in her yard. This tornado destroyed 27 homes and damaged 767 others, causing $25.3 million in damage. [3] [4]

EF0SW of Marine on St. Croix Washington 45°06′N92°29′W / 45.1°N 92.49°W / 45.1; -92.49 22101 mile (1.6 km)Hundreds of trees damaged at Warner Nature Reserve with a park building slightly damaged. [5]
EF0Marine on St. CroixWashington, St. Croix (WI), Polk (WI) 45°07′N92°28′W / 45.12°N 92.46°W / 45.12; -92.46 22151.3 miles (2.1 km)Several homes were damaged by fallen trees in Marine on St. Croix along the St. Croix River, resulting in $300,000 in damage. [6]
EF0N of Whipholt Cass 47°02′N94°13′W / 47.04°N 94.22°W / 47.04; -94.22 22484 miles (6.4 km) Waterspout over Leech Lake. [7]

May 30

List of confirmed tornadoes (1) Friday, May 30, 2008
EF# LocationCountyCoord.Time (UTC)Path lengthDamage
EF0 WNW of Morris Stevens 45°07′N93°12′W / 45.12°N 93.2°W / 45.12; -93.2 2037.1 miles (0.2 km)None reported. [1]

June

June 6

List of confirmed tornadoes (5) Friday, June 6, 2008
EF# LocationCountyCoord.Time (UTC)Path lengthDamage
EF2 Menahga, Park Rapids area Wadena, Hubbard 46°27′N95°02′W / 46.45°N 95.04°W / 46.45; -95.04 141414.1 miles (22.7 km)
Damage to turkey barns from the June 6, 2008 tornado Turkeytornado 60608.jpg
Damage to turkey barns from the June 6, 2008 tornado
2 injuries Eight turkey barns, several homes, and hundreds of acres (km2) of forest were damaged or destroyed. Damage total was $11.3 million [8] [9]
EF3 Dorset, Emmaville areaHubbard 46°35′N95°01′W / 46.58°N 95.01°W / 46.58; -95.01 14377.3 miles (11.7 km)
Damage caused by the EF3 Emmaville, Minnesota tornado Hubbard County, MN tornado.jpg
Damage caused by the EF3 Emmaville, Minnesota tornado
Destroyed two homes and damaged several others on Pickerel Lake. Also flattened dozens of acres of forest. [10]
EF0 Dorset areaHubbard 46°35′N95°33′W / 46.59°N 95.55°W / 46.59; -95.55 14515.9 miles (9.5 km)Caused $100,000 in several brief touchdowns. [11]
EF1 Lake George areaHubbard 47°05′N94°35′W / 47.09°N 94.59°W / 47.09; -94.59 14552.4 miles (3.9 km)Numerous large trees were knocked down, causing $400,000 in damage. [12]
EF1 Badoura, Chamberlain areaHubbard 46°31′N94°26′W / 46.51°N 94.43°W / 46.51; -94.43 1543.6 miles (1.0 km)Up to four acres of trees were downed, causing $200,000 in damage. [13]

June 7

List of confirmed tornadoes (1) Saturday, June 7, 2008
EF# LocationCountyCoord.Time (UTC)Path lengthDamage
EF0 Perkins area Houston 43°29′N91°24′W / 43.49°N 91.40°W / 43.49; -91.40 2150.1 miles (0.2 km)None reported. [14]

June 9

List of confirmed tornadoes (1) Monday, June 9, 2008
EF# LocationCountyCoord.Time (UTC)Path lengthDamage
EF1 Halstad area Norman 47°13′N96°27′W / 47.21°N 96.45°W / 47.21; -96.45 1844.3 miles (0.5 km)$40,000 to farm building and trees reported. [15]

June 11

List of confirmed tornadoes (7) Wednesday, June 11, 2008
EF# LocationCountyCoord.Time (UTC)Path lengthDamage
EF1 Pfingsten, Wirock area Nobles, Murray 43°30′N95°27′W / 43.50°N 95.45°W / 43.50; -95.45 22463.8 miles (6.1 km)Caused $70,000 to farm building and trees. [16] [17]
EF1 Lime Creek areaMurray 43°32′N95°22′W / 43.54°N 95.36°W / 43.54; -95.36 23052.7 miles (4.3 km)1 injury This tornado tore the roof off a farm house, causing a wall to collapse and injuring one person. Two building were also destroyed and others damaged at the same farm, causing $100,000 in damage. [18]
EF0 Jeffers area Cottonwood 44°04′N95°07′W / 44.07°N 95.11°W / 44.07; -95.11 23452 miles (3.2 km)Minor damage to outbuildings and trees totaling $5,000. [19]
EF1 Leavenworth area Brown 44°07′N94°31′W / 44.12°N 94.52°W / 44.12; -94.52 0020.6 miles (1.0 km)This tornado destroyed two barns, a farm truck and several vehicles, damage totaling $300,000. [20]
EF0 Sleepy Eye areaBrown 44°11′N94°27′W / 44.19°N 94.45°W / 44.19; -94.45 0046.4 miles (0.6 km)This tornado caused $100,000 to farm buildings. [21]
EF1 Essig areaBrown 44°13′N94°24′W / 44.21°N 94.40°W / 44.21; -94.40 00522 miles (3.2 km)Destroyed a grain bin, along with a few sheds and outbuildings, totaling $100,000. [22]
EF0 Gaylord area Sibley 44°20′N94°06′W / 44.34°N 94.10°W / 44.34; -94.10 0206.3 miles (0.5 km)None reported. [23]

June 12

List of confirmed tornadoes (3) Thursday, June 12, 2008
EF# LocationCountyCoord.Time (UTC)Path lengthDamage
EF0 Midway area Becker 46°27′N95°01′W / 46.45°N 95.01°W / 46.45; -95.01 23401.8 miles (2.9 km)Caused a reported $100,000 in crop damages. [24]
EF1 Nevis areaHubbard 46°33′N95°31′W / 46.55°N 95.51°W / 46.55; -95.51 00141.5 miles (2.4 km)Several large trees were knocked down or uprooted along county road 13, causing $300,000 in property damage and $100,000 in crop damage. [25]
EF1 Two Inlets, Lake George areaBecker, Clearwater, Hubbard 47°04′N95°10′W / 47.06°N 95.17°W / 47.06; -95.17 01448.5 miles (13.7 km)Numerous trees were knocked down along Minnesota State Highway 113. This tornado caused $200,000 in property damage and $100,000 in crop damage. [26] [27] [28]

June 14

List of confirmed tornadoes (2) Thursday, June 14, 2008
EF# LocationCountyCoord.Time (UTC)Path lengthDamage
EF1 Foxhome area Wilkin 46°11′N96°13′W / 46.18°N 96.21°W / 46.18; -96.21 22552.1 miles (3.4 km)This tornado moved a machine shed off its foundation, and downed several large trees. It caused $150,000 in property damage and $100,000 in crop damage. [29]
EF1 Fergus Falls Otter Tail 46°11′N96°04′W / 46.18°N 96.07°W / 46.18; -96.07 23152.6 miles (4.2 km)The tornado skirted along the northeast corner of Fergus Falls, knocking over power lines and numerous tree branches. It caused $100,000 in property damage and $50,000 in crop damage. [30]

July

July 6

List of confirmed tornadoes (1) Sunday, July 6, 2008
EF# LocationCountyCoord.Time (UTC)Path lengthDamage
EF0 Round Lake area Nobles 43°20′N95°02′W / 43.34°N 95.03°W / 43.34; -95.03 2017.3 miles (0.5 km)None reported. [31]

July 10

List of confirmed tornadoes (2) Thursday, July 10, 2008
EF# LocationCountyCoord.Time (UTC)Path lengthDamage
EF0 Empire Dakota 44°23′N93°02′W / 44.39°N 93.04°W / 44.39; -93.04 18156 miles (9.7 km)Damage to trees and $200,000 to crops was reported. [32]
EF0 Vasa area Goodhue 44°18′N92°23′W / 44.30°N 92.39°W / 44.30; -92.39 18401 mile (1.6 km)Minor structural damage reported. [33]

July 11

List of confirmed tornadoes (9) Friday, July 11, 2008
EF# LocationCountyCoord.Time (UTC)Path lengthDamage
EF0 Viking area Marshall 48°09′N96°16′W / 48.15°N 96.27°W / 48.15; -96.27 2025.2 miles (0.3 km)None reported. [34]
EF0 Waubun Mahnomen 47°08′N95°35′W / 47.13°N 95.58°W / 47.13; -95.58 20452 miles (3.2 km)A total of $10,000 in damage was reported to property and crops. [35]
EF0 Vergas Otter Tail 46°25′N95°28′W / 46.42°N 95.46°W / 46.42; -95.46 2055.2 miles (0.3 km)A total of $10,000 in damage was reported to property and crops. [36]
EF2 Beaulieu Mahnomen 47°11′N95°29′W / 47.18°N 95.49°W / 47.18; -95.49 210016 miles (25.7 km)Numerous trees and power poles were snapped along the tornado's path. Farm equipment was damaged. $500,000 in property damage and $100,000 in crop damage was reported. [37]
EF0 Frazee, Wolf Lake areaBecker 46°27′N95°22′W / 46.45°N 95.37°W / 46.45; -95.37 211210 miles (16.1 km)This tornado downed several large trees, causing $25,000 in crop and property damage. [38]
EF1 Luce, Perham areaOtter Tail 46°24′N95°24′W / 46.40°N 95.40°W / 46.40; -95.40 21152 miles (3.2 km)Several farm buildings and equipment was damaged, causing $200,000 in property damage and $100,000 in crop damage. [39]
EF1 Lyman, Wrightstown areaOtter Tail 46°11′N95°09′W / 46.18°N 95.15°W / 46.18; -95.15 21431 mile (1.6 km)This tornado caused $50,000 in damage to property and crops. [40]
EF3 Priam, Kandiyohi area Kandiyohi 45°02′N94°35′W / 45.04°N 94.58°W / 45.04; -94.58 23268 miles (12.9 km)
EF3 tornado damage near Willmar. Willmartornado71108.JPG
EF3 tornado damage near Willmar.
2 injuries Three homes were destroyed and eight others damaged. Barns and sheds were also destroyed, including two turkey barns. [41]
EF0 Dassel, Knapp area Meeker, Wright 45°04′N94°10′W / 45.07°N 94.16°W / 45.07; -94.16 00253 miles (4.8 km)Damage to a home, sheds and trees totaled $200,000. [42] [43]

July 14

List of confirmed tornadoes (1) Monday, July 14, 2008
EF# LocationCountyCoord.Time (UTC)Path lengthDamage
EF0 Funkley area Beltrami 47°28′N94°16′W / 47.46°N 94.27°W / 47.46; -94.27 0245.2 miles (0.3 km)Minor tree damage reported. [44]

July 16

List of confirmed tornadoes (2) Wednesday, July 16, 2008
EF# LocationCountyCoord.Time (UTC)Path lengthDamage
EF1Pittsburg, ND, Donaldson area Pembina, Kittson 48°22′N97°02′W / 48.37°N 97.04°W / 48.37; -97.04 01324 miles (6.4 km)Minor damage reported, totaling $10,000. [45]
EF0 Stephen areaMarshall 48°18′N96°32′W / 48.30°N 96.54°W / 48.30; -96.54 02001 mile (1.6 km)This tornado caused $20,000 in crop damage and $10,000 to buildings. [46]

July 17

List of confirmed tornadoes (1) Thursday, July 17, 2008
EF# LocationCountyCoord.Time (UTC)Path lengthDamage
EF0 Amboy Blue Earth 43°31′N94°06′W / 43.52°N 94.10°W / 43.52; -94.10 1655.1 miles (0.2 km)None reported. [47]

July 19

List of confirmed tornadoes (1) Saturday, July 19, 2008
EF# LocationCountyCoord.Time (UTC)Path lengthDamage
EF0 Becker, Big Lake area Sherburne 45°13′N93°30′W / 45.22°N 93.50°W / 45.22; -93.50 19074.4 miles (7.1 km)Minor damage to trees and houses, as well as $300,000 in crop damage reported. [48]

July 24

List of confirmed tornadoes (1) Thursday, July 24, 2008
EF# LocationCountyCoord.Time (UTC)Path lengthDamage
EF0Waubun areaMahnomen 47°09′N95°33′W / 47.15°N 95.55°W / 47.15; -95.55 23201 mile (1.6 km)Small tornado caused $5,000 in crop damage. [49]

See also

Related Research Articles

<span class="mw-page-title-main">Climate of Minneapolis–Saint Paul</span>

The climate of Minneapolis–Saint Paul is the long term weather trends and historical events of the Minneapolis–Saint Paul metropolitan area in east central Minnesota. Minneapolis and St. Paul, together known as the Twin Cities, are the core of the 15th largest metropolitan area in the United States. With a population of 3.6 million people, the region contains approximately 60% of the population of Minnesota. Due to its location in the northern and central portion of the U.S., the Twin Cities has the coldest average temperature of any major metropolitan area in the nation. Winters are very cold, summer is warm and humid, snowfall is common in the winter and thunderstorms with heavy rainfall occur during the spring, summer and autumn. Though winter can be cold, the area receives more sunlight hours in mid-winter than many other warmer parts of the country, including all of the Great Lakes states, the Pacific Northwest, parts of the South, and almost all of the Northeast. Unless otherwise indicated, all normals data presented below are based on data at Minneapolis/St. Paul International Airport, the official Twin Cities climatology station, from the 1981−2010 normals period.

<span class="mw-page-title-main">Tornadoes of 2007</span> List of notable worldwide tornadoes that occurred in 2007

This page documents the tornadoes and tornado outbreaks that occurred in 2007, primarily in the United States. Most tornadoes form in the U.S., although some events may take place internationally, particularly in parts of neighboring southern Canada during the summer season. Some tornadoes also take place in Europe, e. g. in the United Kingdom or in Germany.

<span class="mw-page-title-main">2007 Groundhog Day tornado outbreak</span>

The 2007 Groundhog Day tornado outbreak was a localized but devastating tornado event that took place in central Florida early on February 2, 2007. Early morning temperatures had risen well above average for the season; combined with increased moisture and a powerful jet stream, this created enough instability and wind shear for thunderstorms to rotate and spawn tornadoes. Due to the conditions, a long-tracked supercell formed and produced three tornadoes over one hour and seventeen minutes. The supercell resulted in a 70-mile (110-kilometer) trail of damage.

<span class="mw-page-title-main">Tornado outbreak of May 4–6, 2007</span> 2007 tornado outbreak in the United States

From May 4–6, 2007, a major and damaging tornado outbreak significantly affected portions of the Central United States. The most destructive tornado in the outbreak occurred on the evening of May 4 in western Kansas, where about 95% of the city of Greensburg in Kiowa County was destroyed by an EF5 tornado, the first of the new Enhanced Fujita Scale and such intensity since the 1999 Bridge Creek–Moore tornado. The supercell killed 13 people, including 11 in Greensburg and two from separate tornadoes. At least 60 people were injured in Greensburg alone. It was the strongest tornado of an outbreak which included several other tornadoes reported across Oklahoma, Colorado, Kansas and South Dakota that occurred on the same night.

<span class="mw-page-title-main">Satellite tornado</span> Smaller tornado that orbits around a larger parent tornado

A satellite tornado is a tornado that revolves around a larger, primary tornado and interacts with the same mesocyclone. Satellite tornadoes occur apart from the primary tornado and are not considered subvortices; the primary tornado and satellite tornadoes are considered to be separate tornadoes. The cause of satellite tornadoes is not known. Such tornadoes are more often anticyclonic than are typical tornadoes and these pairs may be referred to as tornado couplets. Satellite tornadoes commonly occur in association with very powerful, large, and destructive tornadoes, indicative also of the strength and severity of the parent supercell thunderstorm.

<span class="mw-page-title-main">2009 North American Christmas blizzard</span> Weather event in the United States and Canada

The 2009 North American Christmas blizzard was a powerful winter storm and severe weather event that affected the Midwestern United States, Great Plains, Southeastern United States, the Eastern Seaboard, and parts of Ontario. The storm began to develop on December 22 before intensifying to produce extreme winds and precipitation by the morning of December 24. The storm's rapid development made it difficult for forecasters to predict. The blizzard was reported to have claimed at least 21 lives, and disrupted air travel during the Christmas travel season. In the Southeastern and Central United States, an outbreak of 28 tornadoes occurred between December 23–24. The storm, a Category 5 "Extreme" one on the Regional Snowfall Index scale, was the first winter weather event to rank as such since the North American blizzard of 1996.

<span class="mw-page-title-main">2009 Minnesota tornadoes</span>

The following is a list of 2009 Minnesota tornadoes. Minnesota is a state located in the North Central United States along the northern edge of Tornado Alley, and on average receives 24 tornadoes per year. 2009 was an average year historically, with 24 confirmed tornado touchdowns. Twenty-two of the tornadoes (91%) were considered minor, rated EF0 or EF1 on the Enhanced Fujita scale. The remaining two tornadoes were rated as significant, at EF2.

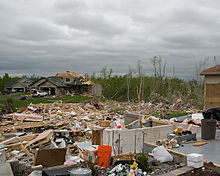
The tornado outbreak of August 8–9, 1993 was a small tornado outbreak that occurred over the Upper Midwest of the United States for a period of two days. An F0 tornado near Littlefork, Minnesota lifted and moved a mobile home, killing its two occupants. It is Minnesota's most recent single tornado to cause multiple deaths. Other minor tornadoes occurred in Minnesota, Iowa and Wisconsin, causing limited damage.

<span class="mw-page-title-main">Tornado outbreak of April 9–11, 2011</span> Tornado outbreak in the United States

One of several tornado outbreaks in the United States to take place during the record month of April 2011, 49 tornadoes were produced across the Midwest and Southeast from April 9–11. Widespread damage took place; however, no fatalities resulted from the event due to timely warnings. In Wisconsin, 16 tornadoes touched down, ranking this outbreak as the state's largest April event on record as well as one of the largest single-day events during the course of any year. The strongest tornado of the outbreak was an EF4 tornado that touched down west of Pocahontas, Iowa on April 9, a short-lived satellite to a long-track EF3 tornado. Between 0256 and 0258 UTC that day, five tornadoes were on the ground simultaneously in Pocahontas County, Iowa, all of which were from one supercell thunderstorm. Other tornadoes impacted parts of eastern Kentucky and Tennessee on April 9, hours before the event in Iowa.

<span class="mw-page-title-main">Tornado outbreak of March 2–3, 2012</span> Windstorms in the southern United States

On March 2 and 3, 2012, a deadly tornado outbreak occurred over a large section of the Southern United States into the Ohio Valley region. The storms resulted in 41 tornado-related fatalities, 22 of which occurred in Kentucky. Tornado-related deaths also occurred in Alabama, Indiana, and Ohio. The outbreak was the second deadliest in early March for the U.S. since official records began in 1950; only the 1966 Candlestick Park tornado had a higher death toll for a tornadic system in early March.

<span class="mw-page-title-main">Tornado outbreak of June 16–18, 2014</span> Summer tornado outbreak in the U.S. Great Plains and Midwest

The tornado outbreak of June 16–18, 2014, was a tornado outbreak concentrated in the Great Plains and the Midwestern United States. Two tornadoes also occurred in Ontario. The severe weather event most significantly affected the state of Nebraska, where twin EF4 tornadoes killed two and critically injured twenty others in and around the town of Pilger on the evening of June 16. The two Pilger tornadoes were part of a violent tornado family that produced four EF4 tornadoes and was broadcast live on television. The outbreak went on to produce multiple other strong tornadoes across the northern Great Plains states throughout the next two days.

<span class="mw-page-title-main">Tornado outbreak sequence of May 5–10, 2015</span> Weather event in the United States

The tornado outbreak sequence of May 5–10, 2015 was a six-day outbreak of tornado activity that affected the Great Plains of the United States in early May 2015. On May 6, strong tornadoes impacted the Oklahoma City area, along with rural parts of Kansas, Texas, Arkansas, South Dakota, and Nebraska. The outbreak coincided with major flooding, with large amounts of rain falling in parts of Nebraska, Kansas, Oklahoma, and Texas. The National Weather Service forecast office in Norman, Oklahoma issued a "flash flood emergency" for Oklahoma City following record-breaking rainfall that occurred in the area that evening. The outbreak sequence resulted in five tornado-related deaths, along with two flood-related deaths. A total of 127 tornadoes were confirmed and rated as a result of this outbreak sequence. Damage from the outbreak was estimated at $1.5 billion.

<span class="mw-page-title-main">Tornado outbreak of February 23–24, 2016</span> Weather event in the United States

An unusually prolific and very destructive late-winter tornado outbreak resulted in significant damage and numerous casualties across the southern and eastern half of the United States between February 23–24, 2016. Lasting over a day and a half, the outbreak produced a total of 61 tornadoes across eleven states, which ranked it as one of the largest February tornado outbreaks in the United States on record, with only the 2008 Super Tuesday tornado outbreak having recorded more. In addition, it was also one of the largest winter tornado outbreaks overall as well. The most significant and intense tornadoes of the event were four EF3 tornadoes that struck southeastern Louisiana, Pensacola, Florida, Evergreen, Virginia, and Tappahannock, Virginia. Tornadoes were also reported in other places like Texas, Florida, and Pennsylvania. Severe thunderstorms, hail and gusty winds were also felt in the Northeastern United States and Mid-Atlantic states on February 24 as well.

References

  1. 1 2 "2008 Minnesota tornadoes". National Weather Service. 2008. Retrieved 2009-01-21.
  2. "Event Record Details - 25 May 2008". National Climatic Data Center. May 25, 2008. Retrieved 2009-01-21.
  3. "Event Record Details - 25 May 2008". National Climatic Data Center. May 25, 2008. Retrieved 2009-01-21.
  4. "Event Record Details - 25 May 2008". National Climatic Data Center. May 25, 2008. Retrieved 2009-01-21.
  5. "Event Record Details - 25 May 2008". National Climatic Data Center. May 25, 2008. Retrieved 2009-01-21.
  6. "Event Record Details - 25 May 2008". National Climatic Data Center. May 25, 2008. Retrieved 2009-01-21.
  7. "Event Record Details - 25 May 2008". National Climatic Data Center. May 25, 2008. Retrieved 2009-01-21.
  8. "Event Record Details - 6 June 2008". National Climatic Data Center. June 6, 2008. Retrieved 2009-01-23.
  9. "Event Record Details - 6 June 2008". National Climatic Data Center. June 6, 2008. Retrieved 2009-01-23.
  10. "Event Record Details - 6 June 2008". National Climatic Data Center. June 6, 2008. Retrieved 2009-01-23.
  11. "Event Record Details - 6 June 2008". National Climatic Data Center. June 6, 2008. Retrieved 2009-01-23.
  12. "Event Record Details - 6 June 2008". National Climatic Data Center. June 6, 2008. Retrieved 2009-01-23.
  13. "Event Record Details - 6 June 2008". National Climatic Data Center. June 6, 2008. Retrieved 2009-01-23.
  14. "Event Record Details - 7 June 2008". National Climatic Data Center. June 7, 2008. Retrieved 2009-01-23.
  15. "Event Record Details - 9 June 2008". National Climatic Data Center. June 9, 2008. Retrieved 2009-01-23.
  16. "Event Record Details - 11 June 2008". National Climatic Data Center. June 11, 2008. Retrieved 2009-01-23.
  17. "Event Record Details - 11 June 2008". National Climatic Data Center. June 11, 2008. Retrieved 2009-01-23.
  18. "Event Record Details - 11 June 2008". National Climatic Data Center. June 11, 2008. Retrieved 2009-01-23.
  19. "Event Record Details - 11 June 2008". National Climatic Data Center. June 11, 2008. Retrieved 2009-01-23.
  20. "Event Record Details - 11 June 2008". National Climatic Data Center. June 11, 2008. Retrieved 2009-01-23.
  21. "Event Record Details - 11 June 2008". National Climatic Data Center. June 11, 2008. Retrieved 2009-01-23.
  22. "Event Record Details - 11 June 2008". National Climatic Data Center. June 11, 2008. Retrieved 2009-01-23.
  23. "Event Record Details - 11 June 2008". National Climatic Data Center. June 11, 2008. Retrieved 2009-01-23.
  24. "Event Record Details - 11 June 2008". National Climatic Data Center. June 11, 2008. Retrieved 2009-01-23.
  25. "Event Record Details - 11 June 2008". National Climatic Data Center. June 11, 2008. Retrieved 2009-01-23.
  26. "Event Record Details - 11 June 2008". National Climatic Data Center. June 11, 2008. Retrieved 2009-01-23.
  27. "Event Record Details - 11 June 2008". National Climatic Data Center. June 11, 2008. Retrieved 2009-01-23.
  28. "Event Record Details - 11 June 2008". National Climatic Data Center. June 11, 2008. Retrieved 2009-01-23.
  29. "Event Record Details - 14 June 2008". National Climatic Data Center. June 14, 2008. Retrieved 2009-01-23.
  30. "Event Record Details - 14 June 2008". National Climatic Data Center. June 14, 2008. Retrieved 2009-01-23.
  31. "Event Record Details - 6 July 2008". National Climatic Data Center. July 6, 2008. Retrieved 2009-01-23.
  32. "Event Record Details - 10 July 2008". National Climatic Data Center. July 10, 2008. Retrieved 2009-01-23.
  33. "Event Record Details - 10 July 2008". National Climatic Data Center. July 10, 2008. Retrieved 2009-01-23.
  34. "Event Record Details - 11 July 2008". National Climatic Data Center. July 11, 2008. Retrieved 2009-01-23.
  35. "Event Record Details - 11 July 2008". National Climatic Data Center. July 11, 2008. Retrieved 2009-01-23.
  36. "Event Record Details - 11 July 2008". National Climatic Data Center. July 11, 2008. Retrieved 2009-01-23.
  37. "Event Record Details - 11 July 2008". National Climatic Data Center. July 11, 2008. Retrieved 2009-01-23.
  38. "Event Record Details - 11 July 2008". National Climatic Data Center. July 11, 2008. Retrieved 2009-01-23.
  39. "Event Record Details - 11 July 2008". National Climatic Data Center. July 11, 2008. Retrieved 2009-01-23.
  40. "Event Record Details - 11 July 2008". National Climatic Data Center. July 11, 2008. Retrieved 2009-01-23.
  41. "Event Record Details - 11 July 2008". National Climatic Data Center. July 11, 2008. Retrieved 2009-01-23.
  42. "Event Record Details - 11 July 2008". National Climatic Data Center. July 11, 2008. Retrieved 2009-01-23.
  43. "Event Record Details - 11 July 2008". National Climatic Data Center. July 11, 2008. Retrieved 2009-01-23.
  44. "Event Record Details - 14 July 2008". National Climatic Data Center. July 14, 2008. Retrieved 2009-01-23.
  45. "Event Record Details - 16 July 2008". National Climatic Data Center. July 16, 2008. Retrieved 2009-01-23.
  46. "Event Record Details - 16 July 2008". National Climatic Data Center. July 16, 2008. Retrieved 2009-01-23.
  47. "Event Record Details - 17 July 2008". National Climatic Data Center. July 17, 2008. Retrieved 2009-01-23.
  48. "Event Record Details - 19 July 2008". National Climatic Data Center. July 19, 2008. Retrieved 2009-01-23.
  49. "Event Record Details - 24 July 2008". National Climatic Data Center. July 24, 2008. Retrieved 2009-01-23.