Gallery
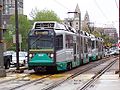 MBTA Green Line
 LA Metro former (L) Line
 Muni Metro's T Third line
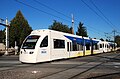

 DART Green Line
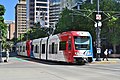
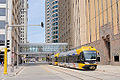 METRO Blue Line
 St. Louis MetroLink
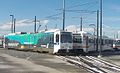

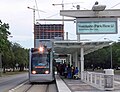 Houston METRORail Red Line
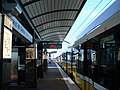
 Link Light Rail Line 1
 Seattle Streetcar South Lake Union Line
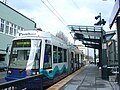 Link light rail T Line
 Sun Link Streetcar


