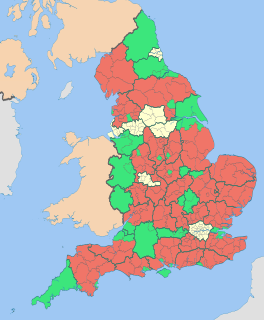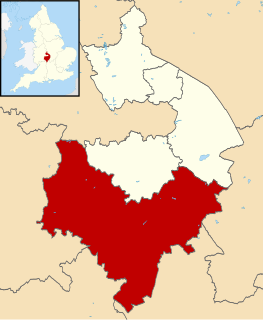
The 2010 Stratford-on-Avon District Council election took place on 6 May 2010 to elect members of Stratford-on-Avon District Council in Warwickshire, England. One third of the council was up for election and the Conservative party stayed in overall control of the council. [1]
Non-metropolitan districts, or colloquially "shire districts", are a type of local government district in England. As created, they are sub-divisions of non-metropolitan counties in a two-tier arrangement.
Warwickshire is a landlocked county in the West Midlands region of England. The county town is Warwick, although the largest town is Nuneaton. The county is famous for being the birthplace of William Shakespeare.
England is a country that is part of the United Kingdom. It shares land borders with Wales to the west and Scotland to the north-northwest. The Irish Sea lies west of England and the Celtic Sea lies to the southwest. England is separated from continental Europe by the North Sea to the east and the English Channel to the south. The country covers five-eighths of the island of Great Britain, which lies in the North Atlantic, and includes over 100 smaller islands, such as the Isles of Scilly and the Isle of Wight.
After the election, the composition of the council was
The Conservative Party, officially the Conservative and Unionist Party, is a centre-right political party in the United Kingdom. Presently led by Theresa May, it has been the governing party since 2010. It presently has 314 Members of Parliament in the House of Commons, 249 members of the House of Lords, and 18 members of the European Parliament. It also has 31 Members of the Scottish Parliament, 12 members of the Welsh Assembly, eight members of the London Assembly and 9,008 local councillors. One of the major parties of UK politics, it has formed the government on 45 occasions, more than any other party.
The Liberal Democrats are a liberal, centrist political party in the United Kingdom. They presently have 11 Members of Parliament in the House of Commons, 96 members of the House of Lords, and one member of the European Parliament. They also have five Members of the Scottish Parliament and a member each in the Welsh Assembly and London Assembly. The party reached the height of its influence in the early 2010s, forming a junior partner in a coalition government from 2010 to 2015. It is presently led by Vince Cable.
Before the election the Conservatives controlled the council with 29 seats, compared to 19 Liberal Democrats and 3 independents, with a further 2 seats being vacant. [3] 20 seats were contested in the election by a total of 58 candidates. [3]
The results saw the Conservatives hold control of the council after winning 11 of the 20 seats contested, compared to 8 seats for the Liberal Democrats and 1 independent. [4] The Conservatives gained a seat in Kinwarton from the Liberal Democrats, but lost another seat back to the Liberal Democrats in Stratford Alveston to leave the political balance unchanged. [4]
Kinwarton is a village in the valley of the River Alne, Warwickshire, to the north east of the market town of Alcester. The population of the civil parish at the 2011 census was 1,082. The ground is mostly low-lying, with a maximum altitude of 206 ft. and some of the fields near the river are liable to floods. The road from Alcester to Henley-in-Arden runs through the middle of the parish. A branch road leads off to the church and rectory about a quarter of a mile to the south and thence continues as a field-path down to a ford across the Arrow below Hoo Mill. From the north side of the main road a by-road branches off to Coughton.
Party | Seats | Gains | Losses | Net gain/loss | Seats % | Votes % | Votes | +/− | |
---|---|---|---|---|---|---|---|---|---|
Conservative | 11 | 1 | 1 | 0 | 55.0 | 47.8 | 24,712 | -3.2% | |
Liberal Democrat | 8 | 1 | 1 | 0 | 40.0 | 36.6 | 18,891 | -3.3% | |
Independent | 1 | 0 | 0 | 0 | 5.0 | 7.6 | 3,931 | +4.2% | |
Labour | 0 | 0 | 0 | 0 | 0 | 6.6 | 3,396 | +2.9% | |
Green | 0 | 0 | 0 | 0 | 0 | 1.4 | 715 | +0.8% | |
Party | Candidate | Votes | % | ± | |
---|---|---|---|---|---|
Liberal Democrat | Susan Juned | 1,651 | 49.6 | +8.2 | |
Conservative | Yvonne Hine | 1,438 | 43.2 | -11.9 | |
Labour | Barry Doherty | 241 | 7.2 | +3.7 | |
Majority | 213 | 6.4 | |||
Turnout | 3,330 | 68.8 | +24.9 | ||
Liberal Democrat hold | Swing | ||||
Party | Candidate | Votes | % | ± | |
---|---|---|---|---|---|
Liberal Democrat | Daren Pemberton | 1,448 | 38.3 | -3.0 | |
Conservative | Maurice Howse | 1,354 | 35.8 | +35.8 | |
Independent | Michael Atkins | 551 | 14.6 | -37.4 | |
Labour | Matthew Stephens | 316 | 8.4 | +1.7 | |
Green | Karen Varga | 109 | 2.9 | +2.9 | |
Majority | 94 | 2.5 | |||
Turnout | 3,778 | 69.5 | +36.6 | ||
Liberal Democrat hold | Swing | ||||
Party | Candidate | Votes | % | ± | |
---|---|---|---|---|---|
Conservative | Philip Seccombe | 976 | 70.1 | +15.0 | |
Liberal Democrat | Laura Nelson | 416 | 29.9 | -15.0 | |
Majority | 560 | 40.2 | +30.1 | ||
Turnout | 1,392 | 77.6 | +19.6 | ||
Conservative hold | Swing | ||||
Party | Candidate | Votes | % | ± | |
---|---|---|---|---|---|
Liberal Democrat | Richard Tonge | 1,461 | 52.2 | +1.9 | |
Conservative | Richard Hamburger | 1,340 | 47.8 | -1.9 | |
Majority | 121 | 4.3 | +3.7 | ||
Turnout | 2,801 | 73.8 | +28.3 | ||
Liberal Democrat hold | Swing | ||||
Party | Candidate | Votes | % | ± | |
---|---|---|---|---|---|
Conservative | Jeremy Jones | 1,664 | 65.1 | -9.5 | |
Liberal Democrat | Karyl Rees | 606 | 23.7 | +10.0 | |
Labour | John Hartigan | 285 | 11.2 | +11.2 | |
Majority | 1,058 | 41.4 | -19.5 | ||
Turnout | 2,555 | 70.1 | +26.1 | ||
Conservative hold | Swing | ||||
Party | Candidate | Votes | % | ± | |
---|---|---|---|---|---|
Conservative | Michael Gittus | 675 | 52.2 | +5.5 | |
Liberal Democrat | Nina Knapman | 565 | 43.7 | -9.6 | |
Labour | Jeffrey Kenner | 54 | 4.2 | +4.2 | |
Majority | 110 | 8.5 | |||
Turnout | 1,294 | 74.8 | +29.0 | ||
Conservative gain from Liberal Democrat | Swing | ||||
Party | Candidate | Votes | % | ± | |
---|---|---|---|---|---|
Conservative | Stephen Gray | 859 | 63.3 | -9.0 | |
Liberal Democrat | Virginia Mason | 499 | 36.7 | +9.0 | |
Majority | 360 | 26.5 | -18.1 | ||
Turnout | 1,358 | 75.5 | +28.1 | ||
Conservative hold | Swing | ||||
Party | Candidate | Votes | % | ± | |
---|---|---|---|---|---|
Conservative | Robert Stevens | 901 | 64.6 | -5.9 | |
Liberal Democrat | Michael Pugh | 494 | 35.4 | +20.7 | |
Majority | 407 | 29.2 | -26.6 | ||
Turnout | 1,395 | 73.3 | +29.8 | ||
Conservative hold | Swing | ||||
Party | Candidate | Votes | % | ± | |
---|---|---|---|---|---|
Conservative | Michael Brain | 959 | 67.3 | -6.1 | |
Liberal Democrat | Jeffery Dench | 467 | 32.7 | +32.7 | |
Majority | 492 | 34.5 | -12.4 | ||
Turnout | 1,426 | 71.5 | +24.9 | ||
Conservative hold | Swing | ||||
Party | Candidate | Votes | % | ± | |
---|---|---|---|---|---|
Conservative | Justin Kerridge | 696 | 64.7 | -9.1 | |
Liberal Democrat | Clive Rickhards | 380 | 35.3 | +9.1 | |
Majority | 316 | 29.4 | -18.1 | ||
Turnout | 1,076 | 73.4 | +28.0 | ||
Conservative hold | Swing | ||||
Party | Candidate | Votes | % | ± | |
---|---|---|---|---|---|
Liberal Democrat | Philip Vial | 1,376 | 48.0 | -0.7 | |
Conservative | Clive Smithard | 1,108 | 38.6 | -9.4 | |
Labour | Christopher Aston | 315 | 11.0 | +7.7 | |
Green | Robert Ballantyne | 70 | 2.4 | +2.4 | |
Majority | 268 | 9.3 | +8.6 | ||
Turnout | 2,869 | 71.0 | +22.4 | ||
Liberal Democrat hold | Swing | ||||
Party | Candidate | Votes | % | ± | |
---|---|---|---|---|---|
Conservative | Helen Hayter | 940 | 70.0 | -8.4 | |
Liberal Democrat | John Insoll | 403 | 30.0 | +8.4 | |
Majority | 537 | 40.0 | -16.8 | ||
Turnout | 1,343 | 74.9 | +28.6 | ||
Conservative hold | Swing | ||||
Party | Candidate | Votes | % | ± | |
---|---|---|---|---|---|
Conservative | Jennifer Ellard | 1,631 | 46.5 | -5.6 | |
Liberal Democrat | Helena Knight | 977 | 27.9 | +4.7 | |
Labour | Peter Thomas | 900 | 25.7 | +1.0 | |
Majority | 654 | 18.6 | -8.8 | ||
Turnout | 3,508 | 69.6 | +36.5 | ||
Conservative hold | Swing | ||||
Party | Candidate | Votes | % | ± | |
---|---|---|---|---|---|
Liberal Democrat | Ian Fradgley | 1,938 | 45.2 | -3.9 | |
Conservative | Stuart Beese | 1,682 | 39.2 | -3.1 | |
Independent | Michael Crutchley | 378 | 8.8 | +8.8 | |
Labour | Samuel Hargreaves | 288 | 6.7 | +6.7 | |
Majority | 256 | 6.0 | -0.8 | ||
Turnout | 4,286 | 74.8 | +26.5 | ||
Liberal Democrat gain from Conservative | Swing | ||||
Party | Candidate | Votes | % | ± | |
---|---|---|---|---|---|
Liberal Democrat | Clive Thomas | 1,531 | 39.0 | -8.6 | |
Conservative | Ian Hurst | 1,423 | 36.2 | -9.8 | |
Independent | Juliet Short | 620 | 15.8 | +15.8 | |
Labour | Stephen Troup | 352 | 9.0 | +2.7 | |
Majority | 108 | 2.8 | +1.2 | ||
Turnout | 3,926 | 65.6 | +28.1 | ||
Liberal Democrat hold | Swing | ||||
Party | Candidate | Votes | % | ± | |
---|---|---|---|---|---|
Liberal Democrat | Jenny Fradgley | 1,876 | 45.0 | -2.3 | |
Conservative | Irving David | 1,473 | 35.3 | -4.3 | |
Independent | William Lowe | 364 | 8.7 | +8.7 | |
Labour | David Talbot | 315 | 7.6 | +2.0 | |
Green | Hugh Chatwin | 144 | 3.5 | -4.1 | |
Majority | 403 | 9.7 | +2.0 | ||
Turnout | 4,172 | 70.7 | +28.7 | ||
Liberal Democrat hold | Swing | ||||
Party | Candidate | Votes | % | ± | |
---|---|---|---|---|---|
Liberal Democrat | Hazel Wright | 1,755 | 55.4 | -3.6 | |
Conservative | William McCarthy | 1,085 | 34.2 | -1.3 | |
Labour | Jacqueline Abbott | 330 | 10.4 | +5.0 | |
Majority | 670 | 21.1 | -2.4 | ||
Turnout | 3,170 | 69.1 | +28.5 | ||
Liberal Democrat hold | Swing | ||||
Party | Candidate | Votes | % | ± | |
---|---|---|---|---|---|
Conservative | Peter Oakley | 1,723 | 73.8 | -12.8 | |
Liberal Democrat | Eric Holder | 613 | 26.2 | +12.8 | |
Majority | 1,110 | 47.5 | -25.8 | ||
Turnout | 2,336 | 73.1 | +31.6 | ||
Conservative hold | Swing | ||||
Party | Candidate | Votes | % | ± | |
---|---|---|---|---|---|
Conservative | Gillian Roache | 1,048 | 70.7 | -9.4 | |
Liberal Democrat | Kenneth Osborne | 435 | 29.3 | +9.4 | |
Majority | 613 | 41.3 | -18.8 | ||
Turnout | 1,483 | 77.9 | +28.3 | ||
Conservative hold | Swing | ||||
Party | Candidate | Votes | % | ± | |
---|---|---|---|---|---|
Independent | Roger Wright | 2,018 | 48.7 | +48.7 | |
Conservative | Daniel Kendall | 1,737 | 41.9 | -8.2 | |
Green | Jessica Pinson | 392 | 9.5 | +9.5 | |
Majority | 281 | 6.8 | |||
Turnout | 4,147 | 75.4 | +30.4 | ||
Independent hold | Swing | ||||
Stratford-on-Avon is a local government district of southern Warwickshire in England.
The 2000 Craven District Council election took place on 4 May 2000 to elect members of Craven District Council in North Yorkshire, England. One third of the council was up for election and the Conservative party stayed in overall control of the council.
The 2002 Craven District Council election took place on 2 May 2002 to elect members of Craven District Council in North Yorkshire, England. The whole council was up for election with boundary changes since the last election in 2000 reducing the number of seats by 4. The council stayed under no overall control.
The 1999 Stratford-on-Avon District Council election took place on 6 May 1999 to elect members of Stratford-on-Avon District Council in Warwickshire, England. One third of the council was up for election and the council stayed under no overall control.
The 2000 Stratford-on-Avon District Council election took place on 4 May 2000 to elect members of Stratford-on-Avon District Council in Warwickshire, England. One third of the council was up for election and the Conservative party gained overall control of the council from no overall control.
The 2002 Stratford-on-Avon District Council election took place on 2 May 2002 to elect members of Stratford-on-Avon District Council in Warwickshire, England. The whole council was up for election with boundary changes since the last election in 2000 reducing the number of seats by 2. The Conservative party stayed in overall control of the council.
The 2003 Stratford-on-Avon District Council election took place on 1 May 2003 to elect members of Stratford-on-Avon District Council in Warwickshire, England. One third of the council was up for election and the Conservative party gained overall control of the council from no overall control.
The 2004 Stratford-on-Avon District Council election took place on 10 June 2004 to elect members of Stratford-on-Avon District Council in Warwickshire, England. One third of the council was up for election and the Conservative party stayed in overall control of the council.
The 2006 Stratford-on-Avon District Council election took place on 4 May 2006 to elect members of Stratford-on-Avon District Council in Warwickshire, England. One third of the council was up for election and the Conservative party stayed in overall control of the council.
The 2007 Stratford-on-Avon District Council election took place on 3 May 2007 to elect members of Stratford-on-Avon District Council in Warwickshire, England. One third of the council was up for election and the Conservative party stayed in overall control of the council.
The 2008 Stratford-on-Avon District Council election took place on 1 May 2008 to elect members of Stratford-on-Avon District Council in Warwickshire, England. One third of the council was up for election and the Conservative party stayed in overall control of the council.
The 2007 Pendle Borough Council election took place on 3 May 2007 to elect members of Pendle Borough Council in Lancashire, England. One third of the council was up for election and the Liberal Democrats stayed in overall control of the council.
The 2006 Maidstone Borough Council election took place on 4 May 2006 to elect members of Maidstone Borough Council in Kent, England. One third of the council was up for election and the council stayed under no overall control.
The 2007 Maidstone Borough Council election took place on 3 May 2007 to elect members of Maidstone Borough Council in Kent, England. One third of the council was up for election and the council stayed under no overall control.
The 2011 Sandwell Metropolitan Borough Council election took place on 5 May 2011 to elect members of Sandwell Metropolitan Borough Council in the West Midlands, England. One third of the council was up for election and the Labour party stayed in overall control of the council.
The 2007 Carlisle City Council election took place on 3 May 2007 to elect members of Carlisle District Council in Cumbria, England. One third of the council was up for election and the council stayed under no overall control.
The 2011 Tandridge District Council election took place on 5 May 2011 to elect members of Tandridge District Council in Surrey, England. One third of the council was up for election and the Conservative party stayed in overall control of the council.
The 2010 Harlow District Council election took place on 6 May 2010 to elect members of Harlow District Council in Essex, England. One third of the council was up for election and the Conservative party stayed in overall control of the council.
The 2011 Harlow District Council election took place on 5 May 2011 to elect members of Harlow District Council in Essex, England. One third of the council was up for election and the Conservative party stayed in overall control of the council.
The 2010 West Oxfordshire District Council election took place on 6 May 2010 to elect members of West Oxfordshire District Council in Oxfordshire, England. One third of the council was up for election and the Conservative party stayed in overall control of the council.