The 2004 Swindon Borough Council election took place on 10 June 2004 to elect members of Swindon Unitary Council in Wiltshire, England. One third of the council was up for election and the Conservative party gained overall control of the council from no overall control. [1]
A unitary authority is a type of local authority that has a single tier and is responsible for all local government functions within its area or performs additional functions which elsewhere in the relevant country are usually performed by national government or a higher level of sub-national government.
Wiltshire is a county in South West England with an area of 3,485 km2. It is landlocked and borders the counties of Dorset, Somerset, Hampshire, Gloucestershire, Oxfordshire and Berkshire. The county town was originally Wilton, after which the county is named, but Wiltshire Council is now based in the county town of Trowbridge.
England is a country that is part of the United Kingdom. It shares land borders with Wales to the west and Scotland to the north-northwest. The Irish Sea lies west of England and the Celtic Sea lies to the southwest. England is separated from continental Europe by the North Sea to the east and the English Channel to the south. The country covers five-eighths of the island of Great Britain, which lies in the North Atlantic, and includes over 100 smaller islands, such as the Isles of Scilly and the Isle of Wight.
After the election, the composition of the council was
Party | Seats | Gains | Losses | Net gain/loss | Seats % | Votes % | Votes | +/− | |
---|---|---|---|---|---|---|---|---|---|
Conservative | 14 | +4 | 70.0 | 45.1 | 19,466 | +3.3% | |||
Labour | 5 | -3 | 25.0 | 27.8 | 11,971 | -2.9% | |||
Liberal Democrat | 1 | -1 | 5.0 | 20.3 | 8,749 | -5.0% | |||
Green | 0 | 0 | 0 | 4.9 | 2,101 | +4.3% | |||
UKIP | 0 | 0 | 0 | 0.7 | 311 | +0.0% | |||
Socialist Alliance | 0 | 0 | 0 | 0.6 | 249 | -0.1% | |||
Independent | 0 | 0 | 0 | 0.4 | 166 | +0.4% | |||
Socialist Alternative | 0 | 0 | 0 | 0.2 | 105 | +0.2% |
Party | Candidate | Votes | % | ± | |
---|---|---|---|---|---|
Conservative | Charles Lister | 641 | 58.2 | -6.7 | |
Labour | James Grant | 232 | 21.1 | +4.2 | |
Liberal Democrat | Richard Law | 228 | 20.7 | +2.6 | |
Majority | 409 | 37.1 | -9.7 | ||
Turnout | 1,101 |
Party | Candidate | Votes | % | ± | |
---|---|---|---|---|---|
Labour | Maire Darker | 796 | 42.6 | +5.0 | |
Conservative | Matthew McCue | 479 | 25.6 | +8.1 | |
Liberal Democrat | Tel Hudson | 363 | 19.4 | -19.2 | |
Green | Karsten Evans | 161 | 8.6 | +8.6 | |
Socialist Alliance | Andrew Newman | 69 | 3.7 | +3.7 | |
Majority | 317 | 17.0 | |||
Turnout | 1,868 |
Party | Candidate | Votes | % | ± | |
---|---|---|---|---|---|
Conservative | Dale Heenan | 1,327 | 52.1 | -1.3 | |
Labour | Patricia Spry | 834 | 32.7 | +1.8 | |
Liberal Democrat | Ellen Aylett | 386 | 15.2 | -0.5 | |
Majority | 493 | 19.4 | -3.1 | ||
Turnout | 2,547 |
Party | Candidate | Votes | % | ± | |
---|---|---|---|---|---|
Conservative | Roderick Bluh | 1,232 | 50.6 | +6.6 | |
Labour | David Cox | 792 | 32.5 | -9.7 | |
Liberal Democrat | Kathleen McCarthy | 411 | 16.9 | +3.1 | |
Majority | 440 | 18.1 | +16.3 | ||
Turnout | 2,435 |
Party | Candidate | Votes | % | ± | |
---|---|---|---|---|---|
Liberal Democrat | Stanley Pajak | 978 | 46.2 | -7.5 | |
Conservative | Brenda Craven | 452 | 21.3 | +1.0 | |
Labour | Richard Young | 443 | 20.9 | -5.1 | |
Green | Christine Smith | 245 | 11.6 | +11.6 | |
Majority | 526 | 24.8 | -3.0 | ||
Turnout | 2,118 |
Party | Candidate | Votes | % | ± | |
---|---|---|---|---|---|
Conservative | Peter Greenhalgh | 1,013 | 42.7 | +8.2 | |
Liberal Democrat | Tracy Fisher | 942 | 39.7 | -7.2 | |
Labour | Sarah Bush | 418 | 17.6 | -1.0 | |
Majority | 71 | 3.0 | |||
Turnout | 2,373 |
Party | Candidate | Votes | % | ± | |
---|---|---|---|---|---|
Labour | Ericqua Ballman | 701 | 44.2 | +3.8 | |
Conservative | Halina Roberts | 429 | 27.1 | +3.8 | |
Liberal Democrat | Jacob Pajak | 275 | 17.4 | -6.2 | |
Socialist Alliance | Roy North | 180 | 11.4 | -1.3 | |
Majority | 272 | 17.2 | +0.4 | ||
Turnout | 1,585 |
Party | Candidate | Votes | % | ± | |
---|---|---|---|---|---|
Conservative | Wayne Lawley | 1,271 | 54.7 | +2.2 | |
Labour | John Keepin | 576 | 24.8 | -2.5 | |
Liberal Democrat | Derek Richards | 475 | 20.5 | +0.3 | |
Majority | 695 | 29.9 | +4.7 | ||
Turnout | 2,322 |
Party | Candidate | Votes | % | ± | |
---|---|---|---|---|---|
Conservative | Anthony Peake | 1,260 | 51.1 | +3.9 | |
Labour | Lynn Vardy | 633 | 25.7 | -9.0 | |
Liberal Democrat | Jennifer Shorten | 371 | 15.1 | -3.0 | |
Green | Andrew Day | 200 | 8.1 | +8.1 | |
Majority | 627 | 25.4 | +13.0 | ||
Turnout | 2,464 |
Party | Candidate | Votes | % | ± | |
---|---|---|---|---|---|
Conservative | Colin Lovell | 954 | 44.1 | +5.1 | |
Labour | James D'Avila | 830 | 38.4 | -2.1 | |
Liberal Democrat | Andrew Sharp | 274 | 12.7 | -2.8 | |
Socialist Alternative | Jean Walker | 105 | 4.9 | +4.9 | |
Majority | 124 | 5.7 | |||
Turnout | 2,163 |
Party | Candidate | Votes | % | ± | |
---|---|---|---|---|---|
Conservative | Michael Bawden | 1,954 | 56.0 | +1.2 | |
Liberal Democrat | Mark Wheaver | 883 | 25.3 | -6.5 | |
Green | John Hughes | 342 | 9.8 | +3.4 | |
Labour | Michael Szymanski | 308 | 8.8 | +1.7 | |
Majority | 1,071 | 30.7 | +7.7 | ||
Turnout | 3,487 |
Party | Candidate | Votes | % | ± | |
---|---|---|---|---|---|
Labour | Stephen Allsopp | 686 | 43.7 | -10.0 | |
Conservative | Natasha Young | 371 | 23.6 | -0.7 | |
Liberal Democrat | Helen Thompson | 340 | 21.6 | -0.4 | |
Green | Melvin Collins | 174 | 11.1 | +11.1 | |
Majority | 315 | 20.1 | -9.4 | ||
Turnout | 1,571 |
Party | Candidate | Votes | % | ± | |
---|---|---|---|---|---|
Conservative | Andrew Bennett | 600 | 54.7 | ||
Liberal Democrat | Adelaide Dudman | 393 | 35.9 | ||
Labour | Ruairi Tobin | 103 | 9.4 | ||
Majority | 207 | 18.9 | |||
Turnout | 1,096 |
Party | Candidate | Votes | % | ± | |
---|---|---|---|---|---|
Conservative | Nicholas Martin | 1,213 | 54.9 | +5.7 | |
Labour | Neil Heavens | 353 | 16.0 | -8.9 | |
Liberal Democrat | Amber Johnson | 307 | 13.9 | -12.0 | |
Green | Linda Lee | 170 | 7.7 | +7.7 | |
Independent | James Withey | 166 | 7.5 | +7.5 | |
Majority | 860 | 38.9 | +15.7 | ||
Turnout | 2,209 |
Party | Candidate | Votes | % | ± | |
---|---|---|---|---|---|
Conservative | Raymond Fisher | 1,302 | 54.4 | +0.0 | |
Labour | Michael Spry | 647 | 27.0 | -2.0 | |
Liberal Democrat | David Payne | 445 | 18.6 | +1.9 | |
Majority | 655 | 27.4 | +2.0 | ||
Turnout | 2,394 |
Party | Candidate | Votes | % | ± | |
---|---|---|---|---|---|
Conservative | Philip Sharp | 1,182 | 43.9 | -1.7 | |
Labour | Teresa Page | 1,091 | 40.6 | +2.4 | |
Liberal Democrat | Jose Tocha | 240 | 8.9 | -7.3 | |
Green | Raymond Smith | 177 | 6.6 | +6.6 | |
Majority | 91 | 3.4 | -4.1 | ||
Turnout | 2,690 |
Party | Candidate | Votes | % | ± | |
---|---|---|---|---|---|
Conservative | Dwynwen Martin | 841 | 48.2 | -2.2 | |
Labour | Norman Butler | 443 | 25.4 | -3.5 | |
Liberal Democrat | Judith Peppitt | 259 | 14.9 | -5.8 | |
Green | Marilyn Harrison | 201 | 11.5 | +11.5 | |
Majority | 398 | 22.8 | +1.2 | ||
Turnout | 1,744 |
Party | Candidate | Votes | % | ± | |
---|---|---|---|---|---|
Labour | Mavis Childs | 745 | 41.8 | +6.4 | |
Conservative | Russell Holland | 601 | 33.7 | -7.2 | |
Liberal Democrat | David Pajak | 307 | 17.2 | -6.5 | |
Green | Simon Smith | 128 | 7.2 | +7.2 | |
Majority | 144 | 8.1 | |||
Turnout | 1,781 |
Party | Candidate | Votes | % | ± | |
---|---|---|---|---|---|
Labour | Michael Barnes | 928 | 38.4 | -4.9 | |
Conservative | Mark Edwards | 805 | 33.3 | +7.3 | |
UKIP | Michael Morton | 311 | 12.9 | +4.5 | |
Liberal Democrat | Rebecca Poole | 251 | 10.4 | -11.9 | |
Green | Raymond Burcham | 121 | 5.0 | +5.0 | |
Majority | 123 | 5.1 | -12.2 | ||
Turnout | 2416 |
Party | Candidate | Votes | % | ± | |
---|---|---|---|---|---|
Conservative | Brian Ford | 1,539 | 55.9 | +9.7 | |
Liberal Democrat | Victor Godman | 621 | 22.5 | -11.7 | |
Labour | Sandra Parsons | 412 | 15.0 | -4.6 | |
Green | Robert Heritage | 182 | 6.6 | +6.6 | |
Majority | 918 | 33.3 | +21.3 | ||
Turnout | 2,754 |
The 2004 West Lancashire District Council election took place on 10 June 2004 to elect members of West Lancashire District Council in Lancashire, England. One third of the council was up for election and the Conservative party stayed in overall control of the council.
As a result of the 2009 structural changes to local government in England, the former Wiltshire County Council and the four districts within its geographical area were replaced by the new Wiltshire Council, which is a unitary authority covering the same area, with elections continuing to be held every four years, beginning in June 2009. Previously, Wiltshire County Council had been elected between 1889 and 2005, initially every three years, later every four years.
Wiltshire Council is a council for the unitary authority of Wiltshire in South West England, created in 2009. It is the successor authority to Wiltshire County Council (1889–2009) and the four district councils of Kennet, North Wiltshire, Salisbury, and West Wiltshire, all of which were created in 1974 and abolished in 2009.
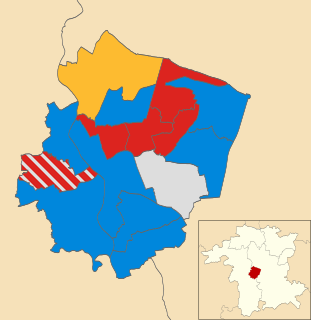
The 2004 Worcester City Council election took place on 10 June 2004 to elect members of Worcester District Council in Worcestershire, England. The whole council was up for election with boundary changes since the last election in 2003 reducing the number of seats by one. The Conservative party stayed in overall control of the council.
The 2004 Wokingham District Council election took place on 10 June 2004 to elect members of Wokingham Unitary Council in Berkshire, England. The whole council was up for election with boundary changes since the last election in 2003. The Conservative party stayed in overall control of the council.
The 2004 Woking Council election took place on 10 June 2004 to elect members of Woking Borough Council in Surrey, England. One third of the council was up for election and the council stayed under no overall control.
The 2004 Winchester Council election took place on 10 June 2004 to elect members of Winchester District Council in Hampshire, England. One third of the council was up for election and the Liberal Democrats lost overall control of the council to no overall control.
The 2004 Stratford-on-Avon District Council election took place on 10 June 2004 to elect members of Stratford-on-Avon District Council in Warwickshire, England. One third of the council was up for election and the Conservative party stayed in overall control of the council.
The 2004 Hart Council election took place on 10 June 2004 to elect members of Hart District Council in Hampshire, England. One third of the council was up for election and the Conservative party stayed in overall control of the council.
The 1998 Swindon Borough Council election took place on 7 May 1998 to elect members of Swindon Unitary Council in Wiltshire, England. One third of the council was up for election and the Labour party stayed in overall control of the council.
The 1999 Swindon Borough Council election took place on 6 May 1999 to elect members of Swindon Unitary Council in Wiltshire, England. One third of the council was up for election and the Labour party stayed in overall control of the council.
The 2002 Swindon Borough Council election took place on 2 May 2002 to elect members of Swindon Unitary Council in Wiltshire, England. One third of the council was up for election and the council stayed under no overall control.
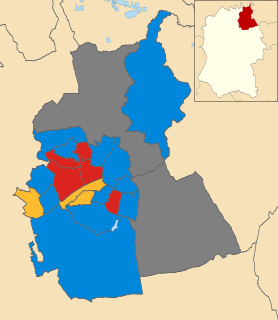
The 2003 Swindon Borough Council election took place on 1 May 2003 to elect members of Swindon Unitary Council in Wiltshire, England. One third of the council was up for election and the council stayed under no overall control.
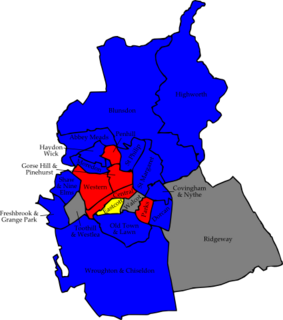
The 2006 Swindon Borough Council election took place on 4 May 2006 to elect members of Swindon Unitary Council in Wiltshire, England. One third of the council was up for election and the Conservative party stayed in overall control of the council.
The 2007 Swindon Borough Council election took place on 4 May 2007 to elect members of Swindon Unitary Council in Wiltshire, England. One third of the council was up for election and the Conservative party stayed in overall control of the council.
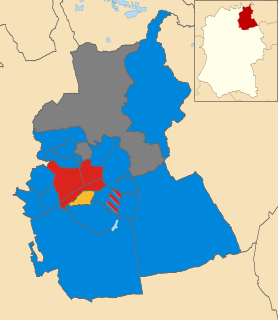
The 2008 Swindon Borough Council election took place on 4 May 2008 to elect members of Swindon Unitary Council in Wiltshire, England. One third of the council was up for election and the Conservative party stayed in overall control of the council.
The 2004 Waveney Council election took place on 10 June 2004 to elect members of Waveney District Council in Suffolk, England. One third of the council was up for election and the council stayed under no overall control.
The 2006 Sunderland Council election took place on 4 May 2006 to elect members of Sunderland City Council in Tyne and Wear, England. One third of the Council was up for election and the Labour party stayed in overall control.
The 2004 Harrogate Council election took place on 10 June 2004 to elect members of Harrogate Borough Council in North Yorkshire, England. One third of the council was up for election and the Conservative party stayed in overall control of the council.
The 2011 Swindon Borough Council election took place on 5 May 2011 to elect members of Swindon Unitary Council in Wiltshire, England. One third of the council was up for election and the Conservative party stayed in overall control of the council.