The 2007 Swindon Borough Council election took place on 4 May 2007 to elect members of Swindon Unitary Council in Wiltshire, England. One third of the council was up for election and the Conservative party stayed in overall control of the council. [1]
A unitary authority is a type of local authority that has a single tier and is responsible for all local government functions within its area or performs additional functions which elsewhere in the relevant country are usually performed by national government or a higher level of sub-national government.
Wiltshire is a county in South West England with an area of 3,485 km2. It is landlocked and borders the counties of Dorset, Somerset, Hampshire, Gloucestershire, Oxfordshire and Berkshire. The county town was originally Wilton, after which the county is named, but Wiltshire Council is now based in the county town of Trowbridge.
England is a country that is part of the United Kingdom. It shares land borders with Wales to the west and Scotland to the north-northwest. The Irish Sea lies west of England and the Celtic Sea lies to the southwest. England is separated from continental Europe by the North Sea to the east and the English Channel to the south. The country covers five-eighths of the island of Great Britain, which lies in the North Atlantic, and includes over 100 smaller islands, such as the Isles of Scilly and the Isle of Wight.
After the election, the composition of the council was
92 candidates were contesting 21 seats with 2 seats available in Haydon Wick wards. [3] [4] Both Conservative and Labour parties contested every seat, while the Liberal Democrats had 20 candidates. [3] Other political parties contesting the election included the Green party with 16 candidates, United Kingdom Independence Party with 7 and the British National Party with 3. [3]
The civil parish of Haydon Wick is a northern suburb of the town of Swindon, Wiltshire, in England. It has a population in excess of 20,000.
The Labour Party is a centre-left political party in the United Kingdom which has been described as an alliance of social democrats, democratic socialists and trade unionists. The party's platform emphasises greater state intervention, social justice and strengthening workers' rights. Labour is a full member of the Party of European Socialists and Progressive Alliance, and holds observer status in the Socialist International. As of 2017, the party was considered the "largest party in Western Europe" in terms of party membership, with more than half a million members.
The Liberal Democrats are a liberal, centrist political party in the United Kingdom. They presently have 11 Members of Parliament in the House of Commons, 96 members of the House of Lords, and one member of the European Parliament. They also have five Members of the Scottish Parliament and a member each in the Welsh Assembly and London Assembly. The party reached the height of its influence in the early 2010s, forming a junior partner in a coalition government from 2010 to 2015. It is presently led by Vince Cable.
Issues in the election included regeneration of the town, affordable housing, crime [5] and preserving green space. [6] The Conservative council's plans to move to fortnightly rubbish collection were also criticised by the Labour party. [7]
Affordable housing is housing which is deemed affordable to those with a median household income or below as rated by the national government or a local government by a recognized housing affordability index. Most of the literature on affordable housing refers to mortgages and number of forms that exist along a continuum – from emergency shelters, to transitional housing, to non-market rental, to formal and informal rental, indigenous housing, and ending with affordable home ownership.
For the election voters were able to cast their vote at any polling station or library instead of just their polling station, as well as internet and text voting being available. [3] [8] The vote count was also done electronically, however problems at a few polling stations meant some votes had to be checked manually. [9] This meant the election count was 2 hours later than expected, [10] with overall turnout in the election being 33.8%. [11]
Voter turnout is the percentage of eligible voters who cast a ballot in an election. Eligibility varies by country, and the voting-eligible population should not be confused with the total adult population. Age and citizenship status are often among the criteria used to determine eligibility, but some countries further restrict eligibility based on sex, race, or religion.
The results saw the Conservatives stay in control of the council with 43 seats, compared to 13 for Labour and 3 Liberal Democrats. [10] Both the Conservative and Labour parties made 2 gains, with each party taking 1 seat from the other. [12] The Conservatives gained Moredon from Labour, while Labour took a seat back in Central ward. [12] Both parties also gained a seat from an independent, with the Conservatives taking Freshbrook and Grange Park, while Labour took Penhill. [12] Elsewhere Conservative candidates held on by small majorities of 36 and 45 over Labour in St Philip and Walcot wards respectively. [12]
Party | Seats | Gains | Losses | Net gain/loss | Seats % | Votes % | Votes | +/− | |
---|---|---|---|---|---|---|---|---|---|
Conservative | 15 | 2 | 1 | +1 | 71.4 | 46.8 | 23,429 | -0.8% | |
Labour | 5 | 2 | 1 | +1 | 23.8 | 28.9 | 14,458 | -1.3% | |
Liberal Democrat | 1 | 0 | 0 | 0 | 4.8 | 13.2 | 6,635 | -0.9% | |
Green | 0 | 0 | 0 | 0 | 0 | 5.9 | 2,946 | +0.1% | |
UKIP | 0 | 0 | 0 | 0 | 0 | 3.7 | 1,875 | +3.7% | |
BNP | 0 | 0 | 0 | 0 | 0 | 1.2 | 597 | +0.5% | |
Independent | 0 | 0 | 2 | -2 | 0 | 0.3 | 165 | -0.7% |
Party | Candidate | Votes | % | ± | |
---|---|---|---|---|---|
Conservative | Peter Stoddart | 1,639 | 69.3 | -1.1 | |
Labour | Ian Carroll | 375 | 15.9 | +2.1 | |
Liberal Democrat | Richard Law | 204 | 8.6 | +0.2 | |
Green | Richard Uzzell | 146 | 6.2 | -1.2 | |
Majority | 1,264 | 53.5 | -3.1 | ||
Turnout | 2,364 | 26.8 | |||
Conservative hold | Swing | -1.6% |
Party | Candidate | Votes | % | ± | |
---|---|---|---|---|---|
Labour | Derique Montaut | 1,092 | 47.1 | +0.6 | |
Conservative | Karen Leakey | 663 | 28.6 | -1.1 | |
Liberal Democrat | Steven Pipe | 301 | 13.0 | -1.7 | |
Green | Karsten Evans | 156 | 6.7 | +0.3 | |
Independent | David Cox | 105 | 4.5 | +1.9 | |
Majority | 429 | 18.5 | +1.7 | ||
Turnout | 2,317 | 30.9 | |||
Labour gain from Conservative | Swing | +0.8% | |||
Party | Candidate | Votes | % | ± | |
---|---|---|---|---|---|
Conservative | Glenn Smith | 1,497 | 54.2 | -3.3 | |
Labour | Maureen Dilley | 743 | 26.9 | -15.6 | |
UKIP | Cynthia Desmond | 323 | 11.7 | +11.7 | |
Liberal Democrat | David Pajak | 199 | 7.2 | +7.2 | |
Majority | 754 | 27.3 | +12.2 | ||
Turnout | 2,762 | 40.8 | |||
Conservative hold | Swing | +6.1% |
Party | Candidate | Votes | % | ± | |
---|---|---|---|---|---|
Conservative | Andy Albinson | 1,384 | 57.6 | +8.5 | |
Labour | Sally Lee | 718 | 29.9 | -0.5 | |
Green | Daniel Fraser | 301 | 12.5 | +4.0 | |
Majority | 666 | 27.7 | +9.1 | ||
Turnout | 2,403 | 35.5 | |||
Conservative hold | Swing | +4.5% |
Party | Candidate | Votes | % | ± | |
---|---|---|---|---|---|
Liberal Democrat | Martin Wiltshire | 879 | 39.6 | -9.3 | |
Conservative | Paul Gregory | 551 | 24.9 | +5.2 | |
Labour | Sarah Bush | 526 | 23.7 | +3.0 | |
Green | Bill Hughes | 261 | 11.8 | +1.1 | |
Majority | 328 | 14.8 | -13.4 | ||
Turnout | 2,217 | 29.6 | |||
Liberal Democrat hold | Swing | -7.2% |
Party | Candidate | Votes | % | ± | |
---|---|---|---|---|---|
Conservative | Michael Dickinson | 1,152 | 49.0 | +3.8 | |
Liberal Democrat | Judith Peppitt | 669 | 28.5 | -5.0 | |
Labour | Carol Heavens | 393 | 16.7 | +2.1 | |
Green | Jim Santaniello | 136 | 5.8 | -0.9 | |
Majority | 483 | 20.6 | +8.9 | ||
Turnout | 2,350 | 31.2 | |||
Conservative gain from Independent | Swing | +4.4% | |||
Party | Candidate | Votes | % | ± | |
---|---|---|---|---|---|
Labour | John Ballman | 850 | 44.8 | +3.5 | |
Conservative | Louise Gallavin | 485 | 25.6 | +4.5 | |
BNP | Reg Bates | 212 | 11.2 | -4.8 | |
Liberal Democrat | Les Wood | 154 | 8.1 | -0.4 | |
UKIP | Robin Tingey | 104 | 5.5 | +5.5 | |
Green | Neil Gutteridge | 91 | 4.8 | +4.8 | |
Majority | 365 | 19.3 | -0.9 | ||
Turnout | 1,896 | 27.8 | |||
Labour hold | Swing | -1.0% |
Party | Candidate | Votes | % | ± | |
---|---|---|---|---|---|
Conservative | Ian Dobie | 1,320 | |||
Conservative | Rex Barnett | 1,299 | |||
Labour | John Keepin | 651 | |||
Labour | Mark Dempsey | 614 | |||
Green | Emma Bushell | 298 | |||
UKIP | Michael Stuckey | 270 | |||
Liberal Democrat | Ann Morgan | 252 | |||
Liberal Democrat | Andrew Sharp | 227 | |||
Turnout | 4,931 | 34.8 | |||
Conservative hold | Swing | ||||
Conservative hold | Swing |
Party | Candidate | Votes | % | ± | |
---|---|---|---|---|---|
Conservative | Melanie Duff | 1,492 | 56.8 | +2.0 | |
Labour | Gerald Edwards | 696 | 26.5 | -0.1 | |
Green | Andy Day | 257 | 9.8 | -1.1 | |
Liberal Democrat | Hannah Pajak | 184 | 7.0 | -0.8 | |
Majority | 796 | 30.3 | +2.1 | ||
Turnout | 2,629 | 40.5 | |||
Conservative hold | Swing | +1.0% |
Party | Candidate | Votes | % | ± | |
---|---|---|---|---|---|
Conservative | Stephanie Exell | 1,187 | 47.7 | +2.7 | |
Labour | Maureen Caton | 885 | 35.6 | -7.8 | |
UKIP | Kathleen Webb | 218 | 8.8 | +8.8 | |
Liberal Democrat | Heidi Teague | 197 | 7.9 | -3.7 | |
Majority | 302 | 12.1 | +10.5 | ||
Turnout | 2,487 | 33.7 | |||
Conservative gain from Labour | Swing | +5.2% | |||
Party | Candidate | Votes | % | ± | |
---|---|---|---|---|---|
Conservative | Fionuala Foley | 2,044 | 58.7 | +0.1 | |
Liberal Democrat | Mark Wheaver | 543 | 15.6 | -1.4 | |
Labour | Cindy Matthews | 468 | 13.4 | -0.9 | |
Green | Christine Smith | 245 | 7.0 | -3.1 | |
UKIP | Terrence Hayward | 180 | 5.2 | +5.2 | |
Majority | 1,501 | 43.1 | +1.5 | ||
Turnout | 3,480 | 43.8 | |||
Conservative hold | Swing | +0.8% |
Party | Candidate | Votes | % | ± | |
---|---|---|---|---|---|
Labour | Fay Howard | 775 | 40.9 | -1.7 | |
Conservative | Graham Cherry | 603 | 31.8 | -3.8 | |
BNP | Chris Southgate | 223 | 11.8 | +11.8 | |
Liberal Democrat | Helen Thompson | 213 | 11.2 | +11.2 | |
Green | David Miles | 81 | 4.3 | -17.5 | |
Majority | 172 | 9.1 | +2.1 | ||
Turnout | 1,895 | 27.7 | |||
Labour hold | Swing | +1.0% |
Party | Candidate | Votes | % | ± | |
---|---|---|---|---|---|
Labour | Paul Baker | 519 | 41.7 | -3.5 | |
Liberal Democrat | Tel Hudson | 314 | 25.2 | -5.7 | |
Conservative | Halina Tomlinson | 249 | 20.0 | -3.9 | |
BNP | Ken Waters | 162 | 13.0 | +13.0 | |
Majority | 205 | 16.5 | +2.2 | ||
Turnout | 1,244 | 27.8 | |||
Labour gain from Independent | Swing | +1.1% | |||
Party | Candidate | Votes | % | ± | |
---|---|---|---|---|---|
Conservative | Garry Perkins | 1,244 | 56.1 | -4.1 | |
Liberal Democrat | James Farr | 392 | 17.7 | +4.8 | |
Labour | Mary Gladman | 375 | 16.9 | -1.2 | |
Green | Jennifer Miles | 207 | 9.3 | +0.5 | |
Majority | 852 | 38.4 | -3.7 | ||
Turnout | 2,218 | 31.7 | |||
Conservative hold | Swing | -4.4% |
Party | Candidate | Votes | % | ± | |
---|---|---|---|---|---|
Conservative | Russell Holland | 1,325 | 51.8 | -11.6 | |
Labour | Michael Spry | 728 | 28.5 | -8.1 | |
Liberal Democrat | Peter Wood | 264 | 10.3 | +10.3 | |
UKIP | Robert Feal-Martinez | 239 | 9.4 | +9.4 | |
Majority | 597 | 23.4 | -3.5 | ||
Turnout | 2,556 | 32.3 | |||
Conservative hold | Swing | -1.7% |
Party | Candidate | Votes | % | ± | |
---|---|---|---|---|---|
Conservative | Paul Findlow | 1,254 | 41.9 | +0.1 | |
Labour | Teresa Page | 1,218 | 40.7 | -0.3 | |
UKIP | Peter Thompson-Watt | 212 | 7.1 | +7.1 | |
Liberal Democrat | Ann Richards | 186 | 6.2 | -2.4 | |
Green | Raymond Smith | 125 | 4.2 | -4.4 | |
Majority | 36 | 1.2 | +0.3 | ||
Turnout | 2,995 | 41.7 | |||
Conservative hold | Swing | +0.2% |
Party | Candidate | Votes | % | ± | |
---|---|---|---|---|---|
Conservative | Steve Wakefield | 979 | 52.3 | +4.1 | |
Labour | Junab Ali | 411 | 21.9 | -3.5 | |
Liberal Democrat | Christopher Shepherd | 297 | 15.9 | +1.0 | |
Green | Marilyn Harrison | 186 | 9.9 | -1.6 | |
Majority | 568 | 30.3 | +7.5 | ||
Turnout | 1,873 | 32.3 | |||
Conservative hold | Swing | +3.8% |
Party | Candidate | Votes | % | ± | |
---|---|---|---|---|---|
Conservative | Peter Mallinson | 756 | 39.0 | +5.3 | |
Labour | Neil Heavens | 711 | 36.7 | -5.1 | |
Liberal Democrat | Kathy McCarthy | 249 | 12.9 | -4.3 | |
UKIP | Stephen Halden | 141 | 7.3 | +7.3 | |
Green | Ray Burcham | 80 | 4.1 | -3.1 | |
Majority | 45 | 2.3 | |||
Turnout | 1,937 | 34.7 | |||
Conservative hold | Swing | +5.2% |
Party | Candidate | Votes | % | ± | |
---|---|---|---|---|---|
Labour | Des Moffatt | 1,268 | 49.4 | +3.1 | |
Conservative | Jon Watton | 656 | 25.5 | -7.4 | |
Liberal Democrat | Mark Cousens | 243 | 9.5 | -6.2 | |
UKIP | Greg Heathcliffe | 188 | 7.3 | +7.3 | |
Green | Deborah Schofield | 153 | 6.0 | +6.0 | |
Independent | Michael Morton | 60 | 2.3 | +2.3 | |
Majority | 612 | 23.8 | +10.4 | ||
Turnout | 2,568 | 31.6 | |||
Labour hold | Swing | +5.2% |
Party | Candidate | Votes | % | ± | |
---|---|---|---|---|---|
Conservative | Bill Morton | 1,650 | 55.3 | +0.2 | |
Liberal Democrat | Victor Godman | 668 | 22.4 | +7.6 | |
Labour | Ruairi Tobin | 442 | 14.8 | +0.3 | |
Green | Bob Heritage | 223 | 7.5 | +0.4 | |
Majority | 982 | 32.9 | -7.4 | ||
Turnout | 2,983 | 37.6 | |||
Conservative hold | Swing | -3.7% |
The 2008 St Albans City and District Council election took place on 1 May 2008 to elect members of St Albans District Council in Hertfordshire, England. One third of the council was up for election and the Liberal Democrats gained overall control of the council from no overall control.
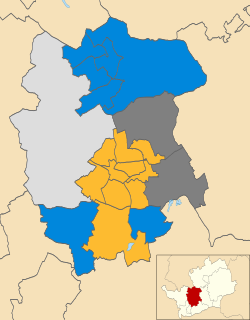
The 2007 St Albans City and District Council election took place on 3 May 2007 to elect members of St Albans District Council in Hertfordshire, England. One third of the council was up for election and the Liberal Democrats lost overall control of the council to no overall control.
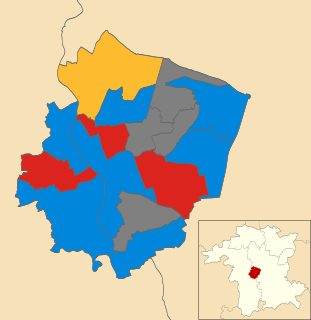
The 2007 Worcester City Council election took place on 3 May 2007 to elect members of Worcester District Council in Worcestershire, England. One third of the council was up for election and the Conservative party stayed in overall control of the council.
The 2007 Winchester Council election took place on 3 May 2007 to elect members of Winchester District Council in Hampshire, England. One third of the council was up for election and the Conservative party stayed in overall control of the council.
The 2010 St Albans City and District Council election took place on 6 May 2010 to elect members of St Albans District Council in Hertfordshire, England. One third of the council was up for election and the Liberal Democrats stayed in overall control of the council.
The 2010 West Lancashire Borough Council election took place on 6 May 2010 to elect members of West Lancashire Borough Council in Lancashire, England. One third of the council was up for election and the Conservative party stayed in overall control of the council.
The 2006 Rushmoor Council election took place on 4 May 2006 to elect members of Rushmoor Borough Council in Hampshire, England. One third of the council was up for election and the Conservative party stayed in overall control of the council.
The 2007 Rushmoor Council election took place on 3 May 2007 to elect members of Rushmoor Borough Council in Hampshire, England. One third of the council was up for election and the Conservative party stayed in overall control of the council.
The 2002 Swindon Borough Council election took place on 2 May 2002 to elect members of Swindon Unitary Council in Wiltshire, England. One third of the council was up for election and the council stayed under no overall control.
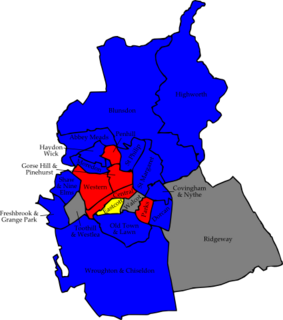
The 2006 Swindon Borough Council election took place on 4 May 2006 to elect members of Swindon Unitary Council in Wiltshire, England. One third of the council was up for election and the Conservative party stayed in overall control of the council.
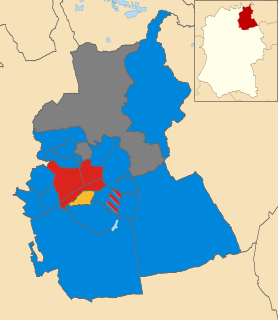
The 2008 Swindon Borough Council election took place on 4 May 2008 to elect members of Swindon Unitary Council in Wiltshire, England. One third of the council was up for election and the Conservative party stayed in overall control of the council.
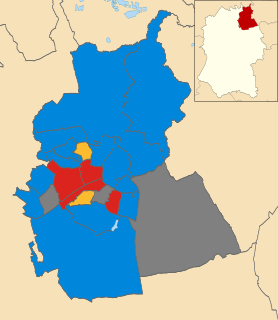
The 2010 Swindon Borough Council election took place on 6 May 2010 to elect members of Swindon Unitary Council in Wiltshire, England. One third of the council was up for election and the Conservative party stayed in overall control of the council.
The 2008 Fareham Council election took place on 1 May 2008 to elect members of Fareham Borough Council in Hampshire, England. Half of the council was up for election and the Conservative party stayed in overall control of the council.
The 2006 Solihull Metropolitan Borough Council election took place on 4 May 2006 to elect members of Solihull Metropolitan Borough Council in the West Midlands, England. One third of the council was up for election and the Conservative party stayed in overall control of the council.
The 2006 Sunderland Council election took place on 4 May 2006 to elect members of Sunderland City Council in Tyne and Wear, England. One third of the Council was up for election and the Labour party stayed in overall control.
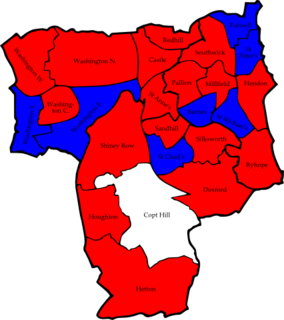
The 2007 Sunderland Council election took place on 3 May 2007 to elect members of Sunderland Metropolitan Borough Council in Tyne and Wear, England. One third of the council was up for election and the Labour party stayed in overall control of the council.
The 2010 Sunderland Council election took place on 6 May 2010 to elect members of Sunderland Metropolitan Borough Council in Tyne and Wear, England. One third of the council was up for election and the Labour party stayed in overall control of the council. The election took place on the same day as the 2010 General Election.
The 2007 Harrogate Council election took place on 3 May 2007 to elect members of Harrogate Borough Council in North Yorkshire, England. One third of the council was up for election and the council stayed under no overall control.
The 2011 council elections in Guildford saw the Conservatives retain control over Guildford Borough Council with an increased majority of 20 seats. Full results for each ward can be found at Guildford Council election, full results, 2011.
The 2011 Swindon Borough Council election took place on 5 May 2011 to elect members of Swindon Unitary Council in Wiltshire, England. One third of the council was up for election and the Conservative party stayed in overall control of the council.