| |||||||||
| |||||||||
|
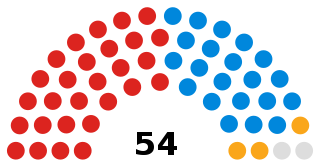
Elections for the whole of Telford and Wrekin Council took place on 10 May 2011. 54 councillors were elected in 33 wards and the Labour Party took control from the Conservatives. There were no boundary changes taking effect at this election.
Telford and Wrekin Council is the local authority of Telford and Wrekin in Shropshire, England. It is a unitary authority, having the powers of a non-metropolitan county and district council combined. The district of Telford and Wrekin was granted borough status in 2002, though the council does not ordinarily include "Borough" in its name.
The Labour Party is a centre-left political party in the United Kingdom which has been described as an alliance of social democrats, democratic socialists and trade unionists. The party's platform emphasises greater state intervention, social justice and strengthening workers' rights. Labour is a full member of the Party of European Socialists and Progressive Alliance, and holds observer status in the Socialist International. As of 2017, the party was considered the "largest party in Western Europe" in terms of party membership, with more than half a million members.
The Conservative Party, officially the Conservative and Unionist Party, is a centre-right political party in the United Kingdom. Presently led by Theresa May, it has been the governing party since 2010. It presently has 314 Members of Parliament in the House of Commons, 249 members of the House of Lords, and 18 members of the European Parliament. It also has 31 Members of the Scottish Parliament, 12 members of the Welsh Assembly, eight members of the London Assembly and 9,008 local councillors. One of the major parties of UK politics, it has formed the government on 45 occasions, more than any other party.
The Conservatives lost control to Labour, who gained 16 seats.
Party | Seats | Gains | Losses | Net gain/loss | Seats % | Votes % | Votes | +/− | |
---|---|---|---|---|---|---|---|---|---|
Labour | 33 | 14 | - | +14 | 45.2 | 38943 | |||
Conservative | 17 | 1 | 9 | -8 | 39.7 | 34229 | |||
Liberal Democrat | 3 | - | - | 0 | 3.4 | 2935 | |||
Independent | 1 | - | 3 | -3 | 4.7 | 4053 | |||
Telford and Wrekin People's Association | 0 | - | 3 | -3 | 3.5 | 2987 | |||
UKIP | 0 | - | - | 0 | 2.2 | 1882 | |||
0 | - | - | 0 | 1.3 | 1091 | ||||
BNP | 0 | - | - | 0 | 0.2 | 145 | |||
Seat gains/losses are in relation to the previous whole council election in 2007. During the intervening time, four seats changes hands in by-elections; the Conservatives gained four seats, 2 losses each from Labour and Independents.
Successful candidates are in bold; defending incumbents are indicated by "*". Percentages are of the total number of votes cast (In multiple member wards, each voter may vote once for each vacancy, i.e., in a three-member ward each voter has three votes).
Party | Candidate | Votes | % | ± | |
---|---|---|---|---|---|
Liberal Democrat | Karen Tracy BLUNDELL* | 616 | 52.25 | ||
Conservative | Barry David TILLOTSON | 358 | 30.36 | ||
Labour | Stuart James WILLIAMS | 205 | 17.39 | ||
Majority | 258 | 21.88 | |||
Turnout | 1179 | 51.41 | |||
Liberal Democrat hold | Swing | ||||
Party | Candidate | Votes | % | ± | |
---|---|---|---|---|---|
Labour | Angela Diane McCLEMENTS* | 699 | 68.33 | ||
Conservative | David Cecil DUCE | 324 | 31.67 | ||
Majority | 375 | 36.66 | |||
Turnout | 1023 | 41.26 | |||
Labour hold | Swing | ||||
Party | Candidate | Votes | % | ± | |
---|---|---|---|---|---|
Labour | Arnold Richard Hugh ENGLAND | 756 | 26.10 | ||
Labour | Jacqueline LOVERIDGE | 746 | 25.76 | ||
Conservative | Nicola ANDERSON | 572 | 19.75 | ||
Conservative | John Alan DIXON | 524 | 18.09 | ||
UKIP | Stuart James PARR | 298 | 10.29 | ||
Majority | 174 | 6.01 | |||
Turnout | 2896 | 33.75 | |||
Labour hold | Swing | ||||
Labour gain from Conservative | Swing | ||||
Party | Candidate | Votes | % | ± | |
---|---|---|---|---|---|
Conservative | Andrew John EADE | 1082 | 78.86 | ||
Labour | Sinah Anne WATKINS | 290 | 21.14 | ||
Majority | 792 | 57.73 | |||
Turnout | 1372 | 53.88 | |||
Conservative hold | Swing | ||||
Party | Candidate | Votes | % | ± | |
---|---|---|---|---|---|
Labour Co-op | Michael Gerard ION | 415 | 37.22 | ||
Independent | MCCARTHY, Patrick Michael John | 368 | 33.00 | ||
Conservative | David Reginald CHAPLIN | 332 | 29.78 | ||
Majority | 47 | 4.22 | |||
Turnout | 1115 | 49.32 | |||
Labour Co-op gain from Independent | Swing | ||||
Party | Candidate | Votes | % | ± | |
---|---|---|---|---|---|
Labour | Derek Robert William WHITE | 801 | 29.20 | ||
Labour | Alan Arthur MACKENZIE* | 735 | 26.80 | ||
Conservative | Graham Phillip HOSSELL* | 615 | 22.42 | ||
Conservative | Pauline HOSSELL | 592 | 21.58 | ||
Majority | 66 | 2.41 | |||
Turnout | 2743 | 37.91 | |||
Labour hold | Swing | ||||
Labour gain from Conservative | Swing | ||||
Party | Candidate | Votes | % | ± | |
---|---|---|---|---|---|
Labour | Frances Molly BOULD | 1315 | 19.92 | ||
Labour | Brian Hereward DUCE | 1243 | 18.82 | ||
Labour | Clive Bertil Ashley ELLIOTT | 961 | 14.55 | ||
Conservative | Alan Edward SCOTT | 917 | 13.89 | ||
Telford and Wrekin People's Association | Victor TONKS* | 877 | 13.28 | ||
Telford and Wrekin People's Association | John Henry JOHNSON | 785 | 11.89 | ||
Telford and Wrekin People's Association | Adrian Gilbert Peter WILLIAMS* | 505 | 7.65 | ||
Majority | 44 | 0.67 | |||
Turnout | 6603 | 40.31 | |||
Labour gain from Telford and Wrekin People's Association | Swing | ||||
Party | Candidate | Votes | % | ± | |
---|---|---|---|---|---|
Labour | Elizabeth Ann CLARE* | 979 | 33.32 | ||
Labour | Clive Neil MASON* | 941 | 32.03 | ||
Conservative | Timothy James NELSON | 448 | 15.25 | ||
Conservative | Rodney Stephen PITT | 405 | 13.78 | ||
Independent | Graham WILLIAMSON | 165 | 5.62 | ||
Majority | 493 | 16.78 | |||
Turnout | 2938 | 34.63 | |||
Labour hold | Swing | ||||
Party | Candidate | Votes | % | ± | |
---|---|---|---|---|---|
Liberal Democrat | Karen Lesley TOMLINSON* | 404 | 41.44 | ||
Conservative | Lesley Barbara STREET | 311 | 31.90 | ||
Labour | Timothy John SKIDMORE | 260 | 26.67 | ||
Majority | 93 | ||||
Turnout | 975 | 50.05 | |||
Liberal Democrat hold | Swing | ||||
Party | Candidate | Votes | % | ± | |
---|---|---|---|---|---|
Conservative | Stephen Peter BURRELL* | 922 | 74.06 | ||
Labour | William Walter BARTON | 323 | 25.94 | ||
Majority | 599 | 48.11 | |||
Turnout | 1245 | 59.88 | |||
Conservative hold | Swing | ||||
Party | Candidate | Votes | % | ± | |
---|---|---|---|---|---|
Conservative | Miles Bewick HOSKEN | 855 | 62.14 | ||
Labour | Mary LEWIS | 521 | 37.86 | ||
Majority | 334 | 24.27 | |||
Turnout | 1376 | 55.81 | |||
Conservative hold | Swing | ||||
Party | Candidate | Votes | % | ± | |
---|---|---|---|---|---|
Conservative | Stephen BENTLEY* | 648 | 52.38 | ||
UKIP | Gillian Elizabeth SEYMOUR | 322 | 26.03 | ||
Labour | Derek GORSE | 267 | 21.58 | ||
Majority | 326 | 26.35 | |||
Turnout | 1237 | 52.28 | |||
Conservative hold | Swing | ||||
Party | Candidate | Votes | % | ± | |
---|---|---|---|---|---|
Labour | Ronald Keith AUSTIN* | 1277 | 17.33 | ||
Labour | Leon Albert MURRAY | 1245 | 16.90 | ||
Labour | Malcolm John SMITH* | 1227 | 16.65 | ||
Conservative | Reginald John SMART | 881 | 11.96 | ||
Conservative | Ronald Ritchie PLENDERLEITH | 764 | 10.37 | ||
Conservative | Roger AVELEY* | 677 | 9.19 | ||
Independent | George ASHCROFT | 449 | 6.09 | ||
Independent | Ann Marie HOUGHTON | 440 | 5.97 | ||
Independent | John James HOUGHTON | 408 | 5.54 | ||
Majority | 346 | 4.70 | |||
Turnout | 7368 | 36.22 | |||
Labour hold | Swing | ||||
Labour gain from Conservative | Swing | ||||
Party | Candidate | Votes | % | ± | |
---|---|---|---|---|---|
Labour | Robert James SLOAN | 584 | 56.21 | ||
Conservative | Rosemary Grace CHAPLIN* | 455 | 43.79 | ||
Majority | 129 | 12.42 | |||
Turnout | 1039 | 43.24 | |||
Labour gain from Conservative | Swing | ||||
Party | Candidate | Votes | % | ± | |
---|---|---|---|---|---|
Conservative | Tracy Jean HOPE* | 517 | 23.50 | ||
Conservative | Clive Paul Richard MOLLETT | 494 | 22.45 | ||
Labour | Michael John Henry MACKENZIE | 485 | 22.05 | ||
Labour | Benjamin James WHITEHOUSE | 444 | 20.18 | ||
Telford and Wrekin People's Association | Graham William George WHITEHEAD | 172 | 7.82 | ||
Telford and Wrekin People's Association | Barry William OLLIVER | 88 | 4.00 | ||
Majority | 9 | 0.41 | |||
Turnout | 2200 | 41.58 | |||
Conservative hold | Swing | ||||
Conservative gain from Independent | Swing | ||||
Party | Candidate | Votes | % | ± | |
---|---|---|---|---|---|
Labour | David Glyn DAVIES | 589 | 52.97 | ||
Conservative | Elizabeth Marte MOLLETT | 523 | 47.03 | ||
Majority | 66 | 5.94 | |||
Turnout | 1112 | 54.48 | |||
Labour hold | Swing | ||||
Party | Candidate | Votes | % | ± | |
---|---|---|---|---|---|
Labour | Hilda RHODES* | 1504 | 20.67 | ||
Labour | Gillian Catherine Withers REYNOLDS | 1160 | 15.94 | ||
Labour | Amrik Singh JHAWAR | 1113 | 15.30 | ||
Conservative | Joy Annice FRANCIS* | 1043 | 14.33 | ||
Conservative | Sean KELLY* | 894 | 12.29 | ||
Conservative | Desmond Cecil PARKINSON | 823 | 11.31 | ||
Steven Andrew George WOOD | 385 | 5.29 | |||
Martin John YOUNG | 354 | 4.87 | |||
Majority | 70 | 0.96 | |||
Turnout | 7276 | 40.86 | |||
Labour gain from Conservative | Swing | ||||
Labour hold | Swing | ||||
Labour gain from Conservative | Swing | ||||
Party | Candidate | Votes | % | ± | |
---|---|---|---|---|---|
Conservative | Elizabeth Jayne GREENAWAY* | 589 | 23.63 | ||
Labour | Frederick Roy PICKEN* | 525 | 21.06 | ||
Labour | Santokho SEKHON | 432 | 17.33 | ||
Conservative | Ronald James WOOD | 294 | 11.79 | ||
Independent | Alan John HUSSEY | 216 | 8.66 | ||
Deborah Ann CRANE | 205 | 8.22 | |||
Telford and Wrekin People's Association | Janet Louise HULME | 131 | 5.25 | ||
Telford and Wrekin People's Association | John David Ralph HIGGINSON | 101 | 4.05 | ||
Majority | 93 | 3.73 | |||
Turnout | 2493 | 36.72 | |||
Conservative hold | Swing | ||||
Labour hold | Swing | ||||
Party | Candidate | Votes | % | ± | |
---|---|---|---|---|---|
Labour | Paul Robert WATLING | 904 | 31.75 | ||
Independent | Gillian Mary GREEN* | 879 | 30.87 | ||
Conservative | David George WRIGHT* | 694 | 24.38 | ||
Conservative | Jeremy Michael James HAIGH | 370 | 13.00 | ||
Majority | 185 | 6.50 | |||
Turnout | 2847 | 44.05 | |||
Independent hold | Swing | ||||
Labour gain from Conservative | Swing | ||||
Party | Candidate | Votes | % | ± | |
---|---|---|---|---|---|
Labour | Kuldip Singh SAHOTA* | 946 | 34.64 | ||
Labour | Shaun DAVIES | 893 | 32.70 | ||
Conservative | Catherine Ann WORTHING | 305 | 11.17 | ||
Conservative | William Leonard WORTHING | 259 | 9.48 | ||
Telford and Wrekin People's Association | Christine Ann CHOUDHARY | 184 | 6.74 | ||
Telford and Wrekin People's Association | Mohammed Nasir CHOUDHARY | 144 | 5.27 | ||
Majority | 588 | 21.53 | |||
Turnout | 2731 | 35.22 | |||
Labour hold | Swing | ||||
Party | Candidate | Votes | % | ± | |
---|---|---|---|---|---|
Conservative | Nigel Arthur DUGMORE | 1079 | 30.06 | ||
Conservative | Adrian LAWRENCE* | 993 | 27.67 | ||
Labour | Veronica Jill BROWN | 641 | 17.86 | ||
Labour | Dylan HARRISON | 546 | 15.21 | ||
Liberal Democrat | Lee James DARGUE | 330 | 9.19 | ||
Majority | 352 | 9.81 | |||
Turnout | 3589 | 41.98 | |||
Conservative hold | Swing | ||||
Party | Candidate | Votes | % | ± | |
---|---|---|---|---|---|
Conservative | Eric James CARTER* | 628 | 64.02 | ||
Labour | Nigel Humphrey FOSKETT | 353 | 35.98 | ||
Majority | 275 | 28.03 | |||
Turnout | 981 | 49.72 | |||
Conservative hold | Swing | ||||
Party | Candidate | Votes | % | ± | |
---|---|---|---|---|---|
Conservative | Roy Geoffrey SCAMMELL | 711 | 61.77 | ||
Labour Co-op | Philip David NORTON | 440 | 38.23 | ||
Majority | 271 | 23.54 | |||
Turnout | 1151 | 50.21 | |||
Conservative hold | Swing | ||||
Party | Candidate | Votes | % | ± | |
---|---|---|---|---|---|
Conservative | Adrian Alma MEREDITH | 712 | 69.53 | ||
Labour | Jane CALLISTER | 312 | 30.47 | ||
Majority | 400 | 39.06 | |||
Turnout | 1024 | 50.91 | |||
Conservative hold | Swing | ||||
Party | Candidate | Votes | % | ± | |
---|---|---|---|---|---|
Conservative | Adam John STANTON* | 606 | 63.99 | ||
Labour | Alexander Philip Charles KEEN | 341 | 36.01 | ||
Majority | 265 | 27.98 | |||
Turnout | 947 | 45.80 | |||
Conservative hold | Swing | ||||
Party | Candidate | Votes | % | ± | |
---|---|---|---|---|---|
Labour | Benjamin John THOMPSON | 352 | 32.35 | ||
Conservative | Anthony BENTLEY | 335 | 30.79 | ||
UKIP | Denis Graham ALLEN | 224 | 20.59 | ||
Liberal Democrat | David John HOLLOWAY | 177 | 16.27 | ||
Majority | 17 | 1.56 | |||
Turnout | 1088 | 54.08 | |||
Labour gain from Conservative | Swing | ||||
Party | Candidate | Votes | % | ± | |
---|---|---|---|---|---|
Conservative | Ian Thomas Wells FLETCHER* | 1233 | 30.73 | ||
Conservative | Veronica Alma FLETCHER* | 1167 | 29.08 | ||
Labour | Robert Hywel SMITH | 614 | 15.30 | ||
Independent | Roy Ernest WILLIAMS | 590 | 14.70 | ||
Labour | Keith Raymond WATKINS | 409 | 10.19 | ||
Majority | 553 | 13.78 | |||
Turnout | 4013 | 48.24 | |||
Conservative hold | Swing | ||||
Party | Candidate | Votes | % | ± | |
---|---|---|---|---|---|
Liberal Democrat | William Leonard TOMLINSON* | 592 | 51.34 | ||
Conservative | Katrina Mary BAKER, | 286 | 24.80 | ||
Labour | Neil Andrew FURY | 275 | 23.85 | ||
Majority | 306 | 26.54 | |||
Turnout | 1153 | 48.17 | |||
Liberal Democrat hold | Swing | ||||
Party | Candidate | Votes | % | ± | |
---|---|---|---|---|---|
Labour | John Charles MINOR* | 1179 | 33.31 | ||
Labour | Richard Andrew OVERTON* | 1145 | 32.35 | ||
Conservative | Frank Ernest TOWNSEND | 695 | 19.64 | ||
Conservative | Shaukat ALI | 520 | 14.69 | ||
Majority | 450 | 12.72 | |||
Turnout | 3539 | 42.62 | |||
Labour hold | Swing | ||||
Party | Candidate | Votes | % | ± | |
---|---|---|---|---|---|
Labour | Nathaniel Aleric Moses ENGLAND | 1223 | 18.04 | ||
Labour | Christopher Robin TURLEY | 1141 | 16.83 | ||
Labour | William Alexander Marsh MCCLEMENTS | 985 | 14.53 | ||
Conservative | Harvey James UNWIN | 836 | 12.33 | ||
Conservative | Richard Michael TYLER* | 808 | 11.92 | ||
Conservative | Sheenagh Mary UNWIN | 750 | 11.06 | ||
UKIP | Raymond John KNIGHT | 414 | 6.11 | ||
UKIP | Judy SMART | 345 | 5.09 | ||
UKIP | Ursula Mary DOBROWOLSKA | 279 | 4.11 | ||
Majority | 149 | 2.20 | |||
Turnout | 6781 | 39.00 | |||
Labour gain from Conservative | Swing | ||||
Labour hold | Swing | ||||
Party | Candidate | Votes | % | ± | |
---|---|---|---|---|---|
Labour | Raemonde Catherine EVANS | 635 | 30.32 | ||
Labour | Kevin Ronald GUY | 564 | 26.93 | ||
Conservative | Christopher Owen Ernest HIGGINS | 377 | 18.00 | ||
Conservative | Grant Nathen Lence FOXON | 373 | 17.81 | ||
BNP | Philip William SPENCER | 145 | 6.92 | ||
Majority | 187 | 8.93 | |||
Turnout | 2094 | 27.20 | |||
Labour hold | Swing | ||||
Party | Candidate | Votes | % | ± | |
---|---|---|---|---|---|
Conservative | Richard Terence KIERNAN | 1424 | 36.56 | ||
Conservative | Jacqueline M SEYMOUR* | 1196 | 30.71 | ||
Labour | Joan Eva GORSE | 502 | 12.89 | ||
Labour | Christopher Lionel LEWIS | 490 | 12.58 | ||
Liberal Democrat | Stephen DE LAUNEY | 283 | 7.27 | ||
Majority | 694 | 17.82 | |||
Turnout | 3895 | 50.12 | |||
Conservative hold | Swing | ||||
Party | Candidate | Votes | % | ± | |
---|---|---|---|---|---|
Labour | Shirley Ann Withers REYNOLDS | 1048 | 26.94 | ||
Labour | Charles Frederick SMITH* | 963 | 24.76 | ||
Conservative | Malcolm Peter ROUND | 629 | 16.17 | ||
Independent | GROOM, Robert Edward* | 538 | 13.83 | ||
Conservative | Sunil VERMA | 384 | 9.87 | ||
Liberal Democrat | Jacqueline Ann BOYLE | 328 | 8.43 | ||
Majority | 334 | 8.59 | |||
Turnout | 3890 | 44.93 | |||
Labour gain from Independent | Swing | ||||
Labour hold | Swing | ||||
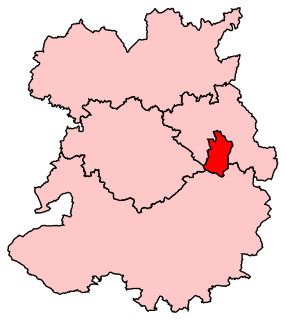
Telford is a constituency represented in the House of Commons of the UK Parliament since May 2015 by Lucy Allan, a Conservative, who defeated David Wright, the former Labour Party MP for the seat.
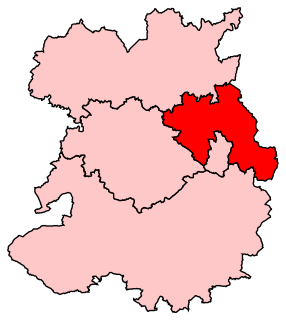
The Wrekin is a constituency in the House of Commons of the British Parliament, located in the county of Shropshire in the West Midlands of England. It has existed continuously since its creation by the Representation of the People Act 1918, and is named after a prominent landmark hill in the area, The Wrekin. The constituency has periodically swung back and forth between the Labour and Conservative parties since the 1920s, and has been held since 2005 by a Conservative MP, Mark Pritchard.
Elections for local government were held in the England and Northern Ireland on 5 May 2005 along with the 2005 general election across the entire United Kingdom. In addition, the Isle of Wight held a local referendum on the issue of a directly elected mayor.
The ceremonial county of Shropshire, England is divided into 5 Parliamentary constituencies – 1 Borough constituency and 4 County constituencies. As per all constituencies for the House of Commons in the modern age, each constituency elects one Member of Parliament by the First Past The Post system.
The 2003 Redditch Borough Council election took place on 1 May 2003 to elect members of Redditch Borough Council in the West Midlands region, England. One third of the council was up for election and the council stayed under no overall control.
Elections to Broxtowe Borough Council were held on 5 May 2011 to elect all 44 members to the Council.
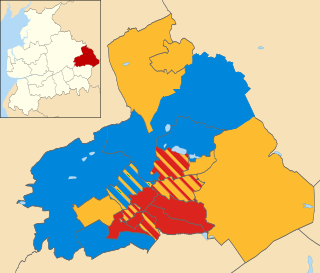
The 2002 Pendle Borough Council election took place on 2 May 2002 to elect members of Pendle Borough Council in Lancashire, England. The whole council was up for election with boundary changes since the last election in 2000 reducing the number of seats by 2. The council stayed under no overall control.
The 2004 Sandwell Metropolitan Borough Council election took place on 10 June 2004 to elect members of Sandwell Metropolitan Borough Council in the West Midlands, England. The whole council was up for election with boundary changes since the last election in 2003. The Labour party stayed in overall control of the council.
The 2007 Sandwell Metropolitan Borough Council election took place on 3 May 2007 to elect members of Sandwell Metropolitan Borough Council in the West Midlands, England. One third of the council was up for election and the Labour party stayed in overall control of the council.
The 2011 Southampton Council election took place on 6 May 2011 to elect members of Southampton Unitary Council in Hampshire, England. One third of the council was up for election. Labour won a majority of the seats being contested and the Conservatives stayed in overall control of the council.
Elections to the Charnwood Borough Council took place on 5 May 2011, in line with other local elections in the United Kingdom. A total of 52 councillors were elected from 28 wards as the whole council was up for election.
Elections to Dover District Council in Kent, England were held on 5 May 2011. The whole council was up for election. The previous election for the District Council was held in May 2007.
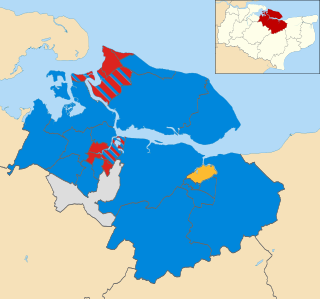
The 2011 Swale Borough Council election took place on 5 May 2011 to elect members of Swale Borough Council in Kent, England. The whole council was up for election and the Conservative party stayed in overall control of the council.
The 2015 Telford and Wrekin Council election took place on 7 May 2015 to elect members of the Telford and Wrekin Council in England. It was held on the same day as other local elections and the UK General Election 2015.
The 2015 Norwich City Council election took place on 7 May 2015 to elect approximately one third of the members of Norwich City Council in England. This was on the same day as other local elections and the UK general election. Thirteen seats were due to be contested, with a further two seats up for election where casual vacancies had arisen. Labour won ten of the available seats, the Green Party won four, and the Liberal Democrats one. The Conservatives gained their highest ever vote in many city wards including Town Close and Thorpe Hamlet, and across Norwich came within almost 2000 votes of the Green Party, however failed to gain any seats. Just one seat changed hands - Wensum - which Labour gained from the Greens. Labour retained overall control of the council with 22 seats out of 39, the Greens continue to form the main opposition with 14 seats, and the Liberal Democrats have 3.
The 2015 Wyre Forest District Council election took place on 7 May 2015 to elect members of Wyre Forest District Council in Worcestershire, England. The whole council was up for election after boundary changes reduced the number of seats by nine. The Conservative party gained overall control of the council from no overall control.
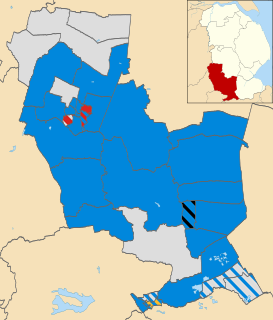
The 2011 South Kesteven District Council election took place on 5 May 2011 to elect members of South Kesteven District Council in Lincolnshire, England. The whole council was up for election and the Conservative party stayed in overall control of the council.
The 2012 West Oxfordshire District Council election took place on 3 May 2012 to elect members of West Oxfordshire District Council in Oxfordshire, England. One third of the council was up for election and the Conservative party stayed in overall control of the council.
The 2016 Exeter City Council election took place on 5 May 2016, to elect members of Exeter City Council in England. Following boundary changes, the entire council was up for election, and all 13 wards were contested, each electing three councillors. The election was held concurrently with other local elections held in England on the 5 May.
The Glasgow City Council election of 2017 was held on 4 May 2017, the same day as the 31 other Scottish local government elections. The election was the first to use 23 new wards, created as a result of the Local Government Boundary Commission for Scotland's 5th Review. Each ward elected three or four councillors using the single transferable vote system, a form of proportional representation used since the 2007 election and according to the Local Governance (Scotland) Act 2004.