Parts of this article (those related to systems from Felicia on not using information from the Tropical Cyclone Reports) need to be updated.(June 2022) |
| Timeline of the 2021 Pacific hurricane season | |||||
|---|---|---|---|---|---|
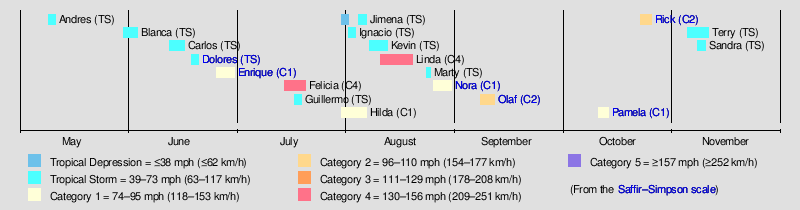
 Season summary map | |||||
| Season boundaries | |||||
| First system formed | May 9, 2021 | ||||
| Last system dissipated | November 10, 2021 | ||||
| Strongest system | |||||
| Name | Felicia | ||||
| Maximum winds | 145 mph (230 km/h) (1-minute sustained) | ||||
| Lowest pressure | 945 mbar (hPa; 27.91 inHg) | ||||
| Longest lasting system | |||||
| Name | Linda | ||||
| Duration | 10 days | ||||
| |||||
The 2021 Pacific hurricane season was a moderately active hurricane season, with above-average tropical activity in terms of named storms, [nb 1] but featured below-average activity in terms of major hurricanes. [nb 2] It is the first season to have at least five systems make landfall in Mexico, the most since 2018. [1] It was also the second consecutive season in which no tropical cyclones formed in the Central Pacific (between 140°W and the International Date Line). The season officially began on May 15 in the Eastern Pacific (east of 140°W longitude), and on June 1 in the Central Pacific; both ended on November 30. These dates historically describe the period each year when most tropical cyclones form in the eastern and central Pacific and are adopted by convention. [2] However, the formation of tropical cyclones is possible at any time of the year, as illustrated this year by the formation of Tropical Storm Andres on May 9. This was the earliest forming tropical storm on record in the Eastern Pacific. [3] The season effectively ended with the dissipation of Tropical Storm Terry, on November 10.
Contents
This timeline documents tropical cyclone formations, strengthening, weakening, landfalls, extratropical transitions, and dissipations during the season. It includes information that was not released throughout the season, meaning that data from post-storm reviews by the National Hurricane Center, such as a storm that was not initially warned upon, has been included.
By convention, meteorologists use one time zone when issuing forecasts and making observations: Coordinated Universal Time (UTC), and also use the 24-hour clock (where 00:00 = midnight UTC). [4] Tropical cyclone advisories in the Eastern North Pacific basin use both UTC and the nautical time zone where the center of the tropical cyclone is currently located. Time zones utilized (east to west) are: Central, Mountain, Pacific and Hawaii. In this timeline, all information is listed by UTC first, with the respective regional time zone included in parentheses. Additionally, figures for maximum sustained winds and position estimates are rounded to the nearest 5 units (knots, miles, or kilometers), following National Hurricane Center practice. Direct wind observations are rounded to the nearest whole number. Atmospheric pressures are listed to the nearest millibar and nearest hundredth of an inch of mercury.