This article does not cite any sources . (March 2009) (Learn how and when to remove this template message) |
Elections to Wolverhampton Metropolitan Borough Council were held on 2 May 1996. One third of the council was up for election and the Labour Party retained overall control of the Council, gaining seven seats at the expense of the Conservative group.
Wolverhampton is a city and metropolitan borough in the West Midlands, England. At the 2011 census, it had a population of 249,470. The demonym for people from the city is 'Wulfrunian'.
Prior to the election, the composition of the council was:
The Labour Party is a centre-left political party in the United Kingdom that has been described as an alliance of social democrats, democratic socialists and trade unionists. The party's platform emphasises greater state intervention, social justice and strengthening workers' rights.
The Conservative Party, officially the Conservative and Unionist Party, is a centre-right political party in the United Kingdom. The governing party since 2010, it is the largest in the House of Commons, with 313 Members of Parliament, and also has 249 members of the House of Lords, 18 members of the European Parliament, 31 Members of the Scottish Parliament, 12 members of the Welsh Assembly, eight members of the London Assembly and 8,916 local councillors.
The Liberal Democrats are a centrist, liberal political party in the United Kingdom. It is currently led by Vince Cable. It has 11 Members of Parliament in the House of Commons, 96 members of the House of Lords, one member of the European Parliament, five Members of the Scottish Parliament and one member in the Welsh Assembly and London Assembly. At the height of its influence, the party served as junior partners in a coalition government with the Conservative Party from 2010 to 2015.
After the election, the composition of the council was:
Party | Seats | Gains | Losses | Net gain/loss | Seats % | Votes % | Votes | +/− | |
---|---|---|---|---|---|---|---|---|---|
Labour | 46 | 7 | 0 | 7 | 76.67 | ||||
Conservative | 12 | 0 | -7 | -6 | 20 | ||||
Liberal Democrat | 2 | 0 | 0 | 0 | 3.33 | ||||
Party | Candidate | Votes | % | ± | |
---|---|---|---|---|---|
Labour | J Collingswood | 1549 | |||
Liberal Democrat | Mrs A E Ramsbottom | 407 | |||
Conservative | E Topliss | 267 | |||
Majority | 1142 | ||||
Labour hold | Swing | ||||
Party | Candidate | Votes | % | ± | |
---|---|---|---|---|---|
Labour | M Stringer | 2026 | |||
Conservative | F Haley | 788 | |||
Liberal Democrat | I Ellis | 282 | |||
Majority | 1238 | ||||
Labour gain from Conservative | Swing | ||||
Party | Candidate | Votes | % | ± | |
---|---|---|---|---|---|
Labour | Robert Jones | 2465 | |||
Conservative | W Sandhu | 645 | |||
Liberal Democrat | R Gray | 238 | |||
Majority | 1820 | ||||
Labour hold | Swing | ||||
Party | Candidate | Votes | % | ± | |
---|---|---|---|---|---|
Labour | K Stelfox | 1592 | |||
Conservative | Charles Brueton | 1464 | |||
Liberal Democrat | C Jenkins | 236 | |||
Majority | 123 | ||||
Labour gain from Conservative | Swing | ||||
Party | Candidate | Votes | % | ± | |
---|---|---|---|---|---|
Labour | Mrs Pat Byrne | 2086 | |||
Conservative | L Berry | 386 | |||
Liberal Democrat | T O'Brien | 158 | |||
Majority | 1700 | ||||
Labour hold | Swing | ||||
Party | Candidate | Votes | % | ± | |
---|---|---|---|---|---|
Labour | A Johnson | 1723 | |||
Conservative | M Hanson | 362 | |||
Liberal Democrat | M Heap | 125 | |||
Majority | 1361 | ||||
Labour hold | Swing | ||||
Party | Candidate | Votes | % | ± | |
---|---|---|---|---|---|
Labour | C Dougherty | 1786 | |||
Conservative | K Hodges | 918 | |||
Liberal | A Bourke | 336 | |||
Majority | 868 | ||||
Labour gain from Conservative | Swing | ||||
Party | Candidate | Votes | % | ± | |
---|---|---|---|---|---|
Labour | L Moore | 2372 | |||
Conservative | N Patten | 1432 | |||
Liberal Democrat | M Millar | 304 | |||
Majority | 940 | ||||
Labour gain from Conservative | Swing | ||||
Party | Candidate | Votes | % | ± | |
---|---|---|---|---|---|
Labour | L Turner | 1394 | |||
Liberal | C Hallmark | 518 | |||
Conservative | G Wright | 314 | |||
Majority | 876 | ||||
Labour hold | Swing | ||||
Party | Candidate | Votes | % | ± | |
---|---|---|---|---|---|
Labour | J McCallum | 1676 | |||
Conservative | P Topliss | 302 | |||
Liberal Democrat | D E Iles | 228 | |||
Majority | 1374 | ||||
Labour hold | Swing | ||||
Party | Candidate | Votes | % | ± | |
---|---|---|---|---|---|
Conservative | Mrs Christine Mills | 1898 | |||
Labour | C Matthews | 1677 | |||
Liberal Democrat | J White | 375 | |||
Majority | 221 | ||||
Conservative hold | Swing | ||||
Party | Candidate | Votes | % | ± | |
---|---|---|---|---|---|
Labour | P Allen | 1820 | |||
Conservative | P O'Connell | 1073 | |||
Liberal Democrat | I Jenkins | 327 | |||
Majority | 747 | ||||
Labour gain from Conservative | Swing | ||||
Party | Candidate | Votes | % | ± | |
---|---|---|---|---|---|
Labour | E Edmondson | 2208 | |||
Conservative | M Griffiths | 1777 | |||
Liberal Democrat | B Lewis | 380 | |||
Majority | 431 | ||||
Labour hold | Swing | ||||
Party | Candidate | Votes | % | ± | |
---|---|---|---|---|---|
Conservative | Alan Hart | 2058 | |||
Labour | A Convery | 1713 | |||
Liberal Democrat | P Beeston | 458 | |||
Majority | 345 | ||||
Conservative hold | Swing | ||||
Party | Candidate | Votes | % | ± | |
---|---|---|---|---|---|
Liberal Democrat | Richard Whitehouse | 2403 | |||
Labour | E Brookes | 1469 | |||
Conservative | C Haynes | 229 | |||
Majority | 934 | ||||
Liberal Democrat hold | Swing | ||||
Party | Candidate | Votes | % | ± | |
---|---|---|---|---|---|
Labour | S Duhra | 2022 | |||
Conservative | T Perkins | 421 | |||
Liberal Democrat | D Murray | 413 | |||
Majority | 1601 | ||||
Labour hold | Swing | ||||
Party | Candidate | Votes | % | ± | |
---|---|---|---|---|---|
Conservative | Mrs Doreen Seiboth | 1672 | |||
Liberal Democrat | L MacLean | 1347 | |||
Labour | J Jaspal | 597 | |||
Majority | 325 | ||||
Conservative hold | Swing | ||||
Party | Candidate | Votes | % | ± | |
---|---|---|---|---|---|
Conservative | A Wynne | 2385 | |||
Labour | S Tracey | 1008 | |||
Liberal Democrat | P Bennett | 361 | |||
Majority | 1377 | ||||
Conservative hold | Swing | ||||
Party | Candidate | Votes | % | ± | |
---|---|---|---|---|---|
Labour | M Stafford-Good | 2015 | |||
Conservative | Andrew Dawson | 955 | |||
Liberal | M Pearson | 432 | |||
Majority | 1060 | ||||
Labour gain from Conservative | Swing | ||||
Party | Candidate | Votes | % | ± | |
---|---|---|---|---|---|
Labour | S Hall | 1822 | |||
Conservative | S Jevon | 939 | |||
Liberal Democrat | J Steatham | 241 | |||
Majority | 883 | ||||
Labour gain from Conservative | Swing | ||||
The 1998 Bolton Metropolitan Borough Council election took place on 7 May 1998 to elect members of Bolton Metropolitan Borough Council in Greater Manchester, England. One third of the council was up for election and the Labour party kept overall control of the council.
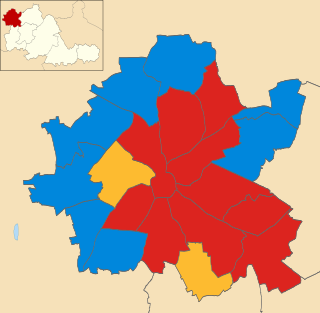
Elections to Wolverhampton City Council were held on 3 May 2007 in Wolverhampton, England. One third of the council was up for election and the Labour Party kept overall control of the council.
Elections to Wolverhampton City Council were held on 3 May 2006 in Wolverhampton, England. One third of the council was up for election and the Labour Party kept overall control of the council.
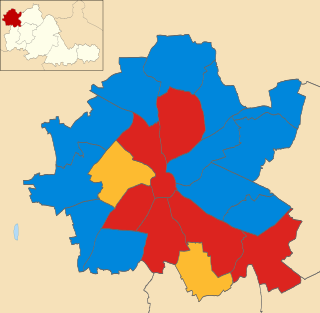
Elections to Wolverhampton City Council were held on 1 May 2008 in Wolverhampton, England. One third of the council was up for election and the Labour group lost overall control after losing eight seats across the City.
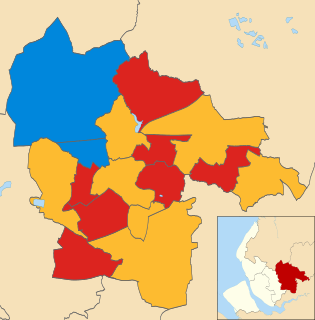
The 2007 St Helens Metropolitan Borough Council election took place on 3 May 2007 to elect members of St Helens Metropolitan Borough Council in Merseyside, England. One third of the council was up for election and the council stayed under no overall control.
Elections to Calderdale Metropolitan Borough Council were held on 1 May 2008. One third of the council was up for election and the council stayed under no overall control with a minority Conservative administration.
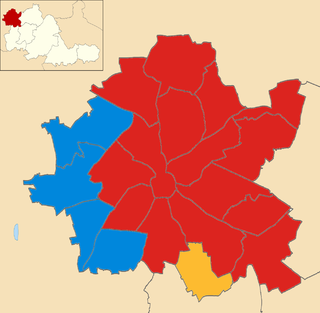
Elections to Wolverhampton City Council was held on 5 May 2011, the same day as the national referendum on the Alternative Vote, in Wolverhampton, England. One third of the council was up for election.
The 2010 Pendle Borough Council election took place on 6 May 2010 to elect members of Pendle Borough Council in Lancashire, England. One third of the council was up for election and the council stayed under no overall control.
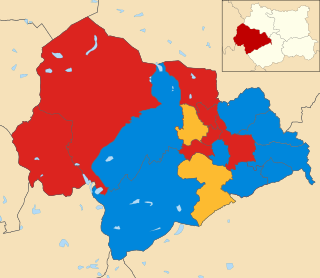
Elections to Calderdale Metropolitan Borough Council took place on Thursday 5 May 2011.
The 2010 Calderdale Metropolitan Borough Council election took place on 6 May 2010 to elect members of Calderdale Metropolitan Borough Council in England. This was on the same day as other local elections and a general election. One councillor was elected in each ward for a four-year term so the councillors elected in 2010 last stood for election in 2006. Each ward is represented by three councillors, the election of which is staggered, so only one third of the councillors was elected in this election. After the election the council stayed in no overall control but the Conservative minority administration was replaced with a coalition between Labour and the Liberal Democrats.
The 2012 Calderdale Metropolitan Borough Council election took place on 3 May 2012 to elect members of Calderdale Metropolitan Borough Council in West Yorkshire, England. This was on the same day as other United Kingdom local elections, 2012. After the election the council continued to have no overall control and continue to be run by a coalition between the Labour Party and the Liberal Democrats.
Elections to Norwich City Council took place on 3 May 2012, the same day as other United Kingdom local elections, 2012. Fifteen out of thirty-nine council seats were up for election and the Labour party gained control of the council from No Overall Control.
The 1996 Bolton Metropolitan Borough Council election took place on 2 May 1996 to elect members of Bolton Metropolitan Borough Council in Greater Manchester, England. One third of the council was up for election and the Labour party kept overall control of the council
The 1995 Bolton Metropolitan Borough Council election took place on 4 May 1995 to elect members of Bolton Metropolitan Borough Council in Greater Manchester, England. One third of the council was up for election and the Labour party kept overall control of the council
The 1990 Bolton Metropolitan Borough Council election took place on 4 May 1990 to elect members of Bolton Metropolitan Borough Council in Greater Manchester, England. One third of the council was up for election and the Labour party kept overall control of the council
The 1992 Bolton Metropolitan Borough Council election took place on 7 May 1992 to elect members of Bolton Metropolitan Borough Council in Greater Manchester, England. One third of the council was up for election and the Labour party kept overall control of the council.
The 1994 Bolton Metropolitan Borough Council election took place on 5 May 1994 to elect members of Bolton Metropolitan Borough Council in Greater Manchester, England. One third of the council was up for election and the Labour party kept overall control of the council.
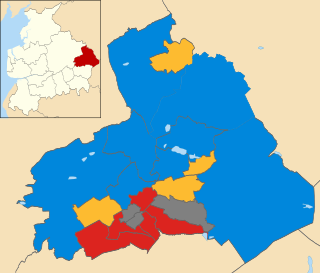
The 2011 Pendle Borough Council election took place on 5 May 2011 to elect members of Pendle Borough Council in Lancashire, England. One third of the council was up for election and the council stayed under no overall control.
The 2018 Bolton Metropolitan Borough Council election took place on 3 May 2018 to elect members of Bolton Council in Greater Manchester, England. This was on the same day as other local elections. The Labour Party retained overall control of the Council with a majority of 1.
The 2019 Bolton Metropolitan Borough Council election took place on 2 May 2019 to elect members of Bolton Council in Greater Manchester, England This was on the same day as other local elections. The Labour Party lost overall control of the Council, for the first time since 2011.