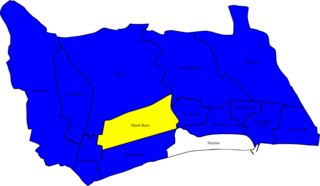
The 1998 Adur District Council election took place on 6 May 1999 to elect members of Adur District Council in West Sussex, England. One third of the council was up for election and the Liberal Democrat party lost overall control of the council to no overall control.
Elections to Adur District Council were held on 4 May 2000. One third of the council was up for election and the council stayed under no overall control. Overall turnout was 36.5%.
Elections to Adur District Council were held on 2 May 2002. One third of the council was up for election and the Conservative party gained control of the council from no overall control. Overall turnout was 33%.

Elections to Adur District Council were held on 10 June 2004. The whole council was up for election with boundary changes since the last election in 2003 reducing the number of seats by 10. The Conservative party held overall control of the council. Overall turnout was 38.0%.

Elections to Adur District Council were held on 4 May 2006. Half of the council was up for election and the Conservative party held overall control of the council.

Elections to Adur District Council in West Sussex, England were held on 1 May 2008. Half of the council was up for election and the Conservative party held overall control of the council.

The 2010 Adur District Council election took place on 6 May 2010 to elect members of Adur District Council in West Sussex, England. Half of the council was up for election and the Conservative party stayed in overall control of the council.

Local elections were held in the United Kingdom on 3 May 1979. The results provided some source of comfort to the Labour Party (UK), who recovered some lost ground from local election reversals in previous years, despite losing the general election to the Conservative Party on the same day.

Local elections were held in the United Kingdom in 1980. These were the first annual local elections for the new Conservative Prime Minister Margaret Thatcher. Though the Conservatives in government lost seats, the projected share of the vote was close: Labour Party 42%, Conservative Party 40%, Liberal Party 13%. Labour were still being led by the former prime minister James Callaghan, who resigned later in the year to be succeeded by Michael Foot.

The 2012 Adur District Council elections took place on 3 May 2012 to elect members of Adur District Council in West Sussex, England. Half of the council was up for election, and the Conservative Party remained in overall control of the council.

The 2016 Adur District Council elections took place on 5 May 2016 to elect members of Adur District Council in West Sussex, England. Half of the council was up for election, and the Conservative Party remained in overall control of the council. The Labour Party trebled their number of seats from one to three.
The first elections to the newly created Adur District Council established by the Local Government Act 1972 in England and Wales were held 7 June 1973. Overall turnout was recorded at 46.6%.
Elections to the Adur District Council were held on 6 May 1976, with the entire council up for election. The two councillors in Marine elected as Residents were defending their seats as Independents. Overall turnout was recorded at 51.8%.

Elections to the Adur District Council were held on 3 May 1979, alongside the general election. The entire council was up for election, following boundary changes that reduced the number of wards by one, but altogether had added an additional two seats. Overall turnout was recorded at 74.4%.

Elections to the Adur District Council were held on 1 May 1980, with one third of the council up for election. There was an additional vacancy in the Southwick Green ward, and no elections for the single-member ward St Marys. Overall turnout dropped to 48.7%.

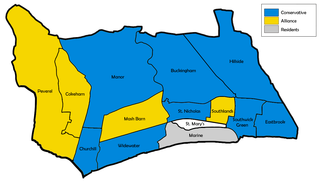
Elections to the Adur District Council were held on 6 May 1982, with one third of the council up for election. There was additional vacancies in the Mash Barn and Peverel wards, but no elections for the single-member ward St Marys and Residents stronghold, Marine, went uncontested. In the intervening years, the newly formed Alliance had gained three seats at the expense of the Conservatives. Overall turnout fell to 42.4%.

Elections to the Adur District Council were held on 5 May 1983, with one third of the council up for election. There was an additional vacancy in the Peverel ward and no elections for the Marine ward. Overall turnout climbed to 47.6%.

Elections to the Adur District Council were held on 3 May 1984, with one third of the council up for election. There was no elections held for the single-member St Mary's ward. Overall turnout was recorded at 45.6%.

Elections to the Adur District Council were held on 8 May 1986, with minor boundary changes taking effect, impacting the Peverel ward. One third of the council was due for re-election, with additional vacancies in Buckingham, Churchill and Mash Barn wards. No elections were to be held for the single-member St Mary's ward. The formerly Conservative councillor for Southwick Green was defending the seat as an Independent, with no Conservative contesting that ward. Overall turnout was down slightly to 45.3%.

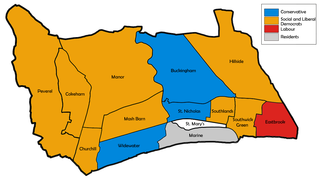
Elections to the Adur District Council were held on 3 May 1990, with one third of the council up for election, as well as vacancies in the Churchill and Manor wards. No elections were held for the single-member St Mary's ward. The sitting Resident councillor in Overall turnout jumped to 49.8%.


