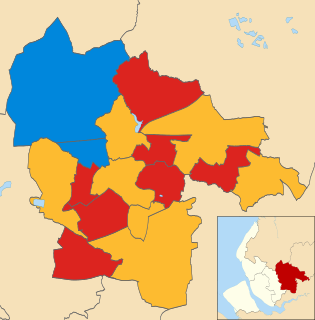
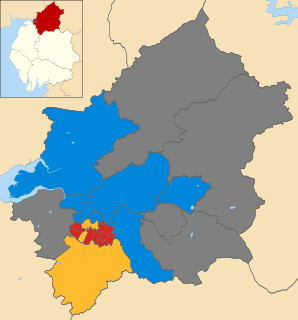
The 2012 Carlisle City Council election took place on 3 May 2012 to elect members of Carlisle District Council in Cumbria, England. One third of the council was up for election and the Labour party gained overall control of the council from no overall control. [1]
The City of Carlisle is a local government district of Cumbria, England, with the status of a city and non-metropolitan district. It is named after its largest settlement, Carlisle, but covers a far larger area which includes the towns of Brampton and Longtown, as well as outlying villages including Dalston, Scotby and Wetheral. The city has a population of 107,524. and an area of 1,039.97 square kilometres (402 sq mi), making it the largest city in England by area.
Non-metropolitan districts, or colloquially "shire districts", are a type of local government district in England. As created, they are sub-divisions of non-metropolitan counties in a two-tier arrangement.
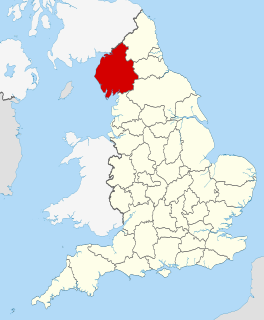
Cumbria is a ceremonial and non-metropolitan county in North West England. The county and Cumbria County Council, its local government, came into existence in 1974 after the passage of the Local Government Act 1972. Cumbria's county town is Carlisle, in the north of the county, and the only other major urban area is Barrow-in-Furness on the southwestern tip of the county.
After the election, the composition of the council was
The Labour Party is a centre-left political party in the United Kingdom which has been described as an alliance of social democrats, democratic socialists and trade unionists. The party's platform emphasises greater state intervention, social justice and strengthening workers' rights.
The Conservative Party, officially the Conservative and Unionist Party, is a centre-right political party in the United Kingdom. Presently led by Theresa May, it has been the governing party since 2010. It presently has 314 Members of Parliament in the House of Commons, 249 members of the House of Lords, and 18 members of the European Parliament. It also has 31 Members of the Scottish Parliament, 12 members of the Welsh Assembly, eight members of the London Assembly and 9,008 local councillors. One of the major parties of UK politics, it has formed the government on 45 occasions, more than any other party.
The Liberal Democrats are a liberal political party in the United Kingdom. They presently have 11 Members of Parliament in the House of Commons, 96 members of the House of Lords, and one member of the European Parliament. They also have five Members of the Scottish Parliament and a member each in the Welsh Assembly and London Assembly. The party reached the height of its influence in the early 2010s, forming a junior partner in a coalition government from 2010 to 2015. It is presently led by Vince Cable.
After the last election in 2011 Labour were the largest party with 24 seats, while the Conservatives had 22, the Liberal Democrats had 4 and there were 2 independents. [3] However the Conservatives continued to lead the council with Liberal Democrat support, [3] meaning that before the 2012 election Labour needed to make 2 gains to take control of the council. [4] One seat was vacant at the 2012 election in Harraby after the death of Labour councillor Dave Weedall in April 2012. [5]
A Councillor is a member of a local government council.
17 seats were contested in 2012 and as well as Conservative and Labour candidates, there were also 11 candidates each from the UK Independence Party and the Green Party, 8 candidates from the Liberal Democrats, 2 independents and 1 candidate each from the Trade Unionist and Socialist Coalition and the British National Party. [4] [6] The election in Carlisle brought national politicians to support their parties, with both the Conservative Prime Minister David Cameron and the Labour Leader of the Opposition Ed Miliband visiting Carlisle during the campaign. [7]
The UK Independence Party is a hard Eurosceptic, right-wing political party in the United Kingdom. It currently has one representative in the House of Lords and seven Members of the European Parliament (MEPs). It has four Assembly Members (AMs) in the National Assembly for Wales and one member in the London Assembly. The party reached its greatest level of success in the mid-2010s, when it gained two Members of Parliament and was the largest UK party in the European Parliament.
The Green Party of England and Wales is a green, left-wing political party in England and Wales. Headquartered in London, since September 2018, its co-leaders are Siân Berry and Jonathan Bartley. The Green Party has one representative in the House of Commons, one in the House of Lords, and three in the European Parliament. In addition, it has various councillors in UK local government and two members of the London Assembly.
Trade Unionist and Socialist Coalition (TUSC) is a socialist electoral alliance launched in Britain for the 2010 general election.
Labour became the first party to have a majority on Carlisle City Council since 2003, after taking 2 seats each from the Conservatives and Liberal Democrats. [8] This took Labour to 27 of the 52 seats on the council, while the Conservatives dropped to 20 councillors and the Liberal Democrats fell to 2 seats. [8] There remained 2 independents and a further seat was vacant. [8] Overall turnout at the election was 33.9%. [5]
Voter turnout is the percentage of eligible voters who cast a ballot in an election. Eligibility varies by country, and the voting-eligible population should not be confused with the total adult population. Age and citizenship status are often among the criteria used to determine eligibility, but some countries further restrict eligibility based on sex, race, or religion.
The Labour gains from the Conservatives came in Belle Vue and Yewdale wards, with Labour across the seats contested winning 4,530 more votes than Conservatives. [5] Meanwhile, the Liberal Democrats only held one seat in Dalston, where sitting councillor Trevor Allison was re-elected, after losing two seats in Castle and Morton to Labour. [5]
Belle Vue is a suburb of Carlisle, Cumbria, United Kingdom. The ward population taken at the 2011 census was 6,491.
The wards and electoral divisions in the United Kingdom are electoral districts at sub-national level represented by one or more councillors. The ward is the primary unit of English electoral geography for civil parishes and borough and district councils, electoral ward is the unit used by Welsh principal councils, while the electoral division is the unit used by English county councils and some unitary authorities. Each ward/division has an average electorate of about 5,500 people, but ward-population counts can vary substantially. As at the end of 2014 there were 9,456 electoral wards/divisions in the UK.
Dalston is a large village and civil parish within the Carlisle district of Cumbria, England. It is situated on the B5299 road about four miles (6 km) south-south-west of Carlisle city centre, and approximately five miles (8 km) from Junction 42 of the M6 motorway.
Following the election the Labour group leader Joe Hendry became the new leader of Carlisle City Council, while John Mallinson became leader of the Conservative group on the council, after defeating the Conservative leader of the council from 1999 to 2012, Mike Mitchelson, in a leadership election. [9]
Party | Seats | Gains | Losses | Net gain/loss | Seats % | Votes % | Votes | +/− | |
---|---|---|---|---|---|---|---|---|---|
Labour | 10 | 4 | 0 | +4 | 58.8 | 47.3 | 11,582 | +4.0% | |
Conservative | 5 | 0 | 2 | -2 | 29.4 | 28.8 | 7,052 | -9.1% | |
Liberal Democrat | 1 | 0 | 2 | -2 | 5.9 | 7.4 | 1,811 | +1.4% | |
Independent | 1 | 0 | 0 | 0 | 5.9 | 3.9 | 953 | -0.6% | |
UKIP | 0 | 0 | 0 | 0 | 0 | 6.9 | 1,692 | +4.9% | |
Green | 0 | 0 | 0 | 0 | 0 | 5.0 | 1,213 | +1.2% | |
TUSC | 0 | 0 | 0 | 0 | 0 | 0.4 | 97 | -0.8% | |
BNP | 0 | 0 | 0 | 0 | 0 | 0.4 | 88 | -0.7% |
Party | Candidate | Votes | % | ± | |
---|---|---|---|---|---|
Conservative | David Morton | 805 | 42.6 | -6.6 | |
Labour | Kevin Parker | 759 | 40.1 | +8.5 | |
UKIP | Andrew Hill | 247 | 13.1 | +13.1 | |
Green | Ian Brewis | 80 | 4.2 | +4.2 | |
Majority | 46 | 2.4 | -15.2 | ||
Turnout | 1,891 | 38.4 | -3.8 | ||
Conservative hold | Swing |
Party | Candidate | Votes | % | ± | |
---|---|---|---|---|---|
Labour | Leslie Tickner | 909 | 57.7 | +2.3 | |
Conservative | Michael Clarke | 537 | 34.1 | -10.5 | |
Green | Richard Hunt | 80 | 5.1 | +5.1 | |
Liberal Democrat | Terence Jones | 49 | 3.1 | +3.1 | |
Majority | 372 | 23.6 | +12.8 | ||
Turnout | 1,575 | 31.8 | -2.4 | ||
Labour gain from Conservative | Swing | ||||
Party | Candidate | Votes | % | ± | |
---|---|---|---|---|---|
Labour | Michael Boaden | 693 | 54.3 | +4.3 | |
Independent | Michael Middlemore | 311 | 24.4 | -5.6 | |
Conservative | Shaidat Danmole-Ellis | 141 | 11.1 | -8.8 | |
UKIP | Robert Strong | 107 | 8.4 | +8.4 | |
Green | Lynn Bates | 24 | 1.9 | +1.9 | |
Majority | 382 | 29.9 | +9.9 | ||
Turnout | 1,276 | 27.1 | -3.4 | ||
Labour hold | Swing |
Party | Candidate | Votes | % | ± | |
---|---|---|---|---|---|
Conservative | Stephen Layden | 600 | 51.1 | -3.4 | |
Labour | Graham Bartlett | 404 | 34.4 | +11.9 | |
UKIP | Christian Forster | 171 | 14.6 | +14.6 | |
Majority | 196 | 16.7 | -14.8 | ||
Turnout | 1,175 | 32.9 | -32.7 | ||
Conservative hold | Swing |
Party | Candidate | Votes | % | ± | |
---|---|---|---|---|---|
Labour | Elsie Martlew | 663 | 56.8 | +14.4 | |
Liberal Democrat | Ian Walker | 229 | 19.6 | -14.2 | |
Conservative | Kevin Reynolds | 165 | 14.1 | +14.1 | |
Green | Neil Boothman | 110 | 9.4 | -1.0 | |
Majority | 434 | 37.2 | +28.6 | ||
Turnout | 1,167 | 26.0 | -3.3 | ||
Labour gain from Liberal Democrat | Swing | ||||
Party | Candidate | Votes | % | ± | |
---|---|---|---|---|---|
Labour | Colin Glover | 850 | 69.7 | +12.6 | |
Conservative | Stephen Higgs | 185 | 15.2 | -7.2 | |
TUSC | Brent Kennedy | 97 | 8.0 | +0.8 | |
BNP | Stephen Bingham | 88 | 7.2 | -1.3 | |
Majority | 665 | 54.5 | +19.8 | ||
Turnout | 1,220 | 26.7 | -4.5 | ||
Labour hold | Swing |
Party | Candidate | Votes | % | ± | |
---|---|---|---|---|---|
Liberal Democrat | Trevor Allison | 1,033 | 51.8 | +29.6 | |
Conservative | Michael Randall | 481 | 24.1 | -25.0 | |
Labour | Sandra Warwick | 305 | 15.3 | -5.9 | |
UKIP | Robert Dickinson | 174 | 8.7 | +1.2 | |
Majority | 552 | 27.7 | |||
Turnout | 1,993 | 41.6 | -5.6 | ||
Liberal Democrat hold | Swing |
Party | Candidate | Votes | % | ± | |
---|---|---|---|---|---|
Labour | Joan Southward | 848 | 62.7 | +4.8 | |
Conservative | Barbara Eden | 229 | 16.9 | -4.2 | |
Green | James Tucker | 120 | 8.9 | +4.1 | |
UKIP | John Warmingham | 107 | 7.9 | +1.5 | |
Liberal Democrat | David Wood | 49 | 3.6 | -2.5 | |
Majority | 619 | 45.8 | +9.0 | ||
Turnout | 1,353 | 27.8 | -4.6 | ||
Labour hold | Swing |
Party | Candidate | Votes | % | ± | |
---|---|---|---|---|---|
Conservative | Doreen Parsons | 402 | 60.6 | -10.1 | |
Labour | Elizabeth Furneaux | 261 | 39.4 | +10.1 | |
Majority | 141 | 21.3 | -20.1 | ||
Turnout | 663 | 37.7 | -1.3 | ||
Conservative hold | Swing |
Party | Candidate | Votes | % | ± | |
---|---|---|---|---|---|
Labour | Lee Sherriff | 961 | 63.6 | -3.2 | |
Conservative | Hannah Dolan | 299 | 19.8 | -13.4 | |
UKIP | Edward Haughan | 130 | 8.6 | +8.6 | |
Green | Dallas Brewis | 61 | 4.0 | +4.0 | |
Liberal Democrat | Michael Gee | 60 | 4.0 | +4.0 | |
Majority | 662 | 43.8 | +10.1 | ||
Turnout | 1,511 | 29.9 | -3.0 | ||
Labour hold | Swing |
Party | Candidate | Votes | % | ± | |
---|---|---|---|---|---|
Independent | William Graham | 642 | 75.8 | +1.6 | |
Conservative | Harry Cain | 167 | 19.7 | -6.1 | |
UKIP | Michael Owen | 38 | 4.5 | +4.5 | |
Majority | 475 | 56.1 | +7.6 | ||
Turnout | 847 | 50.7 | -3.8 | ||
Independent hold | Swing |
Party | Candidate | Votes | % | ± | |
---|---|---|---|---|---|
Labour | Elaine Stevenson | 1,167 | 65.7 | +6.2 | |
Liberal Democrat | Peter Noble | 201 | 11.3 | -0.5 | |
UKIP | Arnold Blythe | 189 | 10.6 | +10.6 | |
Conservative | Lawrence Fisher | 175 | 9.9 | -8.3 | |
Green | Gillian Curwen | 44 | 2.5 | -0.3 | |
Majority | 966 | 54.4 | +13.0 | ||
Turnout | 1,776 | 36.9 | -2.4 | ||
Labour gain from Liberal Democrat | Swing | ||||
Party | Candidate | Votes | % | ± | |
---|---|---|---|---|---|
Labour | Lucy Patrick | 669 | 50.8 | +7.5 | |
Green | John Reardon | 276 | 21.0 | -1.6 | |
Conservative | Christine Finlayson | 256 | 19.5 | -9.5 | |
UKIP | Robert Cakans | 115 | 8.7 | +8.7 | |
Majority | 393 | 29.9 | +15.6 | ||
Turnout | 1,316 | 27.7 | -6.8 | ||
Labour hold | Swing |
Party | Candidate | Votes | % | ± | |
---|---|---|---|---|---|
Conservative | Paul Nedved | 854 | 42.7 | -7.3 | |
Labour | Grant Warwick | 710 | 35.5 | -5.5 | |
Green | Helen Davison | 228 | 11.4 | +2.4 | |
UKIP | Carol Weaver | 207 | 10.4 | +10.4 | |
Majority | 144 | 7.2 | -1.8 | ||
Turnout | 1,999 | 41.9 | -6.3 | ||
Conservative hold | Swing |
Party | Candidate | Votes | % | ± | |
---|---|---|---|---|---|
Labour | Donald Cape | 843 | 72.8 | +16.8 | |
Conservative | Judith Pattinson | 182 | 15.7 | -3.7 | |
Liberal Democrat | James Osler | 133 | 11.5 | -6.1 | |
Majority | 661 | 57.1 | +20.4 | ||
Turnout | 1,158 | 28.6 | -3.9 | ||
Labour hold | Swing |
Party | Candidate | Votes | % | ± | |
---|---|---|---|---|---|
Conservative | Barry Earp | 844 | 56.1 | -4.6 | |
Labour | Roger Horne | 318 | 21.1 | -6.8 | |
UKIP | Geoffrey Round | 207 | 13.8 | +2.3 | |
Green | Michael Brader | 135 | 9.0 | +9.0 | |
Majority | 526 | 35.0 | +2.2 | ||
Turnout | 1,504 | 39.8 | -35.7 | ||
Conservative hold | Swing |
Party | Candidate | Votes | % | ± | |
---|---|---|---|---|---|
Labour | Karen Gallagher | 1,222 | 59.2 | -0.5 | |
Conservative | Fiona Robson | 730 | 35.4 | -4.9 | |
Liberal Democrat | Deborah Clode | 57 | 2.8 | +2.8 | |
Green | Hazel Graham | 55 | 2.7 | +2.7 | |
Majority | 492 | 23.8 | +4.3 | ||
Turnout | 2,064 | 42.7 | -0.8 | ||
Labour gain from Conservative | Swing | ||||
A by-election was held in Harraby on 21 June 2012 after the death of the longest serving councillor, Labour's Dave Weedall. [12] The seat was held for Labour by Donald Forrester with a majority of 457 votes over Conservative Keith Mellen. [13]
Party | Candidate | Votes | % | ± | |
---|---|---|---|---|---|
Labour | Donald Forrester | 637 | 63.1 | -0.5 | |
Conservative | Keith Mellen | 180 | 17.8 | -2.0 | |
UKIP | Eddie Haughan | 90 | 8.9 | +0.3 | |
Liberal Democrat | Michael Gee | 71 | 7.0 | +3.0 | |
Green | James Tucker | 31 | 3.1 | -0.9 | |
Majority | 457 | 45.3 | +1.5 | ||
Turnout | 1,009 | 19.9 | -10.0 | ||
Labour hold | Swing |
A by-election was held in Yewdale on 5 September 2013 after the death of the former leader of the council, Labour's Joe Hendry. [14] The seat was held for Labour by Tom Dodd with a majority of 263 votes over Conservative Christina Finlayson. [14]
Party | Candidate | Votes | % | ± | |
---|---|---|---|---|---|
Labour | Tom Dodd | 716 | 48.7 | -10.5 | |
Conservative | Christina Finlayson | 453 | 30.8 | -4.6 | |
UKIP | Mike Owen | 257 | 17.5 | +17.5 | |
Liberal Democrat | Terry Jones | 31 | 2.1 | -0.7 | |
Green | Charmain McCutcheon | 14 | 1.0 | -1.7 | |
Majority | 263 | 17.9 | -5.9 | ||
Turnout | 1,471 | 30.2 | -12.5 | ||
Labour hold | Swing |
A by-election was held in Dalston on 17 October 2013 after Conservative councillor Nicola Clarke resigned from the council as she was moving away from the area. [15] The seat was gained for the Liberal Democrats by Michael Gee with a majority of 30 votes over Conservative Michael Randall. [15]
Party | Candidate | Votes | % | ± | |
---|---|---|---|---|---|
Liberal Democrat | Michael Gee | 506 | 37.2 | -14.6 | |
Conservative | Michael Randall | 476 | 34.9 | +10.8 | |
Labour | Ruth Alcroft | 186 | 13.7 | -1.6 | |
UKIP | Robert Dickinson | 167 | 12.3 | +3.6 | |
Green | James Tucker | 27 | 2.0 | +2.0 | |
Majority | 30 | 2.2 | -25.5 | ||
Turnout | 1,362 | 28.3 | -13.3 | ||
Liberal Democrat gain from Conservative | Swing | ||||
The 2008 St Helens Metropolitan Borough Council election took place on 1 May 2008 to elect members of St Helens Metropolitan Borough Council in Merseyside, England. One third of the council was up for election and the council stayed under no overall control.
The 2008 Harlow District Council election took place on 1 May 2008 to elect members of Harlow District Council in Essex, England. One third of the council was up for election and the Conservative party gained overall control of the council from no overall control.
The 2007 St Helens Metropolitan Borough Council election took place on 3 May 2007 to elect members of St Helens Metropolitan Borough Council in Merseyside, England. One third of the council was up for election and the council stayed under no overall control.
The 2004 Carlisle City Council election took place on 10 June 2004 to elect members of Carlisle District Council in Cumbria, England. One third of the council was up for election and the council stayed under no overall control.
The 2006 Carlisle City Council election took place on 4 May 2006 to elect members of Carlisle District Council in Cumbria, England. One third of the council was up for election and the council stayed under no overall control.
The 2007 Carlisle City Council election took place on 3 May 2007 to elect members of Carlisle District Council in Cumbria, England. One third of the council was up for election and the council stayed under no overall control.
The 2008 Carlisle City Council election took place on 1 May 2008 to elect members of Carlisle District Council in Cumbria, England. One third of the council was up for election and the council stayed under no overall control.
The 2010 Carlisle City Council election took place on 6 May 2010 to elect members of Carlisle District Council in Cumbria, England. One third of the council was up for election and the council stayed under no overall control.
The 2011 Carlisle City Council election took place on 5 May 2011 to elect members of Carlisle District Council in Cumbria, England. One third of the council was up for election and the council stayed under no overall control.
The 2011 Wealden District Council election took place on 5 May 2011 to elect members of Wealden District Council in East Sussex, England. The whole council was up for election and the Conservative party stayed in overall control of the council.
The 2012 St Albans City and District Council election took place on 3 May 2012 to elect members of St Albans District Council in Hertfordshire, England. One third of the council was up for election and the council stayed under no overall control.
The 2012 Pendle Borough Council election took place on 3 May 2012 to elect members of Pendle Borough Council in Lancashire, England. One third of the council was up for election and the council stayed under no overall control.
The 2014 Brent London Borough Council election took place on 22 May 2014 to elect members of Brent London Borough Council in London, England. The whole council was up for election and the Labour Party stayed in overall control of the council.
The 2012 St Helens Metropolitan Borough Council election took place on 3 May 2012 to elect members of St Helens Metropolitan Borough Council in Merseyside, England. One third of the council was up for election and the Labour party stayed in overall control of the council.
The 2014 St Helens Metropolitan Borough Council election took place on 22 May 2014 to elect members of St Helens Metropolitan Borough Council in Merseyside, England. One third of the council was up for election and the Labour party stayed in overall control of the council.
The 2014 Carlisle City Council election took place on 22 May 2014 to elect members of Carlisle District Council in Cumbria, England. One third of the council was up for election and the Labour party stayed in overall control of the council.
The 2003 South Kesteven District Council election took place on 1 May 2003 to elect members of South Kesteven District Council in Lincolnshire, England. The whole council was up for election and the Conservative party gained control of the council from no overall control.
The 2012 West Oxfordshire District Council election took place on 3 May 2012 to elect members of West Oxfordshire District Council in Oxfordshire, England. One third of the council was up for election and the Conservative party stayed in overall control of the council.
Elections to City of York Council will be held on 2 May 2019, as part of the United Kingdom local elections in 2019. In 2015, the City of York Council election saw heavy losses for the then-ruling Labour Party, losing more than 40% of the 26 seats won at the previous election in 2011. The Conservatives, Liberal Democrats and Greens all made gains and two Independent councillors were also elected. Following talks between the political groups after the election, the Conservatives and Liberal Democrats agreed to run the Council as a joint administration.