Dehcho Region | |
---|---|
Country | Canada |
Territory | Northwest Territories |
Federal riding | Northwest Territories |
Territorial riding | Nahendeh |
Regional office [1] | Fort Simpson |
Area | |
• Total | 194,494 km2 (75,094.5 sq mi) |
Population (2021) [2] | |
• Total | 1,926 |
• Rank | 5th NWT |
• Density | 0.0099/km2 (0.026/sq mi) |
• % change (from 2016) | −7.6 |
Time zone | UTC−07:00 (MST) |
• Summer (DST) | UTC−06:00 (DST) |
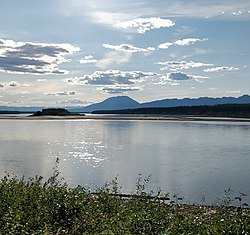
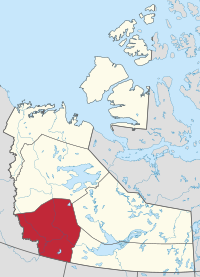
The Dehcho Region[ pronunciation? ] or Deh Cho is one of five administrative regions in the Northwest Territories of Canada. According to Municipal and Community Affairs the region consists of six communities with the regional office situated in Fort Simpson. [1] All communities in the Dehcho are predominantly Dehcho First Nations. [3] [4]
The Dehcho Region includes the following communities:
Community | Demographics (2021) | ||||||||
---|---|---|---|---|---|---|---|---|---|
Name [5] | Governance | Census [2] | Indigenous population profile [6] | ||||||
Official | Traditional | Type [7] | Municipality [8] | Total | Change (from 2016) | First Nations | Métis | Inuit | Other |
Fort Liard | Echaot'ı̨e Kų́ę́ | Hamlet | Yes | 468 | -6.4% | 370 | 10 | 10 [a] | 90 |
Fort Simpson | Łı́ı́dlı̨ Kų́ę́ | Village | Yes | 1,100 | -8.5% | 670 | 85 | 30 [b] | 390 |
Jean Marie River | Tthek'éhdélı̨ | Designated authority | No | 63 | -18.2% | 55 | 0 | 0 | 10 |
Nahanni Butte | Tthenáágó | Designated authority | No | 81 | -6.9% | 80 | 0 | 0 | 0 |
Sambaa K'e | Designated authority | No | 97 | 10.2% | 85 | 0 | 0 | 10 | |
Wrigley | Pedzéh Kı̨́ | Designated authority | No | 117 | -1.7% | 115 | 0 | 0 | 10 |
|
| |||||||||||||||||||||||||||||||||||||||||||||||||||||||||||||||
Sources: NWT Bureau of Statistics (2001 - 2017) [9] |
Climate data for Fort Liard (Fort Liard Airport) Climate ID: 2201575; coordinates 60°14′06″N123°28′01″W / 60.23500°N 123.46694°W ; elevation: 215.8 m (708 ft); 1991-2020 normals, extremes 1973–present [c] | |||||||||||||
---|---|---|---|---|---|---|---|---|---|---|---|---|---|
Month | Jan | Feb | Mar | Apr | May | Jun | Jul | Aug | Sep | Oct | Nov | Dec | Year |
Record high humidex | 14.7 | 14.1 | 19.8 | 22.9 | 31.7 | 35.5 | 42.6 | 38.7 | 32.1 | 26.6 | 13.3 | 14.3 | 42.6 |
Record high °C (°F) | 14.8 (58.6) | 15.0 (59.0) | 19.9 (67.8) | 25.0 (77.0) | 32.6 (90.7) | 35.2 (95.4) | 35.2 (95.4) | 34.9 (94.8) | 30.5 (86.9) | 26.5 (79.7) | 13.5 (56.3) | 15.3 (59.5) | 35.2 (95.4) |
Mean daily maximum °C (°F) | −16.7 (1.9) | −10.1 (13.8) | −2.4 (27.7) | 8.8 (47.8) | 17.4 (63.3) | 22.0 (71.6) | 23.7 (74.7) | 21.6 (70.9) | 15.3 (59.5) | 4.8 (40.6) | −8.8 (16.2) | −15.4 (4.3) | 5.0 (41.0) |
Daily mean °C (°F) | −20.8 (−5.4) | −15.7 (3.7) | −9.4 (15.1) | 2.0 (35.6) | 10.3 (50.5) | 15.4 (59.7) | 17.6 (63.7) | 15.5 (59.9) | 9.6 (49.3) | 0.7 (33.3) | −12.5 (9.5) | −19.3 (−2.7) | −0.6 (30.9) |
Mean daily minimum °C (°F) | −24.9 (−12.8) | −21.3 (−6.3) | −16.3 (2.7) | −4.7 (23.5) | 3.2 (37.8) | 8.8 (47.8) | 11.4 (52.5) | 9.4 (48.9) | 3.9 (39.0) | −3.4 (25.9) | −16.3 (2.7) | −23.1 (−9.6) | −6.1 (21.0) |
Record low °C (°F) | −46.7 (−52.1) | −44.0 (−47.2) | −38.3 (−36.9) | −30.5 (−22.9) | −14.5 (5.9) | −1.6 (29.1) | −0.1 (31.8) | −1.7 (28.9) | −11.7 (10.9) | −30.0 (−22.0) | −43.0 (−45.4) | −45.0 (−49.0) | −46.7 (−52.1) |
Record low wind chill | −61.6 | −51.9 | −46.6 | −34.3 | −22.3 | −3.9 | 0.0 | 0.0 | −10.7 | −32.4 | −50.9 | −53.2 | −61.6 |
Average precipitation mm (inches) | 27.0 (1.06) | 19.3 (0.76) | 15.2 (0.60) | 15.9 (0.63) | 39.5 (1.56) | 71.3 (2.81) | 82.2 (3.24) | 54.0 (2.13) | 43.4 (1.71) | 27.4 (1.08) | 31.0 (1.22) | 22.9 (0.90) | 449.2 (17.69) |
Average rainfall mm (inches) | 0.0 (0.0) | 0.0 (0.0) | 0.1 (0.00) | 3.3 (0.13) | 37.2 (1.46) | 61.1 (2.41) | 88.0 (3.46) | 50.5 (1.99) | 45.4 (1.79) | 10.8 (0.43) | 0.1 (0.00) | 0.0 (0.0) | 296.4 (11.67) |
Average snowfall cm (inches) | 30.5 (12.0) | 22.8 (9.0) | 17.0 (6.7) | 12.2 (4.8) | 1.9 (0.7) | 0.0 (0.0) | 0.0 (0.0) | 0.0 (0.0) | 2.0 (0.8) | 16.8 (6.6) | 35.4 (13.9) | 26.7 (10.5) | 165.3 (65.1) |
Average precipitation days (≥ 0.2 mm) | 9.2 | 7.7 | 7.0 | 4.9 | 9.8 | 10.7 | 12.3 | 12.2 | 10.9 | 8.6 | 10.1 | 8.1 | 111.3 |
Average rainy days (≥ 0.2 mm) | 0.0 | 0.0 | 0.1 | 1.8 | 8.9 | 9.7 | 11.5 | 10.8 | 10.8 | 3.9 | 0.1 | 0.0 | 57.4 |
Average snowy days (≥ 0.2 cm) | 9.0 | 7.4 | 7.5 | 3.2 | 1.0 | 0.0 | 0.0 | 0.0 | 0.8 | 5.4 | 10.1 | 7.4 | 51.8 |
Average relative humidity (%) (at 1500 LST) | 70.9 | 62.9 | 49.6 | 40.7 | 37.4 | 46.7 | 49.8 | 51.3 | 53.0 | 66.4 | 74.9 | 74.8 | 56.6 |
Source: Environment and Climate Change Canada [10] (June maximum) [11] (August maximum) [12] |
Climate data for Fort Simpson (Fort Simpson Airport) WMO ID: 71946; coordinates 61°45′37″N121°14′12″W / 61.76028°N 121.23667°W ; elevation: 169.2 m (555 ft); 1991–2020 normals, extremes 1895–present [d] | |||||||||||||
---|---|---|---|---|---|---|---|---|---|---|---|---|---|
Month | Jan | Feb | Mar | Apr | May | Jun | Jul | Aug | Sep | Oct | Nov | Dec | Year |
Record high humidex | 12.0 | 13.9 | 16.5 | 26.4 | 31.8 | 35.8 | 41.3 | 39.7 | 32.2 | 24.0 | 11.3 | 14.0 | 41.3 |
Record high °C (°F) | 13.2 (55.8) | 15.6 (60.1) | 17.2 (63.0) | 25.5 (77.9) | 32.8 (91.0) | 35.0 (95.0) | 36.6 (97.9) | 35.4 (95.7) | 30.9 (87.6) | 30.6 (87.1) | 13.3 (55.9) | 14.5 (58.1) | 36.6 (97.9) |
Mean daily maximum °C (°F) | −19.3 (−2.7) | −14.2 (6.4) | −6.0 (21.2) | 5.7 (42.3) | 15.9 (60.6) | 21.9 (71.4) | 23.8 (74.8) | 21.1 (70.0) | 14.1 (57.4) | 2.4 (36.3) | −10.6 (12.9) | −17.5 (0.5) | 3.1 (37.6) |
Daily mean °C (°F) | −23.6 (−10.5) | −19.5 (−3.1) | −12.5 (9.5) | −0.5 (31.1) | 9.3 (48.7) | 15.6 (60.1) | 17.7 (63.9) | 15.1 (59.2) | 8.5 (47.3) | −1.4 (29.5) | −14.5 (5.9) | −21.6 (−6.9) | −2.3 (27.9) |
Mean daily minimum °C (°F) | −27.8 (−18.0) | −24.7 (−12.5) | −19.1 (−2.4) | −6.7 (19.9) | 2.8 (37.0) | 9.2 (48.6) | 11.5 (52.7) | 9.0 (48.2) | 2.9 (37.2) | −5.1 (22.8) | −18.4 (−1.1) | −25.7 (−14.3) | −7.7 (18.1) |
Record low °C (°F) | −54.4 (−65.9) | −56.2 (−69.2) | −46.7 (−52.1) | −39.4 (−38.9) | −22.8 (−9.0) | −2.2 (28.0) | −1.1 (30.0) | −6.1 (21.0) | −20.6 (−5.1) | −27.8 (−18.0) | −46.1 (−51.0) | −53.3 (−63.9) | −53.3 (−63.9) |
Record low wind chill | −58.9 | −54.8 | −48.5 | −44.3 | −24.7 | −5.9 | −2.7 | −4.9 | −23.7 | −35.5 | −53.2 | −59.6 | −59.6 |
Average precipitation mm (inches) | 18.1 (0.71) | 16.2 (0.64) | 14.8 (0.58) | 15.5 (0.61) | 30.3 (1.19) | 55.8 (2.20) | 56.5 (2.22) | 59.5 (2.34) | 32.4 (1.28) | 31.9 (1.26) | 22.3 (0.88) | 17.4 (0.69) | 370.5 (14.59) |
Average rainfall mm (inches) | 0.1 (0.00) | 0.1 (0.00) | 0.2 (0.01) | 1.5 (0.06) | 23.8 (0.94) | 57.2 (2.25) | 59.2 (2.33) | 64.5 (2.54) | 31.3 (1.23) | 12.1 (0.48) | 0.2 (0.01) | 0.0 (0.0) | 249.9 (9.84) |
Average snowfall cm (inches) | 30.9 (12.2) | 25.6 (10.1) | 20.0 (7.9) | 17.8 (7.0) | 8.1 (3.2) | 0.6 (0.2) | 0.0 (0.0) | 0.0 (0.0) | 3.9 (1.5) | 24.1 (9.5) | 36.4 (14.3) | 27.8 (10.9) | 195.2 (76.9) |
Average precipitation days (≥ 0.2 mm) | 12.6 | 11.0 | 9.5 | 6.1 | 8.5 | 11.7 | 12.0 | 11.8 | 10.4 | 12.1 | 11.9 | 11.7 | 129.0 |
Average rainy days (≥ 0.2 mm) | 0.2 | 0.1 | 0.3 | 1.0 | 7.2 | 11.0 | 12.0 | 11.6 | 9.8 | 4.6 | 0.3 | 0.0 | 58.1 |
Average snowy days (≥ 0.2 cm) | 12.6 | 11.6 | 9.6 | 4.9 | 2.2 | 0.1 | 0.0 | 0.1 | 1.4 | 8.7 | 12.8 | 12.3 | 76.0 |
Average relative humidity (%) (at 1500 LST) | 78.4 | 75.3 | 66.1 | 50.6 | 41.2 | 44.9 | 49.9 | 53.6 | 58.2 | 76.4 | 82.4 | 80.2 | 63.1 |
Mean monthly sunshine hours | 55.7 | 95.1 | 180.6 | 248.6 | 293.4 | 313.0 | 307.1 | 263.8 | 163.9 | 77.8 | 49.4 | 30.0 | 2,078.3 |
Percent possible sunshine | 28.5 | 38.0 | 49.6 | 56.3 | 53.8 | 53.7 | 53.3 | 53.4 | 42.0 | 25.0 | 22.8 | 17.7 | 41.2 |
Source: Environment and Climate Change Canada [14] (January minimum) [15] (February maximum / minimum) [16] [17] (March minimum) [18] (April minimum) [19] (May minimumm) [20] (June maximum) [21] (August minimum) [22] (October maximum / minimum) [23] [24] (November maximum / minimum) [25] [26] (December minimum) [27] (sunshine) [13] |
Climate data for Wrigley (Wrigley Airport) Climate ID: 2204000; coordinates 63°12′34″N123°26′12″W / 63.20944°N 123.43667°W ; elevation: 149.7 m (491 ft); 1981-2010 normals [e] | |||||||||||||
---|---|---|---|---|---|---|---|---|---|---|---|---|---|
Month | Jan | Feb | Mar | Apr | May | Jun | Jul | Aug | Sep | Oct | Nov | Dec | Year |
Record high humidex | 11.2 | 10.0 | 18.8 | 24.0 | 30.4 | 38.1 | 37.9 | 36.9 | 29.8 | 21.3 | 7.2 | 11.0 | 38.1 |
Record high °C (°F) | 6.5 (43.7) | 11.1 (52.0) | 19.0 (66.2) | 25.0 (77.0) | 34.0 (93.2) | 37.0 (98.6) | 35.5 (95.9) | 33.5 (92.3) | 28.3 (82.9) | 21.7 (71.1) | 8.9 (48.0) | 11.7 (53.1) | 37.0 (98.6) |
Mean daily maximum °C (°F) | −21.1 (−6.0) | −17.1 (1.2) | −7.9 (17.8) | 5.0 (41.0) | 14.6 (58.3) | 21.7 (71.1) | 23.4 (74.1) | 19.9 (67.8) | 12.5 (54.5) | −0.3 (31.5) | −14.8 (5.4) | −18.6 (−1.5) | 1.5 (34.7) |
Daily mean °C (°F) | −25.4 (−13.7) | −22.1 (−7.8) | −15.0 (5.0) | −1.7 (28.9) | 8.0 (46.4) | 15.0 (59.0) | 16.9 (62.4) | 13.6 (56.5) | 7.1 (44.8) | −3.8 (25.2) | −18.7 (−1.7) | −22.7 (−8.9) | −4.1 (24.6) |
Mean daily minimum °C (°F) | −29.7 (−21.5) | −27.2 (−17.0) | −22.1 (−7.8) | −8.3 (17.1) | 1.3 (34.3) | 8.2 (46.8) | 10.3 (50.5) | 7.2 (45.0) | 1.6 (34.9) | −7.4 (18.7) | −22.5 (−8.5) | −26.7 (−16.1) | −9.6 (14.7) |
Record low °C (°F) | −51.7 (−61.1) | −53.3 (−63.9) | −46.7 (−52.1) | −36.1 (−33.0) | −20.9 (−5.6) | −3.9 (25.0) | −1.1 (30.0) | −6.0 (21.2) | −18.0 (−0.4) | −31.5 (−24.7) | −48.0 (−54.4) | −49.4 (−56.9) | −53.3 (−63.9) |
Record low wind chill | −54.6 | −52.7 | −48.3 | −39.4 | −25.5 | −1.9 | −1.6 | −3.2 | −13.3 | −28.5 | −49.1 | −57.7 | −57.7 |
Average precipitation mm (inches) | 16.7 (0.66) | 14.6 (0.57) | 10.4 (0.41) | 8.1 (0.32) | 22.0 (0.87) | 43.5 (1.71) | 64.0 (2.52) | 49.5 (1.95) | 35.9 (1.41) | 29.4 (1.16) | 20.5 (0.81) | 18.1 (0.71) | 332.6 (13.09) |
Average rainfall mm (inches) | 0.0 (0.0) | 0.0 (0.0) | 0.0 (0.0) | 0.3 (0.01) | 18.4 (0.72) | 43.5 (1.71) | 64.0 (2.52) | 49.5 (1.95) | 32.3 (1.27) | 7.6 (0.30) | 0.0 (0.0) | 0.0 (0.0) | 215.5 (8.48) |
Average snowfall cm (inches) | 19.1 (7.5) | 15.4 (6.1) | 10.9 (4.3) | 8.9 (3.5) | 3.8 (1.5) | 0.0 (0.0) | 0.0 (0.0) | 0.0 (0.0) | 3.4 (1.3) | 21.8 (8.6) | 22.6 (8.9) | 18.9 (7.4) | 124.7 (49.1) |
Average precipitation days (≥ 0.2 mm) | 8.0 | 6.4 | 5.6 | 3.3 | 6.4 | 8.4 | 9.7 | 9.0 | 9.2 | 9.7 | 9.0 | 7.5 | 92.1 |
Average rainy days (≥ 0.2 mm) | 0.0 | 0.0 | 0.0 | 0.4 | 5.6 | 8.2 | 9.7 | 9.0 | 8.3 | 2.2 | 0.1 | 0.0 | 43.3 |
Average snowy days (≥ 0.2 cm) | 8.0 | 6.4 | 5.6 | 2.9 | 1.1 | 0.0 | 0.0 | 0.0 | 1.1 | 7.9 | 9.1 | 7.5 | 49.4 |
Source: Environment and Climate Change Canada (1981-2010 normals) [28] (temperature extremes, humidex, and wind chill 1991-2020) [29] |
Wrigley is a "Designated Authority" in the Dehcho Region of the Northwest Territories, Canada. The Slavey Dene community is located on the east bank of the Mackenzie River, just below its confluence with the Wrigley River and about 466 mi (750 km) northwest of Yellowknife.
Inuvik is the only town in the Inuvik Region, and the third largest community in Canada's Northwest Territories. Located in what is sometimes called the Beaufort Delta Region, it serves as its administrative and service centre and is home to federal, territorial, and Indigenous government offices, along with the regional hospital and airport.
Enterprise is a hamlet in the South Slave Region of the Northwest Territories, Canada, located between Great Slave Lake and the Alberta border on the Hay River.
Hay River, known as "the Hub of the North", is a town in the Northwest Territories, Canada. The town is located on the south shore of Great Slave Lake at the mouth of the Hay River. It is separated into two sections: A new town and an old town. The Hay River/Merlyn Carter Airport is located between the two sections. The town is situated in the South Slave Region. Along with Fort Smith, the town is home to one of the two regional offices of the Northwest Territories.
The Liard River of the North American boreal forest flows through Yukon, British Columbia and the Northwest Territories, Canada. Rising in the Saint Cyr Range of the Pelly Mountains in southeastern Yukon, it flows 1,115 km (693 mi) southeast through British Columbia, marking the northern end of the Rocky Mountains and then curving northeast back into Yukon and Northwest Territories, draining into the Mackenzie River at Fort Simpson, Northwest Territories. The river drains approximately 277,100 km2 (107,000 sq mi) of boreal forest and muskeg.
Fort Simpson is a village, the only one in the entire territory, in the Dehcho Region of the Northwest Territories, Canada. The community is located on an island at the confluence of the Mackenzie and Liard rivers. It is approximately 500 km (310 mi) west of Yellowknife. Both rivers were traditionally trade routes for the Hudson's Bay Company and the native Dene people of the area.
Nahendeh is a territorial electoral district for the Legislative Assembly of the Northwest Territories, Canada. The district is roughly coterminous with the Dehcho Region, whose major communities are Fort Simpson and Fort Liard. The district also encompasses the smaller communities of Wrigley, Sambaa Kʼe, Nahanni Butte, and Jean Marie River.
Fort Good Hope, is a charter community in the Sahtu Region of the Northwest Territories, Canada. It is located on a peninsula between Jackfish Creek and the east bank of the Mackenzie River, about 145 km (90 mi) northwest of Norman Wells.
Fort McPherson is a hamlet located in the Inuvik Region of the Northwest Territories, Canada. It is located on the east bank of the Peel River and is 121 km (75 mi) south of Inuvik on the Dempster Highway.
Fort Liard is a hamlet in the Dehcho Region of the Northwest Territories, Canada. It is located 37 km (23 mi) north of the British Columbia border. It became accessible by road in 1984 with the completion of the Liard Highway.
Sandspit is the largest community on Moresby Island, in Haida Gwaii off the Pacific coast of British Columbia, Canada. The only town on Moresby Island, Sandspit has accommodations, a campground, supermarket and 85-berth harbour serving visitors to Gwaii Haanas National Park Reserve and Haida Heritage Site.
Yarmouth, officially named the Municipality of the District of Yarmouth, is a district municipality in Yarmouth County, Nova Scotia, Canada. Statistics Canada classifies the district municipality as a municipal district.
The Inuvik Region or Beaufort Delta Region is one of five administrative regions in the Northwest Territories of Canada. According to Municipal and Community Affairs the region consists of eight communities with the regional office situated in Inuvik. Most of the communities are in the Beaufort Sea area and are a mixture of Inuit and First Nations.
Moresby Island is a large island (3,399.39 km2 [1,312.51 sq mi]) that forms part of the Haida Gwaii archipelago in British Columbia, Canada, located at 53°04′44″N132°07′40″W It is separated by the narrow Skidegate Channel from the other principal island of the group to the north, Graham Island.
The Canadian territory of Nunavut covers about 1.9 million square kilometres of land and water including part of the mainland, most of the Arctic islands, and all of the islands in Hudson Bay, James Bay, and Ungava Bay which belonged to the Northwest Territories. This makes it the fifth largest country subdivision in the world. If Nunavut were a country, it would rank 13th in area, after the Democratic Republic of the Congo. Nunavut has land borders with Manitoba, the Northwest Territories on several islands as well as the mainland, and a tiny land border with Newfoundland and Labrador on Killiniq Island. Additionally, Nunavut has a land border with Greenland on Hans Island.
The Sahtu Region is an administrative region in Canada's Northwest Territories. Coterminous with the settlement region described in the 1993 Sahtu Dene and Metis Comprehensive Land Claim Agreement, 41,437 km2 (15,999 sq mi) of the Sahtu is collectively owned by its Indigenous Sahtu (Dene) and Métis inhabitants. Although the region's population is predominantly First Nations, a significant non-Indigenous presence exists in Norman Wells, the regional office, established in 1920 to serve the only producing oilfield in the Canadian Territories. Considered to be of vital strategic importance during World War II in the event of a Japanese invasion of Alaska, the region's petroleum resources were exploited by the United States Army with the Canol Project, but the pipeline never became necessary and ultimately operated for less than one year.
The North Slave Region or Tłicho Region is one of five administrative regions in the Northwest Territories of Canada. It is the most populous of the five regions, with a population of almost 23,000. According to Municipal and Community Affairs the region consists of eight communities with the regional office situated in Yellowknife and a sub-office in Behchokǫ̀. With the exception of Yellowknife, the communities are predominantly First Nations.
The South Slave Region is one of five administrative regions in the Northwest Territories of Canada. According to Municipal and Community Affairs the region consists of seven communities with the regional office situated in Fort Smith and a sub-office in Hay River. With the exception of Enterprise and Hay River the communities are predominantly Indigenous, mainly First Nations.
Hay River Reserve is one of only two Indian reserves in Canada's Northwest Territories. Located in the South Slave Region, it is a Slavey community with a population of 259, of which the majority are First Nations and some Métis, at the 2021 Canadian census, a 16.2% decrease from the 2016 census. The main languages on the reserve are South Slavey, and English. In 2017 the Government of the Northwest Territories reported that the population was 329, resulting in an average annual growth rate of 0.4% between 2007 and 2017.
Region 4 is the name of a Statistics Canada census division, one of six in the Northwest Territories, Canada. It was introduced in the 2011 census, along with Regions 1, 2, 3, 5, and 6, resulting in the abolition of the former census divisions of Fort Smith Region and Inuvik Region. Unlike in some other provinces, census divisions do not reflect the organization of local government in the Northwest Territories. These areas exist solely for the purposes of statistical analysis and presentation; they have no government of their own.