Experiment, Georgia | |
---|---|
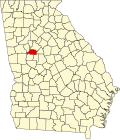
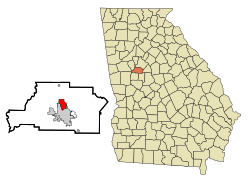
![]() Location in Spalding County and the state of Georgia | |
Coordinates: 33°16′28″N84°16′29″W / 33.27444°N 84.27472°W | |
Country | United States |
State | Georgia |
County | Spalding |
Area | |
• Total | 2.98 sq mi (7.72 km2) |
• Land | 2.97 sq mi (7.70 km2) |
• Water | 0.01 sq mi (0.02 km2) |
Elevation | 945 ft (288 m) |
Population (2020) | |
• Total | 3,328 |
• Density | 1,119.41/sq mi (432.17/km2) |
Time zone | UTC-5 (Eastern (EST)) |
• Summer (DST) | UTC-4 (EDT) |
ZIP code | 30212 |
Area code | 770 |
FIPS code | 13-28296 [2] |
GNIS feature ID | 0331680 [3] |
Experiment is an unincorporated community and census-designated place (CDP) in Spalding County, Georgia, United States. The population was 3,328 in 2020.
Experiment is named for the University of Georgia Agricultural Experiment Station located there. [4] Experiment has been noted for its unusual place name. [5]
The community was heavily damaged by an EF3 tornado on January 12, 2023. The tornado injured 18 people along its path. [6]
Experiment is located at 33°16′28″N84°16′29″W / 33.27444°N 84.27472°W (33.274505, -84.274758), [7] immediately north of Griffin and approximately 30 miles (48.3 km) south-southeast of Atlanta.
According to the United States Census Bureau, the CDP has a total area of 3.0 square miles (7.8 km2), all land.
Climate data for Experiment, Georgia, 1991–2020 normals, extremes 1900–2004 | |||||||||||||
---|---|---|---|---|---|---|---|---|---|---|---|---|---|
Month | Jan | Feb | Mar | Apr | May | Jun | Jul | Aug | Sep | Oct | Nov | Dec | Year |
Record high °F (°C) | 79 (26) | 89 (32) | 88 (31) | 93 (34) | 97 (36) | 103 (39) | 104 (40) | 101 (38) | 103 (39) | 96 (36) | 86 (30) | 79 (26) | 104 (40) |
Mean daily maximum °F (°C) | 55.6 (13.1) | 59.0 (15.0) | 66.8 (19.3) | 74.1 (23.4) | 81.2 (27.3) | 87.3 (30.7) | 89.8 (32.1) | 88.5 (31.4) | 83.9 (28.8) | 75.0 (23.9) | 65.8 (18.8) | 58.0 (14.4) | 73.7 (23.2) |
Daily mean °F (°C) | 45.0 (7.2) | 47.7 (8.7) | 55.5 (13.1) | 62.1 (16.7) | 70.2 (21.2) | 76.6 (24.8) | 79.4 (26.3) | 78.2 (25.7) | 73.7 (23.2) | 63.6 (17.6) | 54.0 (12.2) | 47.2 (8.4) | 62.8 (17.1) |
Mean daily minimum °F (°C) | 34.3 (1.3) | 36.5 (2.5) | 44.3 (6.8) | 50.1 (10.1) | 59.1 (15.1) | 66.0 (18.9) | 69.0 (20.6) | 68.0 (20.0) | 63.5 (17.5) | 52.2 (11.2) | 42.1 (5.6) | 36.4 (2.4) | 51.8 (11.0) |
Record low °F (°C) | −8 (−22) | 5 (−15) | 11 (−12) | 25 (−4) | 35 (2) | 44 (7) | 51 (11) | 51 (11) | 35 (2) | 26 (−3) | 5 (−15) | 0 (−18) | −8 (−22) |
Average precipitation inches (mm) | 5.27 (134) | 4.32 (110) | 5.08 (129) | 4.04 (103) | 3.71 (94) | 4.91 (125) | 5.07 (129) | 5.08 (129) | 4.39 (112) | 3.31 (84) | 4.01 (102) | 5.00 (127) | 54.19 (1,378) |
Average snowfall inches (cm) | 1.1 (2.8) | 0.0 (0.0) | 0.1 (0.25) | 0.0 (0.0) | 0.0 (0.0) | 0.0 (0.0) | 0.0 (0.0) | 0.0 (0.0) | 0.0 (0.0) | 0.0 (0.0) | 0.0 (0.0) | 0.0 (0.0) | 1.2 (3.05) |
Average precipitation days (≥ 0.01 in) | 11.7 | 10.2 | 10.4 | 9.2 | 9.0 | 12.7 | 11.8 | 10.2 | 7.7 | 7.5 | 9.2 | 11.1 | 120.7 |
Average snowy days (≥ 0.1 in) | 0.2 | 0.0 | 0.1 | 0.0 | 0.0 | 0.0 | 0.0 | 0.0 | 0.0 | 0.0 | 0.0 | 0.0 | 0.3 |
Source 1: NOAA (snow/snow days 1981–2010) [8] [9] | |||||||||||||
Source 2: National Weather Service [10] |
Census | Pop. | Note | %± |
---|---|---|---|
1950 | 4,265 | — | |
1960 | 2,497 | −41.5% | |
1970 | 2,256 | −9.7% | |
1980 | 3,731 | 65.4% | |
1990 | 3,762 | 0.8% | |
2000 | 3,233 | −14.1% | |
2010 | 2,894 | −10.5% | |
2020 | 3,328 | 15.0% | |
U.S. Decennial Census [11] 1850-1870 [12] 1870-1880 [13] 1890-1910 [14] 1920-1930 [15] 1940 [16] 1950 [17] 1960 [18] 1970 [19] 1980 [20] 1990 [21] 2000 [22] 2010 [23] 2020 [24] |
Race / Ethnicity (NH = Non-Hispanic) | Pop 2000 [25] | Pop. 2010 [26] | Pop. 2020 [24] | % 2000 | % 2010 | % 2020 |
---|---|---|---|---|---|---|
White alone (NH) | 1,455 | 1,220 | 967 | 45.00% | 42.16% | 29.06% |
Black or African American alone (NH) | 1,694 | 1,504 | 2,024 | 52.40% | 51.97% | 60.82% |
Native American or Alaska Native alone (NH) | 5 | 10 | 4 | 0.15% | 0.35% | 0.12% |
Asian alone (NH) | 1 | 4 | 11 | 0.03% | 0.14% | 0.33% |
Pacific Islander alone (NH) | 0 | 5 | 0 | 0.00% | 0.17% | 0.00% |
Some other race alone (NH) | 4 | 4 | 7 | 0.12% | 0.14% | 0.21% |
Mixed-race or multi-racial (NH) | 34 | 35 | 113 | 1.05% | 1.21% | 3.40% |
Hispanic or Latino (any race) | 40 | 112 | 202 | 1.24% | 3.87% | 6.07% |
Total | 3,233 | 2,894 | 3,328 | 100.00% | 100.00% | 100.00% |
Experiment was first listed as an unincorporated place in the 1950 U.S. census [17] and then designated a census designated place in 1980 U.S. census. [20]