| This article needs additional citations for verification .(November 2024) | 
| Spalding County | |
|---|---|
| Spalding County Courthouse in Griffin | |
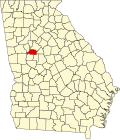
|   Location within the U.S. state of Georgia  | |
|   Georgia's location within the U.S.  | |
| Coordinates: 33°16′N84°17′W / 33.26°N 84.28°W | |
| Country |  United States | 
| State |  Georgia | 
| Founded | 1851 | 
| Named after | Thomas Spalding | 
| Seat | Griffin | 
| Largest city | Griffin | 
| Area | |
|  • Total | 200 sq mi (500 km2) | 
| • Land | 196 sq mi (510 km2) | 
| • Water | 3.1 sq mi (8 km2) 1.6% | 
| Population  (2020) | |
|  • Total | 67,306 [1] | 
| Time zone | UTC−5 (Eastern) | 
| • Summer (DST) | UTC−4 (EDT) | 
| Congressional district | 3rd | 
| Website | spaldingcounty.com | 
Spalding County is a county in the West Central region of the U.S. state of Georgia. As of the 2020 census, the population was 67,306. [2] The county seat is Griffin. [3] [1] The county was created December 20, 1851, and named for former United States representative and senator Thomas Spalding. [4]
Spalding County is included in the Atlanta-Sandy Springs-Roswell MSA.
According to the U.S. Census Bureau, the county has a total area of 200 square miles (520 km2), of which 196 square miles (510 km2) is land and 3.1 square miles (8.0 km2) (1.6%) is water. [5] The county is located in the Piedmont region of the state.
The western portion of Spalding County, west of a line from Sunny Side through Griffin to Orchard Hill, is located in the Upper Flint River sub-basin of the ACF River Basin (Apalachicola-Chattahoochee-Flint River Basin). The eastern part of the county is located in the Upper Ocmulgee River sub-basin of the Altamaha River basin. [6]
| Census | Pop. | Note | %± | 
|---|---|---|---|
| 1860 | 8,699 | — | |
| 1870 | 10,205 | 17.3% | |
| 1880 | 12,585 | 23.3% | |
| 1890 | 13,117 | 4.2% | |
| 1900 | 17,619 | 34.3% | |
| 1910 | 19,741 | 12.0% | |
| 1920 | 21,908 | 11.0% | |
| 1930 | 23,495 | 7.2% | |
| 1940 | 28,427 | 21.0% | |
| 1950 | 31,045 | 9.2% | |
| 1960 | 35,404 | 14.0% | |
| 1970 | 39,514 | 11.6% | |
| 1980 | 47,899 | 21.2% | |
| 1990 | 54,457 | 13.7% | |
| 2000 | 58,417 | 7.3% | |
| 2010 | 64,073 | 9.7% | |
| 2020 | 67,306 | 5.0% | |
| 2024 (est.) | 70,292 | [7] | 4.4% | 
| U.S. Decennial Census [8] 1790-1880 [9] 1890-1910 [10] 1920-1930 [11] 1930-1940 [12] 1940-1950 [13] 1960-1980 [14] 1980-2000 [15] 2010 [2] 2020 [1] | |||
| Race | Num. | Perc. | 
|---|---|---|
| White (non-Hispanic) | 37,105 | 55.13% | 
| Black or African American (non-Hispanic) | 23,148 | 34.39% | 
| Native American | 154 | 0.23% | 
| Asian | 640 | 0.95% | 
| Pacific Islander | 23 | 0.03% | 
| Other/Mixed | 2,570 | 3.82% | 
| Hispanic or Latino | 3,666 | 5.45% | 
As of the 2020 United States census, there were 67,306 people, 25,339 households, and 16,563 families residing in the county.
The Griffin-Spalding County School District has 11 elementary schools, 4 middle schools, 2 high schools, and 4 complementary programs.
Spalding County is solidly Republican at the presidential level having last voted for a Democrat in 1980 when it voted for Jimmy Carter. Since then, the closest a Democrat has come to winning Spalding County was in 1992, when Bill Clinton lost to George H. W. Bush by 5.6 percent.
| Year | Republican | Democratic | Third party(ies) | |||
|---|---|---|---|---|---|---|
| No. | % | No. | % | No. | % | |
| 1912 | 26 | 3.22% | 736 | 91.20% | 45 | 5.58% | 
| 1916 | 41 | 3.99% | 835 | 81.23% | 152 | 14.79% | 
| 1920 | 181 | 17.90% | 830 | 82.10% | 0 | 0.00% | 
| 1924 | 75 | 5.28% | 1,257 | 88.52% | 88 | 6.20% | 
| 1928 | 412 | 19.20% | 1,734 | 80.80% | 0 | 0.00% | 
| 1932 | 54 | 2.40% | 2,185 | 97.07% | 12 | 0.53% | 
| 1936 | 36 | 1.44% | 2,457 | 98.28% | 7 | 0.28% | 
| 1940 | 197 | 6.11% | 3,022 | 93.76% | 4 | 0.12% | 
| 1944 | 217 | 7.18% | 2,805 | 92.79% | 1 | 0.03% | 
| 1948 | 506 | 10.94% | 3,441 | 74.38% | 679 | 14.68% | 
| 1952 | 1,249 | 19.08% | 5,296 | 80.92% | 0 | 0.00% | 
| 1956 | 1,458 | 23.10% | 4,853 | 76.90% | 0 | 0.00% | 
| 1960 | 1,753 | 28.37% | 4,426 | 71.63% | 0 | 0.00% | 
| 1964 | 4,763 | 46.56% | 5,466 | 53.44% | 0 | 0.00% | 
| 1968 | 3,077 | 28.03% | 2,949 | 26.86% | 4,953 | 45.11% | 
| 1972 | 7,183 | 80.84% | 1,702 | 19.16% | 0 | 0.00% | 
| 1976 | 3,739 | 33.00% | 7,593 | 67.00% | 0 | 0.00% | 
| 1980 | 4,809 | 39.00% | 7,176 | 58.19% | 346 | 2.81% | 
| 1984 | 8,571 | 63.73% | 4,878 | 36.27% | 0 | 0.00% | 
| 1988 | 7,730 | 63.68% | 4,318 | 35.57% | 90 | 0.74% | 
| 1992 | 7,262 | 46.15% | 6,392 | 40.63% | 2,080 | 13.22% | 
| 1996 | 7,376 | 50.74% | 6,017 | 41.39% | 1,143 | 7.86% | 
| 2000 | 9,271 | 60.24% | 5,831 | 37.89% | 289 | 1.88% | 
| 2004 | 13,461 | 63.99% | 7,460 | 35.46% | 115 | 0.55% | 
| 2008 | 14,885 | 58.85% | 10,141 | 40.09% | 269 | 1.06% | 
| 2012 | 14,911 | 59.31% | 9,898 | 39.37% | 330 | 1.31% | 
| 2016 | 15,646 | 60.58% | 9,357 | 36.23% | 823 | 3.19% | 
| 2020 | 18,104 | 59.91% | 11,828 | 39.14% | 287 | 0.95% | 
| 2024 | 19,184 | 57.77% | 13,679 | 41.19% | 345 | 1.04% |