Peach County, Georgia

Last updated

Peach County, Georgia
Peach County Courthouse, Fort Valley, GA, US.jpg
Peach County Courthouse in Fort Valley
Map of Georgia highlighting Peach County.svg
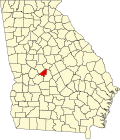
Location within the U.S. state of Georgia
Coordinates: 32°34′N83°50′W / 32.56°N 83.83°W / 32.56; -83.83
CountryFlag of the United States.svg United States
StateFlag of Georgia (U.S. state).svg Georgia
FoundedJuly 18, 1924;101 years ago (1924-07-18)
Named after Peach fruit
Seat Fort Valley
Largest cityFort Valley
Area
  Total
151 sq mi (390 km2)
  Land150 sq mi (390 km2)
  Water1.0 sq mi (2.6 km2)  0.7%
Population
 (2020)
  Total
27,981
  Density187/sq mi (72/km2)
Time zone UTC−5 (Eastern)
  Summer (DST) UTC−4 (EDT)
Congressional district 2nd
Website www.peachcounty.net

Peach County is a county located in the central portion of the U.S. state of Georgia. As of the 2020 census, the population was 27,981. [1] Its county seat is Fort Valley. [2] Founded in 1924, it is the state's newest county, taken from Houston and Macon counties on July 18 of that year. [3] Its namesake is the peach on account of it being located in a peach-growing district. [4]

Contents

Peach County is included in the Warner Robins, GA metropolitan statistical area, which is included in the Macon-Warner Robins, GA combined statistical area.

Geography

According to the U.S. Census Bureau, the county has a total area of 151 square miles (390 km2), of which 150 square miles (390 km2) is land and 1.0 square mile (2.6 km2) (0.7%) is water. [5] It is the fifth-smallest county in Georgia by area.

The majority of Peach County is located in the Lower Ocmulgee River sub-basin of the Altamaha River basin. A small portion of the northern edge of the county, north of Byron, is located in the Upper Ocmulgee River sub-basin of the Altamaha River basin. The very western tip of Peach County is located in the Upper Flint River sub-basin of the ACF River Basin (Apalachicola-Chattahoochee-Flint River Basin). [6]

Major highways

Adjacent counties

Communities

Cities

Demographics

Historical population
CensusPop.Note
1930 10,268
1940 10,3781.1%
1950 11,70512.8%
1960 13,84618.3%
1970 15,99015.5%
1980 19,15119.8%
1990 21,18910.6%
2000 23,66811.7%
2010 27,69517.0%
2020 27,9811.0%
2024 (est.)29,213 [7] 4.4%
U.S. Decennial Census [8]
1790-1880 [9] 1890-1910 [10]
1920-1930 [11] 1930-1940 [12]
1940-1950 [13] 1960-1980 [14]
1980-2000 [15] 2010 [16] 2020 [17]
Peach County, Georgia – Racial and ethnic composition
(NH = Non-Hispanic)
Note: the US Census treats Hispanic/Latino as an ethnic category. This table excludes Latinos from the racial categories and assigns them to a separate category. Hispanics/Latinos may be of any race.
Race / EthnicityPop 2000 [18] Pop 2010 [16] Pop 2020 [17] % 2000% 2010% 2020
White alone (NH)11,65412,49912,11949.24%45.13%43.31%
Black or African American alone (NH)10,68212,64712,13945.13%45.67%43.38%
Native American or Alaska Native alone (NH)6659630.28%0.21%0.23%
Asian alone (NH)772221940.33%0.80%0.69%
Pacific Islander alone (NH)8860.03%0.03%0.02%
Other race alone (NH)2126980.09%0.09%0.35%
Mixed race or Multiracial (NH)1623448150.68%1.24%2.91%
Hispanic or Latino (any race)9981,8902,5474.22%6.82%9.10%
Total23,66827,69527,981100.00%100.00%100.00%

2020 census

As of the 2020 census, the county had a population of 27,981, and 60.0% of residents lived in urban areas while 40.0% lived in rural areas. [19] The median age was 39.1 years; 21.0% of residents were under the age of 18 and 17.2% were 65 years of age or older. For every 100 females there were 92.4 males, and for every 100 females age 18 and over there were 89.1 males age 18 and over. [20]

The racial makeup of the county was 44.7% White, 43.7% Black or African American, 0.4% American Indian and Alaska Native, 0.7% Asian, 0.0% Native Hawaiian and Pacific Islander, 5.3% from some other race, and 5.2% from two or more races. Hispanic or Latino residents of any race comprised 9.1% of the population. [21]

There were 10,693 households, including 6,596 families; 29.6% had children under the age of 18 living with them and 33.6% had a female householder with no spouse or partner present. About 28.2% of households were made up of individuals and 11.4% had someone living alone who was 65 years of age or older. [20]

There were 11,991 housing units, of which 10.8% were vacant. Among occupied housing units, 64.9% were owner-occupied and 35.1% were renter-occupied, and the homeowner vacancy rate was 1.7% while the rental vacancy rate was 8.5%. [20]

Education

It is in the Peach County School District. [22] Peach County High School is the comprehensive high school.

Politics

As of the 2020s, Peach County is a swing county, voting 52.8% for Donald Trump in 2024. Since the 1990s, Peach County has been a bellwether, [23] usually voting for the winning candidate in United States presidential elections. It has voted for the national winner in six of the past eight elections, only picking the national loser in 2000 and 2020. [24] Before this, Peach County voted for the Democratic candidate in most elections during the 20th century, often by large margins.

For elections to the United States House of Representatives, Peach County is part of Georgia's 2nd congressional district, currently represented by Sanford Bishop. For elections to the Georgia State Senate, Peach County is part of District 18. [25] For elections to the Georgia House of Representatives, Peach County is part of districts 134, 147 and 150. [26]

United States presidential election results for Peach County, Georgia [27]
Year Republican Democratic Third party(ies)
%%%
1928 20826.67%57273.33%00.00%
1932 568.54%59590.70%50.76%
1936 495.91%76792.52%131.57%
1940 15517.24%73882.09%60.67%
1944 23620.43%91979.57%00.00%
1948 16613.91%64253.81%38532.27%
1952 37419.70%1,52380.24%10.05%
1956 46123.03%1,54176.97%00.00%
1960 62830.47%1,43369.53%00.00%
1964 1,97055.40%1,58544.57%10.03%
1968 90423.16%1,36234.89%1,63841.96%
1972 3,74760.83%2,41339.17%00.00%
1976 1,16322.57%3,98977.43%00.00%
1980 1,64231.76%3,41566.05%1132.19%
1984 2,65244.05%3,36955.95%00.00%
1988 2,78248.00%2,97251.28%420.72%
1992 2,32733.37%3,67752.73%96913.90%
1996 2,67639.63%3,58253.05%4947.32%
2000 3,52549.39%3,54049.60%721.01%
2004 4,55453.24%3,96146.31%390.46%
2008 5,17346.20%5,92752.94%960.86%
2012 5,28745.83%6,14853.29%1020.88%
2016 5,41350.08%5,10047.18%2962.74%
2020 6,50651.82%5,92247.17%1261.00%
2024 7,10452.80%6,29346.77%570.42%

See also

References

  1. "Census - Geography Profile: Peach County, Georgia". United States Census Bureau . Retrieved December 28, 2022.
  2. "Find a County". National Association of Counties. Archived from the original on May 31, 2011. Retrieved June 7, 2011.
  3. "Peach County". georgia.gov. Archived from the original on December 2, 2008. Retrieved May 7, 2015.
  4. Krakow, Kenneth K. (1975). Georgia Place-Names: Their History and Origins (PDF). Macon, GA: Winship Press. p. 172. ISBN   0-915430-00-2. Archived (PDF) from the original on September 17, 2003.
  5. "US Gazetteer files: 2010, 2000, and 1990". United States Census Bureau. February 12, 2011. Retrieved April 23, 2011.
  6. "Georgia Soil and Water Conservation Commission Interactive Mapping Experience". Georgia Soil and Water Conservation Commission. Archived from the original on October 3, 2018. Retrieved November 22, 2015.
  7. "County Population Totals and Components of Change: 2020-2024". United States Census Bureau. Retrieved August 22, 2025.
  8. "Decennial Census of Population and Housing by Decades". United States Census Bureau.
  9. "1880 Census Population by Counties 1790-1800" (PDF). United States Census Bureau. 1880.
  10. "1910 Census of Population - Georgia" (PDF). United States Census Bureau. 1910. Archived from the original (PDF) on January 16, 2024.
  11. "1930 Census of Population - Georgia" (PDF). United States Census Bureau. 1930.
  12. "1940 Census of Population - Georgia" (PDF). United States Census Bureau. 1940.
  13. "1950 Census of Population - Georgia -" (PDF). United States Census Bureau. 1950.
  14. "1980 Census of Population - Number of Inhabitants - Georgia" (PDF). United States Census Bureau. 1980.
  15. "2000 Census of Population - Population and Housing Unit Counts - Georgia" (PDF). United States Census Bureau. 2000.
  16. 1 2 "P2: Hispanic or Latino, and Not Hispanic or Latino by Race – 2010: DEC Redistricting Data (PL 94-171) – Peach County, Georgia". United States Census Bureau.
  17. 1 2 "P2: Hispanic or Latino, and Not Hispanic or Latino by Race – 2020: DEC Redistricting Data (PL 94-171) – Peach County, Georgia". United States Census Bureau.
  18. "P004 Hispanic or Latino, and Not Hispanic or Latino by Race – 2000: DEC Summary File 1 – Peach County, Georgia". United States Census Bureau.
  19. "2020 Decennial Census Demographic and Housing Characteristics (DHC)". United States Census Bureau. 2023. Retrieved 13 December 2025.
  20. 1 2 3 "2020 Decennial Census Demographic Profile (DP1)". United States Census Bureau. 2021. Retrieved 13 December 2025.
  21. "2020 Decennial Census Redistricting Data (Public Law 94-171)". United States Census Bureau. 2021. Retrieved 13 December 2025.
  22. "2020 CENSUS - SCHOOL DISTRICT REFERENCE MAP: Peach County, GA" (PDF). U.S. Census Bureau . Retrieved August 1, 2022. - Text list
  23. David Wasserman (October 6, 2020), "The 10 Bellwether Counties That Show How Trump Is in Serious Trouble", The New York Times
  24. "Pivot Counties in Georgia", ballotpedia.org , retrieved September 23, 2024
  25. "Georgia General Assembly". www.legis.ga.gov. Retrieved November 28, 2025.
  26. "Georgia General Assembly". www.legis.ga.gov. Retrieved November 28, 2025.
  27. Leip, David. "Dave Leip's Atlas of U.S. Presidential Elections". uselectionatlas.org. Retrieved March 22, 2018.

Further reading

32°34′N83°50′W / 32.56°N 83.83°W / 32.56; -83.83