Putnam County, Georgia | |
|---|---|
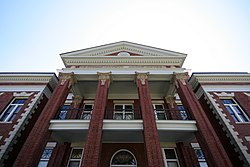
| Putnam County courthouse in Eatonton | |
| Location within the U.S. state of Georgia | |
| Coordinates: 33°19′N83°22′W / 33.32°N 83.37°W | |
| Country | |
| State | |
| Founded | December 10, 1807 |
| Named after | Israel Putnam |
| Seat | Eatonton |
| Largest city | Eatonton |
| Area | |
• Total | 361 sq mi (930 km2) |
| • Land | 345 sq mi (890 km2) |
| • Water | 16 sq mi (41 km2) 4.4% |
| Population (2020) | |
• Total | 22,047 |
| • Density | 64/sq mi (25/km2) |
| Time zone | UTC−5 (Eastern) |
| • Summer (DST) | UTC−4 (EDT) |
| Congressional district | 10th |
| Website | www |
Putnam County is a county located in the central portion of the U.S. state of Georgia. As of the 2020 United States census, the population was 22,047. [1] The county seat is Eatonton. [2]
Since the early 21st century, the county has had a housing boom. It has proximity to Lake Oconee, Lake Sinclair, and the Oconee River, all of which are recreation sites, as well as to major employment centers such as Atlanta, Athens, and Macon.
Putnam County is named in honor of Israel Putnam, a hero of the French and Indian War and a general in the American Revolutionary War. It was settled by European Americans after the war, as migrants moved down from the Upper South. The county was created on December 10, 1807, by an act of the Georgia General Assembly. [3]
Following the invention of the cotton gin, which could profitably process short-staple cotton, the county was developed for cotton cultivation of that type. It thrived in the upland areas, where plantations were developed and worked by the field labor of thousands of African-American slaves.
During the 1919 Red Summer there were many incidents of racial violence including an arson attack where almost a dozen black community buildings were burnt down in late May 1919. [4] The Wheeling Intelligencer claimed the buildings were burnt down because of a "minor racial clash at Dennis Station." [5] During this time armed black and white mobs patrolled the area in fear of each other. [4]
In the first half of the 20th century, thousands of blacks left the state during the Great Migration from 1920 to 1960. The county population dropped by more than half during this period following mechanization of agriculture and as rural workers moved into cities. Since the late 20th century, population has increased. The white population of the county has grown since the turn of the 21st century: in 2010 African Americans comprised 26 percent of the county population, a drop from nearly 42% in 2000.[ citation needed ]
In the 21st century, dairy farming is more important to Putnam County than cotton. It annually holds the nationally known Dairy Festival.
According to the U.S. Census Bureau, the county has a total area of 361 square miles (930 km2), of which 345 square miles (890 km2) is land and 16 square miles (41 km2) (4.4%) is water. [6] The entirety of Putnam County is located in the Upper Oconee River sub-basin of the Altamaha River basin. [7] The county is located in the Piedmont region of the state, with rolling hills, farms, and lakes covering a majority of the county.
| Census | Pop. | Note | %± |
|---|---|---|---|
| 1810 | 10,029 | — | |
| 1820 | 15,475 | 54.3% | |
| 1830 | 13,261 | −14.3% | |
| 1840 | 10,260 | −22.6% | |
| 1850 | 10,794 | 5.2% | |
| 1860 | 10,125 | −6.2% | |
| 1870 | 10,461 | 3.3% | |
| 1880 | 14,539 | 39.0% | |
| 1890 | 14,842 | 2.1% | |
| 1900 | 13,436 | −9.5% | |
| 1910 | 13,876 | 3.3% | |
| 1920 | 15,151 | 9.2% | |
| 1930 | 8,367 | −44.8% | |
| 1940 | 8,514 | 1.8% | |
| 1950 | 7,731 | −9.2% | |
| 1960 | 7,798 | 0.9% | |
| 1970 | 8,394 | 7.6% | |
| 1980 | 10,295 | 22.6% | |
| 1990 | 14,137 | 37.3% | |
| 2000 | 18,812 | 33.1% | |
| 2010 | 21,218 | 12.8% | |
| 2020 | 22,047 | 3.9% | |
| 2024 (est.) | 23,383 | [8] | 6.1% |
| U.S. Decennial Census [9] 1790-1880 [10] 1890-1910 [11] 1920-1930 [12] 1930-1940 [13] 1940-1950 [14] 1960-1980 [15] 1980-2000 [16] 2010 [17] | |||
| Race | Num. | Perc. |
|---|---|---|
| White (non-Hispanic) | 14,316 | 64.93% |
| Black or African American (non-Hispanic) | 5,385 | 24.43% |
| Native American | 33 | 0.15% |
| Asian | 108 | 0.49% |
| Pacific Islander | 1 | 0.0% |
| Other/Mixed | 647 | 2.93% |
| Hispanic or Latino | 1,557 | 7.06% |
As of the 2020 census, the county had a population of 22,047. The median age was 48.9 years. 19.1% of residents were under the age of 18 and 25.3% of residents were 65 years of age or older. For every 100 females there were 93.6 males, and for every 100 females age 18 and over there were 92.4 males age 18 and over. 0.0% of residents lived in urban areas, while 100.0% lived in rural areas. [19] [20] [21]
The census recorded 6,282 families residing in the county. [20]
The racial makeup of the county was 66.5% White, 24.6% Black or African American, 0.4% American Indian and Alaska Native, 0.5% Asian, 0.0% Native Hawaiian and Pacific Islander, 2.8% from some other race, and 5.2% from two or more races. Hispanic or Latino residents of any race comprised 7.1% of the population. [21]
There were 9,181 households in the county, of which 25.7% had children under the age of 18 living with them and 27.3% had a female householder with no spouse or partner present. About 25.9% of all households were made up of individuals and 12.9% had someone living alone who was 65 years of age or older. [20]
There were 13,032 housing units, of which 29.6% were vacant. Among occupied housing units, 73.3% were owner-occupied and 26.7% were renter-occupied. The homeowner vacancy rate was 1.8% and the rental vacancy rate was 6.6%. [20]
The Putnam County Charter School System and Gatewood Schools Inc. serve the community.
As of the 2020s, Putnam County is a strongly Republican voting county, voting 71% for Donald Trump in 2024. For elections to the United States House of Representatives, Putnam County is part of Georgia's 10th congressional district, currently represented by Mike Collins. For elections to the Georgia State Senate, Putnam County is part of District 25. [22] For elections to the Georgia House of Representatives, Putnam County is part of district District 124. [23]
| Year | Republican | Democratic | Third party(ies) | |||
|---|---|---|---|---|---|---|
| № | % | № | % | № | % | |
| 1912 | 7 | 1.49% | 460 | 97.66% | 4 | 0.85% |
| 1916 | 0 | 0.00% | 462 | 98.30% | 8 | 1.70% |
| 1920 | 5 | 1.18% | 420 | 98.82% | 0 | 0.00% |
| 1924 | 7 | 1.50% | 457 | 97.65% | 4 | 0.85% |
| 1928 | 57 | 7.71% | 682 | 92.29% | 0 | 0.00% |
| 1932 | 33 | 4.09% | 770 | 95.53% | 3 | 0.37% |
| 1936 | 51 | 6.75% | 703 | 93.11% | 1 | 0.13% |
| 1940 | 61 | 7.70% | 730 | 92.17% | 1 | 0.13% |
| 1944 | 74 | 9.55% | 701 | 90.45% | 0 | 0.00% |
| 1948 | 110 | 12.88% | 609 | 71.31% | 135 | 15.81% |
| 1952 | 250 | 16.66% | 1,251 | 83.34% | 0 | 0.00% |
| 1956 | 268 | 19.69% | 1,093 | 80.31% | 0 | 0.00% |
| 1960 | 305 | 21.65% | 1,104 | 78.35% | 0 | 0.00% |
| 1964 | 1,196 | 54.02% | 1,018 | 45.98% | 0 | 0.00% |
| 1968 | 594 | 21.66% | 972 | 35.44% | 1,177 | 42.91% |
| 1972 | 1,963 | 76.47% | 604 | 23.53% | 0 | 0.00% |
| 1976 | 835 | 29.04% | 2,040 | 70.96% | 0 | 0.00% |
| 1980 | 1,166 | 36.70% | 1,951 | 61.41% | 60 | 1.89% |
| 1984 | 1,830 | 57.80% | 1,336 | 42.20% | 0 | 0.00% |
| 1988 | 2,111 | 57.74% | 1,532 | 41.90% | 13 | 0.36% |
| 1992 | 1,756 | 37.41% | 2,149 | 45.78% | 789 | 16.81% |
| 1996 | 2,306 | 44.81% | 2,340 | 45.47% | 500 | 9.72% |
| 2000 | 3,596 | 57.09% | 2,612 | 41.47% | 91 | 1.44% |
| 2004 | 5,188 | 63.91% | 2,880 | 35.48% | 50 | 0.62% |
| 2008 | 5,966 | 65.28% | 3,102 | 33.94% | 71 | 0.78% |
| 2012 | 6,215 | 67.34% | 2,926 | 31.70% | 88 | 0.95% |
| 2016 | 6,544 | 68.68% | 2,758 | 28.95% | 226 | 2.37% |
| 2020 | 8,291 | 69.92% | 3,448 | 29.08% | 118 | 1.00% |
| 2024 | 9,136 | 70.95% | 3,696 | 28.70% | 45 | 0.35% |
| Year | Republican | Democratic | Third party(ies) | |||
|---|---|---|---|---|---|---|
| № | % | № | % | № | % | |
| 2022 | 6,594 | 70.98% | 2,696 | 29.02% | 0 | 0.00% |