Monroe County | |
---|---|
![]() | |
![]() Location within the U.S. state of Georgia | |
![]() Georgia's location within the U.S. | |
Coordinates: 33°01′N83°55′W / 33.01°N 83.91°W | |
Country | ![]() |
State | ![]() |
Founded | 1821 |
Named after | James Monroe |
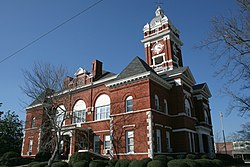
Seat | Forsyth |
Largest city | Forsyth |
Government | |
• Commission Chair | Greg Tapley |
Area | |
• Total | 398 sq mi (1,030 km2) |
• Land | 396 sq mi (1,030 km2) |
• Water | 2.2 sq mi (6 km2) 0.5% |
Population (2020) | |
• Total | 27,957 |
• Estimate (2024) | 31,437 ![]() |
• Density | 70/sq mi (27/km2) |
Time zone | UTC−5 (Eastern) |
• Summer (DST) | UTC−4 (EDT) |
Congressional district | 8th |
Website | www |
Monroe County is a county located in the central portion of the U.S. state of Georgia. As of the 2020 census, the population was 27,957. [1] The county seat is Forsyth. [2] The county was created on May 15, 1821. [3] The county was named for James Monroe. [4] Monroe County is included in the Macon, GA metropolitan statistical area.
According to the U.S. Census Bureau, the county has a total area of 398 square miles (1,030 km2), of which 396 square miles (1,030 km2) is land and 2.2 square miles (5.7 km2) (0.5%) is water. [5] Located on the fall line, the county falls in between the Piedmont and the Atlantic coastal plain. The vast majority of Monroe County is located in the Upper Ocmulgee River sub-basin of the Altamaha River basin, with just a tiny southwestern corner of the county, west of a line between Yatesville and Culloden, located in the Upper Flint River sub-basin of the ACF River Basin (Apalachicola-Chattahoochee-Flint River Basin). [6]
Census | Pop. | Note | %± |
---|---|---|---|
1830 | 16,202 | — | |
1840 | 16,275 | 0.5% | |
1850 | 16,985 | 4.4% | |
1860 | 15,953 | −6.1% | |
1870 | 17,213 | 7.9% | |
1880 | 18,808 | 9.3% | |
1890 | 19,137 | 1.7% | |
1900 | 20,682 | 8.1% | |
1910 | 20,450 | −1.1% | |
1920 | 20,138 | −1.5% | |
1930 | 11,606 | −42.4% | |
1940 | 10,749 | −7.4% | |
1950 | 10,523 | −2.1% | |
1960 | 10,495 | −0.3% | |
1970 | 10,991 | 4.7% | |
1980 | 14,610 | 32.9% | |
1990 | 17,113 | 17.1% | |
2000 | 21,757 | 27.1% | |
2010 | 26,424 | 21.5% | |
2020 | 27,957 | 5.8% | |
2024 (est.) | 31,437 | [7] | 12.4% |
U.S. Decennial Census [8] 1790-1880 [9] 1890-1910 [10] 1920-1930 [11] 1930-1940 [12] 1940-1950 [13] 1960-1980 [14] 1980-2000 [15] 2010 [16] 2020 [17] |
Race / Ethnicity | Pop 2000 [18] | Pop 2010 [16] | Pop 2020 [17] | % 2000 | % 2010 | % 2020 |
---|---|---|---|---|---|---|
White alone (NH) | 15,150 | 19,101 | 19,954 | 69.63% | 72.29% | 71.37% |
Black or African American alone (NH) | 6,015 | 6,249 | 6,084 | 27.65% | 23.65% | 21.76% |
Native American or Alaska Native alone (NH) | 67 | 64 | 34 | 0.31% | 0.24% | 0.12% |
Asian alone (NH) | 74 | 209 | 239 | 0.34% | 0.79% | 0.85% |
Pacific Islander alone (NH) | 6 | 4 | 0 | 0.03% | 0.02% | 0.00% |
Other race alone (NH) | 6 | 14 | 86 | 0.03% | 0.05% | 0.31% |
Mixed race or Multiracial (NH) | 158 | 248 | 846 | 0.73% | 0.94% | 3.03% |
Hispanic or Latino (any race) | 281 | 535 | 714 | 1.29% | 2.02% | 2.55% |
Total | 21,757 | 26,424 | 27,957 | 100.00% | 100.00% | 100.00% |
As of the 2020 United States census, there were 27,957 people, 9,760 households, and 6,179 families residing in the county.
Year | Republican | Democratic | Third party(ies) | |||
---|---|---|---|---|---|---|
No. | % | No. | % | No. | % | |
1912 | 50 | 6.49% | 702 | 91.17% | 18 | 2.34% |
1916 | 65 | 7.76% | 721 | 86.04% | 52 | 6.21% |
1920 | 83 | 9.02% | 837 | 90.98% | 0 | 0.00% |
1924 | 64 | 8.34% | 672 | 87.61% | 31 | 4.04% |
1928 | 329 | 29.12% | 801 | 70.88% | 0 | 0.00% |
1932 | 45 | 3.61% | 1,200 | 96.31% | 1 | 0.08% |
1936 | 147 | 10.27% | 1,277 | 89.24% | 7 | 0.49% |
1940 | 49 | 4.58% | 1,014 | 94.86% | 6 | 0.56% |
1944 | 410 | 26.59% | 1,132 | 73.41% | 0 | 0.00% |
1948 | 169 | 11.90% | 881 | 62.04% | 370 | 26.06% |
1952 | 501 | 17.23% | 2,406 | 82.77% | 0 | 0.00% |
1956 | 506 | 24.67% | 1,545 | 75.33% | 0 | 0.00% |
1960 | 581 | 26.14% | 1,642 | 73.86% | 0 | 0.00% |
1964 | 1,665 | 51.33% | 1,578 | 48.64% | 1 | 0.03% |
1968 | 770 | 23.91% | 1,028 | 31.93% | 1,422 | 44.16% |
1972 | 2,181 | 73.43% | 789 | 26.57% | 0 | 0.00% |
1976 | 1,078 | 26.68% | 2,962 | 73.32% | 0 | 0.00% |
1980 | 1,242 | 32.18% | 2,542 | 65.85% | 76 | 1.97% |
1984 | 2,420 | 52.51% | 2,189 | 47.49% | 0 | 0.00% |
1988 | 2,570 | 56.38% | 1,970 | 43.22% | 18 | 0.39% |
1992 | 2,423 | 39.28% | 2,774 | 44.97% | 971 | 15.74% |
1996 | 3,054 | 48.19% | 2,768 | 43.67% | 516 | 8.14% |
2000 | 4,561 | 60.48% | 2,839 | 37.65% | 141 | 1.87% |
2004 | 6,522 | 66.59% | 3,216 | 32.84% | 56 | 0.57% |
2008 | 7,933 | 65.31% | 4,106 | 33.80% | 108 | 0.89% |
2012 | 8,361 | 68.00% | 3,785 | 30.78% | 149 | 1.21% |
2016 | 8,832 | 69.61% | 3,571 | 28.15% | 284 | 2.24% |
2020 | 11,057 | 70.91% | 4,385 | 28.12% | 150 | 0.96% |
2024 | 12,954 | 73.17% | 4,689 | 26.49% | 61 | 0.34% |
All parts of the county are in the Monroe County School District. [20]