Marion County, Georgia

Last updated

Marion County, Georgia
Marion County Courthouse (NRHP) Buena Vista, GA.JPG
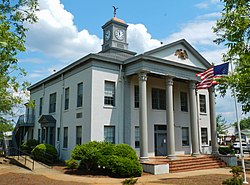
Marion County Courthouse in Buena Vista
Map of Georgia highlighting Marion County.svg
Location within the U.S. state of Georgia
Coordinates: 32°21′N84°32′W / 32.35°N 84.53°W / 32.35; -84.53
CountryFlag of the United States.svg United States
StateFlag of Georgia (U.S. state).svg Georgia
FoundedDecember 14, 1827;198 years ago (1827-12-14)
Named after Francis Marion
Seat Buena Vista
Largest cityBuena Vista
Area
  Total
367 sq mi (950 km2)
  Land366 sq mi (950 km2)
  Water1.5 sq mi (3.9 km2)
Population
 (2020)
  Total
7,498
  Estimate 
(2024)
7,635 Increase2.svg
  Density20.5/sq mi (7.91/km2)
Time zone UTC−5 (Eastern)
  Summer (DST) UTC−4 (EDT)
Congressional district 2nd
Website www.marioncountyga.org

Marion County is a county located in the west central portion of the U.S. state of Georgia. As of the 2020 census, the county had a population of 7,498. [1] The county seat is Buena Vista. [2] The county was created on December 14, 1827. The county was named for General Francis Marion of South Carolina. [3]

Contents

Marion County is included in the Columbus, GA-AL metropolitan statistical area.

The art site of Pasaquan is located in Marion County.

Geography

According to the U.S. Census Bureau, the county has a total area of 367 square miles (950 km2), of which 366 square miles (950 km2) is land and 1.5 square miles (3.9 km2) (0.4%) is water. [4]

The southern half of Marion County, roughly south of Buena Vista, is located in the Kinchafoonee-Muckalee sub-basin of the ACF River Basin (Apalachicola-Chattahoochee-Flint River Basin). The northwestern portion of the county is located in the Middle Chattahoochee River-Walter F. George Lake sub-basin of the same ACF River Basin. The majority of the northeastern portion of Marion County is located in the Middle Flint River sub-basin of the larger ACF River Basin, with just very small portions of the northeastern border, most of which is bisected by State Route 127 south of Mauk, located in the Upper Flint River sub-basin of the same larger ACF River Basin. [5]

Major highways

Adjacent counties

Communities

City

Census-designated place

Unincorporated communities

Demographics

Historical population
CensusPop.Note
1830 1,436
1840 4,812235.1%
1850 10,280113.6%
1860 7,390−28.1%
1870 8,0008.3%
1880 8,5987.5%
1890 7,728−10.1%
1900 10,08030.4%
1910 9,147−9.3%
1920 7,604−16.9%
1930 6,968−8.4%
1940 6,954−0.2%
1950 6,521−6.2%
1960 5,477−16.0%
1970 5,099−6.9%
1980 5,2973.9%
1990 5,5905.5%
2000 7,14427.8%
2010 8,74222.4%
2020 7,498−14.2%
2024 (est.)7,635 [6] 1.8%
U.S. Decennial Census [7]
1790-1880 [8] 1890-1910 [9]
1920-1930 [10] 1930-1940 [11]
1940-1950 [12] 1960-1980 [13]
1980-2000 [14] 2010 [15]
Marion County racial composition as of 2020 [16]
RaceNum.Perc.
White (non-Hispanic)4,48659.83%
Black or African American (non-Hispanic)2,12228.3%
Native American 120.16%
Asian 550.73%
Pacific Islander 150.2%
Other/Mixed 2483.31%
Hispanic or Latino 5607.47%

2020 census

As of the 2020 census, the county had a population of 7,498. The median age was 44.6 years. 21.9% of residents were under the age of 18 and 19.4% of residents were 65 years of age or older. For every 100 females there were 97.0 males, and for every 100 females age 18 and over there were 96.5 males age 18 and over. 0.0% of residents lived in urban areas, while 100.0% lived in rural areas. [17] [18] [19]

The racial makeup of the county was 60.7% White, 28.7% Black or African American, 0.3% American Indian and Alaska Native, 0.7% Asian, 0.2% Native Hawaiian and Pacific Islander, 4.6% from some other race, and 4.7% from two or more races. Hispanic or Latino residents of any race comprised 7.5% of the population. [19]

As of the 2020 census, there were 2,969 households and 2,396 families in the county, of which 29.8% had children under the age of 18 living with them and 28.8% had a female householder with no spouse or partner present. About 28.0% of all households were made up of individuals and 13.2% had someone living alone who was 65 years of age or older. [18]

There were 3,497 housing units, of which 15.1% were vacant. Among occupied housing units, 71.7% were owner-occupied and 28.3% were renter-occupied. The homeowner vacancy rate was 0.9% and the rental vacancy rate was 4.8%. [18]

Education

The Marion County School District is the only school district in the county. [20] It contains a primary school and a secondary school that serve students from preschool to grade 12. [21]

Politics

As of the 2020s, Marion County is a Republican stronghold, voting 64.84% for Donald Trump in 2024. As with most Solid South counties, Marion County was dominated by the Democratic Party presidential level until 1964. Starting with the 2000s, the county has become consistently Republican at the presidential level, though by smaller margins than many rural counties in Georgia.

For elections to the United States House of Representatives, Marion County is part of Georgia's 2nd congressional district, currently represented by Sanford Bishop. For elections to the Georgia State Senate, Marion County is part of District 15. [22] For elections to the Georgia House of Representatives, Marion County is part of District 151. [23]

United States presidential election results for Marion County, Georgia [24]
Year Republican Democratic Third party(ies)
%%%
1912 4113.85%24081.08%155.07%
1916 9620.51%33070.51%428.97%
1920 18043.27%23656.73%00.00%
1924 319.66%27284.74%185.61%
1928 11423.80%36576.20%00.00%
1932 245.01%45594.99%00.00%
1936 6212.84%42086.96%10.21%
1940 7711.27%60588.58%10.15%
1944 7012.26%50187.74%00.00%
1948 458.32%28352.31%21339.37%
1952 18221.85%65178.15%00.00%
1956 15820.36%61879.64%00.00%
1960 15419.27%64580.73%00.00%
1964 71966.27%36533.64%10.09%
1968 18614.51%24719.27%84966.22%
1972 85083.83%16416.17%00.00%
1976 29118.13%1,31481.87%00.00%
1980 56731.98%1,17466.22%321.80%
1984 84647.08%95152.92%00.00%
1988 80448.67%84451.09%40.24%
1992 71134.58%1,14555.69%2009.73%
1996 67837.23%97753.65%1669.12%
2000 1,18754.35%98244.96%150.69%
2004 1,67056.48%1,27543.12%120.41%
2008 1,77255.58%1,38143.32%351.10%
2012 1,73354.51%1,41244.42%341.07%
2016 1,92160.22%1,21338.03%561.76%
2020 2,27562.74%1,31236.18%391.08%
2024 2,34864.84%1,25334.60%200.55%

See also

References

  1. "Census - Geography Profile: Marion County, Georgia". United States Census Bureau . Retrieved December 27, 2022.
  2. "Find a County". National Association of Counties. Retrieved June 7, 2011.
  3. Gannett, Henry (1905). The Origin of Certain Place Names in the United States. U.S. Government Printing Office. p. 200.
  4. "US Gazetteer files: 2010, 2000, and 1990". United States Census Bureau. February 12, 2011. Retrieved April 23, 2011.
  5. "Georgia Soil and Water Conservation Commission Interactive Mapping Experience". Georgia Soil and Water Conservation Commission. Archived from the original on October 3, 2018. Retrieved November 22, 2015.
  6. "County Population Totals and Components of Change: 2020-2024". United States Census Bureau. Retrieved August 22, 2025.
  7. "Decennial Census of Population and Housing by Decades". United States Census Bureau.
  8. "1880 Census Population by Counties 1790-1800" (PDF). United States Census Bureau. 1880.
  9. "1910 Census of Population - Georgia" (PDF). United States Census Bureau. 1910. Archived from the original (PDF) on January 16, 2024.
  10. "1930 Census of Population - Georgia" (PDF). United States Census Bureau. 1930.
  11. "1940 Census of Population - Georgia" (PDF). United States Census Bureau. 1940.
  12. "1950 Census of Population - Georgia -" (PDF). United States Census Bureau. 1950.
  13. "1980 Census of Population - Number of Inhabitants - Georgia" (PDF). United States Census Bureau. 1980.
  14. "2000 Census of Population - Population and Housing Unit Counts - Georgia" (PDF). United States Census Bureau. 2000.
  15. "State & County QuickFacts". United States Census Bureau. Archived from the original on June 7, 2011. Retrieved June 24, 2014.
  16. "Explore Census Data". data.census.gov. Retrieved December 18, 2021.
  17. "2020 Decennial Census Demographic and Housing Characteristics (DHC)". United States Census Bureau. 2023. Retrieved 13 December 2025.
  18. 1 2 3 "2020 Decennial Census Demographic Profile (DP1)". United States Census Bureau. 2021. Retrieved 13 December 2025.
  19. 1 2 "2020 Decennial Census Redistricting Data (Public Law 94-171)". United States Census Bureau. 2021. Retrieved 13 December 2025.
  20. "2020 CENSUS - SCHOOL DISTRICT REFERENCE MAP: Marion County, GA" (PDF). U.S. Census Bureau . Retrieved September 26, 2024. - Text list
  21. "Marion County Schools". www.marion.k12.ga.us. Retrieved July 15, 2019.
  22. "Georgia General Assembly". www.legis.ga.gov. Retrieved November 28, 2025.
  23. "Georgia General Assembly". www.legis.ga.gov. Retrieved November 28, 2025.
  24. Leip, David. "Dave Leip's Atlas of U.S. Presidential Elections". uselectionatlas.org. Retrieved March 22, 2018.

32°21′N84°32′W / 32.35°N 84.53°W / 32.35; -84.53