Crisp County | |
|---|---|
| Crisp County Courthouse in Cordele | |
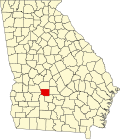
| Location within the U.S. state of Georgia | |
| Georgia's location within the U.S. | |
| Coordinates: 31°56′N83°46′W / 31.93°N 83.77°W | |
| Country | |
| State | |
| Founded | 1905 |
| Named after | Charles Frederick Crisp |
| Seat | Cordele |
| Largest city | Cordele |
| Area | |
• Total | 281 sq mi (730 km2) |
| • Land | 273 sq mi (710 km2) |
| • Water | 8.4 sq mi (22 km2) 3.0% |
| Population (2020) | |
• Total | 20,128 |
| • Density | 74/sq mi (29/km2) |
| Time zone | UTC−5 (Eastern) |
| • Summer (DST) | UTC−4 (EDT) |
| Congressional district | 2nd |
| Website | www |
Crisp County is a county located in the central portion of the U.S. state of Georgia. As of the 2020 census, the population was 20,128. [1] The county seat is Cordele. [2] The county was created on August 17, 1905, from Dooly County and named for Georgia Congressman Charles Frederick Crisp. [3] [4]
Crisp County comprises the Cordele, GA micropolitan statistical area.
According to the U.S. Census Bureau, the county has a total area of 281 square miles (730 km2), of which 273 square miles (710 km2) is land and 8.4 square miles (22 km2) (3.0%) is water. [5]
The western two-thirds of Crisp County, bordered on the east by a line from south of Arabi running northeast, is located in the Middle Flint River sub-basin of the ACF River Basin (Apalachicola-Chattahoochee-Flint River Basin). The eastern third of the county is located in the Alapaha River sub-basin of the Suwannee River. [6]
| Census | Pop. | Note | %± |
|---|---|---|---|
| 1910 | 16,423 | — | |
| 1920 | 18,914 | 15.2% | |
| 1930 | 17,343 | −8.3% | |
| 1940 | 17,540 | 1.1% | |
| 1950 | 17,663 | 0.7% | |
| 1960 | 17,768 | 0.6% | |
| 1970 | 18,087 | 1.8% | |
| 1980 | 19,489 | 7.8% | |
| 1990 | 20,011 | 2.7% | |
| 2000 | 21,996 | 9.9% | |
| 2010 | 23,439 | 6.6% | |
| 2020 | 20,128 | −14.1% | |
| 2024 (est.) | 19,468 | [7] | −3.3% |
| U.S. Decennial Census [8] 1790-1880 [9] 1890-1910 [10] 1920-1930 [11] 1930-1940 [12] 1940-1950 [13] 1960-1980 [14] 1980-2000 [15] 2010 [16] | |||
| Race | Num. | Perc. |
|---|---|---|
| White (non-Hispanic) | 9,892 | 49.15% |
| Black or African American (non-Hispanic) | 8,821 | 43.82% |
| Native American | 18 | 0.09% |
| Asian | 180 | 0.89% |
| Pacific Islander | 4 | 0.02% |
| Other/Mixed | 579 | 2.88% |
| Hispanic or Latino | 634 | 3.15% |
As of the 2020 United States census, there were 20,128 people, 8,585 households, and 5,712 families residing in the county.
| Year | Republican | Democratic | Third party(ies) | |||
|---|---|---|---|---|---|---|
| No. | % | No. | % | No. | % | |
| 1912 | 45 | 6.42% | 644 | 91.87% | 12 | 1.71% |
| 1916 | 100 | 14.68% | 577 | 84.73% | 4 | 0.59% |
| 1920 | 83 | 12.81% | 565 | 87.19% | 0 | 0.00% |
| 1924 | 21 | 4.41% | 439 | 92.23% | 16 | 3.36% |
| 1928 | 402 | 43.46% | 523 | 56.54% | 0 | 0.00% |
| 1932 | 10 | 1.35% | 725 | 97.97% | 5 | 0.68% |
| 1936 | 79 | 7.12% | 1,029 | 92.70% | 2 | 0.18% |
| 1940 | 129 | 10.91% | 1,049 | 88.75% | 4 | 0.34% |
| 1944 | 217 | 15.32% | 1,199 | 84.68% | 0 | 0.00% |
| 1948 | 221 | 11.22% | 1,225 | 62.18% | 524 | 26.60% |
| 1952 | 949 | 30.96% | 2,116 | 69.04% | 0 | 0.00% |
| 1956 | 835 | 24.84% | 2,526 | 75.16% | 0 | 0.00% |
| 1960 | 963 | 28.94% | 2,365 | 71.06% | 0 | 0.00% |
| 1964 | 3,337 | 65.52% | 1,756 | 34.48% | 0 | 0.00% |
| 1968 | 935 | 17.90% | 1,017 | 19.47% | 3,271 | 62.63% |
| 1972 | 3,623 | 84.16% | 682 | 15.84% | 0 | 0.00% |
| 1976 | 1,328 | 26.17% | 3,747 | 73.83% | 0 | 0.00% |
| 1980 | 1,861 | 34.80% | 3,403 | 63.64% | 83 | 1.55% |
| 1984 | 2,895 | 57.63% | 2,128 | 42.37% | 0 | 0.00% |
| 1988 | 2,916 | 62.94% | 1,690 | 36.48% | 27 | 0.58% |
| 1992 | 2,253 | 39.46% | 2,610 | 45.72% | 846 | 14.82% |
| 1996 | 2,321 | 43.83% | 2,504 | 47.28% | 471 | 8.89% |
| 2000 | 3,285 | 58.57% | 2,268 | 40.44% | 56 | 1.00% |
| 2004 | 3,865 | 61.80% | 2,357 | 37.69% | 32 | 0.51% |
| 2008 | 4,424 | 58.56% | 3,085 | 40.84% | 45 | 0.60% |
| 2012 | 4,182 | 56.51% | 3,167 | 42.80% | 51 | 0.69% |
| 2016 | 4,549 | 60.26% | 2,837 | 37.58% | 163 | 2.16% |
| 2020 | 4,985 | 62.03% | 2,982 | 37.11% | 69 | 0.86% |
| 2024 | 5,099 | 62.83% | 2,993 | 36.88% | 24 | 0.30% |