This article needs additional citations for verification .(May 2021) |
Groote Eylandt Airport | |||||||||||
|---|---|---|---|---|---|---|---|---|---|---|---|
| Summary | |||||||||||
| Airport type | Public | ||||||||||
| Operator | Groote Eylandt Mining Co. | ||||||||||
| Serves | Groote Eylandt, Northern Territory, Australia | ||||||||||
| Location | Angurugu | ||||||||||
| Elevation AMSL | 53 ft / 16 m | ||||||||||
| Coordinates | 13°58′30″S136°27′36″E / 13.97500°S 136.46000°E | ||||||||||
| Maps | |||||||||||
 | |||||||||||
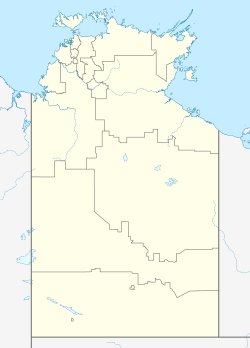 YGTE Location in the Northern Territory | |||||||||||
 Interactive map of Groote Eylandt Airport | |||||||||||
| Runways | |||||||||||
| |||||||||||
| Sources: Australian AIP and aerodrome chart [1] | |||||||||||
Groote Eylandt Airport( IATA : GTE, ICAO : YGTE) is an airport serving Groote Eylandt, [1] an island in the Gulf of Carpentaria in Northern Territory, Australia. The airport is operated by the Groote Eylandt Mining Co. [1] and is located north of the community of Angurugu.