Houghton-le-Spring | |
---|---|
Former county constituency for the House of Commons | |
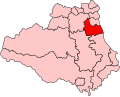
![]() Boundary of Houghton-le-Spring in County Durham, boundaries 1974–1983 | |
County | County Durham |
Major settlements | Houghton-le-Spring |
1885–1983 | |
Seats | One |
Created from | South Durham |
Replaced by | Houghton & Washington and Easington [1] |
Houghton-le-Spring was a county constituency of the House of Commons of the Parliament of the United Kingdom from 1885 to 1983. Centred on the town of Houghton-le-Spring, now part of the City of Sunderland, it elected one Member of Parliament (MP) by the first-past-the-post system of election.
The constituency was created for the 1885 general election by the Redistribution of Seats Act 1885 as one of eight new single-member divisions of the county of Durham, replacing the two 2-member seats of North Durham and South Durham. [2] The seat included the towns of Houghton-le-Spring, Hetton-le-Hole and Seaham and areas to the south and west of the borough of Sunderland. The majority now lies within the City of Sunderland in the metropolitan county of Tyne and Wear.
NB included only non-resident freeholders in the parliamentary borough of Sunderland.
See map on Vision of Britain website. [3]
Rural/coastal areas between South Shields and Sunderland, including the Boldons, transferred from Jarrow. Lost Hetton-le-Hole to the new Durham Division of County Durham and Seaham to the new Seaham Division.
Seaham (including Seaham Harbour) transferred back from the abolished Seaham Division. Lost areas to the Borough Constituencies of South Shields, Sunderland North and Sunderland South as a result of the expansion of the respective County Boroughs. Remaining northern areas, largely comprising the Urban District of Boldon (which had largely succeeded the abolished Rural District of South Shields), transferred to Jarrow.
The Urban District of Hetton transferred back from Durham and northern parts of the Rural District of Easington, including East Murton, transferred from Easington. Parts comprising the former Rural District of Sunderland, which had been largely absorbed by the County Borough, were transferred to Sunderland North (Hylton) and Sunderland South (Ryhope and Silksworth).
The seat was abolished for the 1983 general election as a result of the periodic review of parliamentary constituencies following the re-organisation of local government under the Local Government Act 1972. On abolition, Seaham and East Murton, which had been retained within the county of Durham and comprised about 40% of the electorate, were returned to the Easington constituency. The remainder, including Houghton-le-Spring and Hetton-le-Hole, was included in the new constituency of Houghton and Washington in the county of Tyne and Wear. [7]
Election | Member | Party | |
---|---|---|---|
1885 | John Wilson | Liberal | |
1886 | Nicholas Wood | Conservative | |
1892 | Henry Fenwick | Liberal | |
1895 | Robert Cameron | Liberal | |
1913 by-election | Tom Wing | Liberal | |
1918 | Robert Richardson | Labour | |
1931 | Robert Chapman | Conservative | |
1935 | William Stewart | Labour | |
1945 | Bill Blyton | Labour | |
1964 | Tom Urwin | Labour | |
1983 | constituency abolished |
Party | Candidate | Votes | % | ±% | |
---|---|---|---|---|---|
Lib-Lab | John Wilson | 6,511 | 57.7 | ||
Conservative | Nicholas Wood | 4,767 | 42.3 | ||
Majority | 1,744 | 15.4 | |||
Turnout | 11,278 | 86.8 | |||
Registered electors | 12,992 | ||||
Lib-Lab win (new seat) |
Party | Candidate | Votes | % | ±% | |
---|---|---|---|---|---|
Conservative | Nicholas Wood | 5,870 | 53.7 | +11.4 | |
Lib-Lab | John Wilson | 5,059 | 46.3 | −11.4 | |
Majority | 811 | 7.4 | N/A | ||
Turnout | 10,929 | 84.1 | −2.7 | ||
Registered electors | 12,992 | ||||
Conservative gain from Lib-Lab | Swing | +11.4 |
Party | Candidate | Votes | % | ±% | |
---|---|---|---|---|---|
Liberal | Henry Fenwick | 6,256 | 52.6 | +6.3 | |
Conservative | Nicholas Wood | 4,823 | 40.6 | −13.1 | |
Independent Liberal and Direct Veto | Jonathan Hargrove [n 1] | 814 | 6.8 | New | |
Majority | 1,433 | 12.0 | N/A | ||
Turnout | 11,893 | 86.7 | +2.6 | ||
Registered electors | 13,716 | ||||
Liberal gain from Conservative | Swing | +9.7 |
Party | Candidate | Votes | % | ±% | |
---|---|---|---|---|---|
Liberal | Robert Cameron | 6,592 | 53.6 | +1.0 | |
Conservative | Vincent Charles Stuart Wortley Corbett | 5,711 | 46.4 | +5.8 | |
Majority | 881 | 7.2 | −4.8 | ||
Turnout | 12,303 | 88.0 | +1.3 | ||
Liberal hold | Swing | −2.4 |
Party | Candidate | Votes | % | ±% | |
---|---|---|---|---|---|
Liberal | Robert Cameron | 6,865 | 58.3 | +4.7 | |
Conservative | Ralph Stapleton Ward-Jackson | 4,917 | 41.7 | −4.7 | |
Majority | 1,948 | 16.6 | +9.4 | ||
Turnout | 11,782 | 82.3 | −5.7 | ||
Registered electors | 14,317 | ||||
Liberal hold | Swing | +4.7 |
Party | Candidate | Votes | % | ±% | |
---|---|---|---|---|---|
Liberal | Robert Cameron | 9,429 | 72.2 | +13.9 | |
Liberal Unionist | Roland Edmund Lomax Vaughan Williams | 3,639 | 27.8 | −13.9 | |
Majority | 5,790 | 44.4 | +27.8 | ||
Turnout | 13,068 | 83.2 | +0.9 | ||
Registered electors | 15,711 | ||||
Liberal hold | Swing | +13.9 |
Party | Candidate | Votes | % | ±% | |
---|---|---|---|---|---|
Liberal | Robert Cameron | 10,393 | 70.3 | −1.9 | |
Conservative | Hugh Sidney Streatfield | 4,382 | 29.7 | +1.9 | |
Majority | 6,011 | 40.6 | −3.8 | ||
Turnout | 14,775 | 84.4 | +1.2 | ||
Registered electors | 17,504 | ||||
Liberal hold | Swing | −1.9 |
Party | Candidate | Votes | % | ±% | |
---|---|---|---|---|---|
Liberal | Robert Cameron | Unopposed | |||
Liberal hold |
Party | Candidate | Votes | % | ±% | |
---|---|---|---|---|---|
Liberal | Thomas Wing | 6,930 | 43.6 | N/A | |
Unionist | Thomas Richardson | 4,807 | 30.2 | New | |
Labour | William House | 4,165 | 26.2 | New | |
Majority | 2,123 | 13.4 | N/A | ||
Turnout | 15,902 | 83.6 | N/A | ||
Registered electors | 19,032 | ||||
Liberal hold | Swing | N/A |
General Election 1914–15:
Another General Election was required to take place before the end of 1915. The political parties had been making preparations for an election to take place and by the July 1914, the following candidates had been selected;
Party | Candidate | Votes | % | ±% | |
---|---|---|---|---|---|
Labour | Robert Richardson | 7,315 | 36.4 | N/A | |
Liberal | Thomas Wing | 6,626 | 32.9 | N/A | |
C | National Democratic | John Lindsley | 6,185 | 30.7 | New |
Majority | 689 | 3.5 | N/A | ||
Turnout | 20,126 | 61.8 | N/A | ||
Registered electors | 32,552 | ||||
Labour gain from Liberal | Swing | N/A | |||
Cindicates candidate endorsed by the coalition government. |
Party | Candidate | Votes | % | ±% | |
---|---|---|---|---|---|
Labour | Robert Richardson | 14,611 | 51.9 | +15.5 | |
Unionist | Walter William Shaw | 7,555 | 26.9 | New | |
Liberal | John Edward Johnston | 5,958 | 21.2 | −11.7 | |
Majority | 7,056 | 25.0 | +21.5 | ||
Turnout | 28,124 | 78.4 | +16.6 | ||
Registered electors | 35,871 | ||||
Labour hold | Swing | +13.6 |
Party | Candidate | Votes | % | ±% | |
---|---|---|---|---|---|
Labour | Robert Richardson | 15,225 | 59.3 | +7.4 | |
Liberal | Aaron Curry | 10,445 | 40.7 | +19.5 | |
Majority | 4,780 | 18.6 | −6.4 | ||
Turnout | 25,670 | 69.0 | −9.4 | ||
Registered electors | 37,224 | ||||
Labour hold | Swing | −6.1 |
Party | Candidate | Votes | % | ±% | |
---|---|---|---|---|---|
Labour | Robert Richardson | 17,857 | 57.8 | −1.5 | |
Liberal | Aaron Curry | 13,023 | 42.2 | +1.5 | |
Majority | 4,834 | 15.6 | −3.0 | ||
Turnout | 30,880 | 79.6 | +10.6 | ||
Registered electors | 38,779 | ||||
Labour hold | Swing | −1.5 |
Party | Candidate | Votes | % | ±% | |
---|---|---|---|---|---|
Labour | Robert Richardson | 25,056 | 57.1 | −0.7 | |
Liberal | Thomas Wing | 10,267 | 23.4 | −18.8 | |
Unionist | William George Pearson | 8,545 | 19.5 | New | |
Majority | 14,789 | 33.7 | +18.1 | ||
Turnout | 43,868 | 80.3 | +0.7 | ||
Registered electors | 54,615 | ||||
Labour hold | Swing | +9.1 |
Party | Candidate | Votes | % | ±% | |
---|---|---|---|---|---|
Conservative | Robert Chapman | 25,549 | 52.95 | ||
Labour | Robert Richardson | 22,700 | 47.05 | ||
Majority | 2,849 | 5.90 | N/A | ||
Turnout | 48,249 | 82.78 | |||
Conservative gain from Labour | Swing |
Party | Candidate | Votes | % | ±% | |
---|---|---|---|---|---|
Labour | William Stewart | 30,665 | 57.15 | ||
Conservative | Robert Chapman | 22,990 | 42.85 | ||
Majority | 7,675 | 14.30 | N/A | ||
Turnout | 52,945 | 82.04 | |||
Labour gain from Conservative | Swing |
Party | Candidate | Votes | % | ±% | |
---|---|---|---|---|---|
Labour | Billy Blyton | 43,730 | 66.67 | ||
Conservative | TB Martin | 21,864 | 33.33 | ||
Majority | 21,866 | 33.34 | |||
Turnout | 65,594 | 76.87 | |||
Labour hold | Swing |
Party | Candidate | Votes | % | ±% | |
---|---|---|---|---|---|
Labour | Billy Blyton | 36,044 | 77.14 | ||
Conservative | Beatrice Bolam | 10,682 | 22.86 | ||
Majority | 25,362 | 54.28 | |||
Turnout | 46,726 | 87.22 | |||
Labour hold | Swing |
Party | Candidate | Votes | % | ±% | |
---|---|---|---|---|---|
Labour | Billy Blyton | 37,718 | 75.80 | ||
Conservative | Beatrice Bolam | 12,042 | 24.20 | ||
Majority | 25,676 | 51.60 | |||
Turnout | 49,760 | 86.61 | |||
Labour hold | Swing |
Party | Candidate | Votes | % | ±% | |
---|---|---|---|---|---|
Labour | Billy Blyton | 33,375 | 76.11 | ||
Conservative | Thomas Edward Sydney Egerton | 10,476 | 23.89 | ||
Majority | 22,899 | 52.22 | |||
Turnout | 43,851 | 79.49 | |||
Labour hold | Swing |
Party | Candidate | Votes | % | ±% | |
---|---|---|---|---|---|
Labour | Billy Blyton | 35,960 | 75.93 | ||
Conservative | Andrew Robert Coghill Arbuthnot | 11,398 | 24.07 | ||
Majority | 24,562 | 51.86 | |||
Turnout | 47,358 | 83.41 | |||
Labour hold | Swing |
Party | Candidate | Votes | % | ±% | |
---|---|---|---|---|---|
Labour | Thomas Urwin | 32,914 | 74.82 | ||
Conservative | Peter Coles Price | 11,076 | 25.18 | ||
Majority | 21,838 | 49.64 | |||
Turnout | 43,990 | 78.70 | |||
Labour hold | Swing |
Party | Candidate | Votes | % | ±% | |
---|---|---|---|---|---|
Labour | Thomas Urwin | 32,067 | 77.51 | ||
Conservative | Frederick Howard Michael Craig-Cooper | 9,304 | 22.49 | ||
Majority | 22,763 | 55.02 | |||
Turnout | 41,371 | 73.88 | |||
Labour hold | Swing |
Party | Candidate | Votes | % | ±% | |
---|---|---|---|---|---|
Labour | Thomas Urwin | 32,888 | 73.41 | ||
Conservative | Frederick Howard Michael Craig-Cooper | 11,914 | 26.59 | ||
Majority | 20,974 | 46.82 | |||
Turnout | 44,802 | 71.60 | |||
Labour hold | Swing |
Party | Candidate | Votes | % | ±% | |
---|---|---|---|---|---|
Labour | Thomas Urwin | 34,263 | 76.89 | +3.48 | |
Conservative | RC Ritchie | 10,300 | 23.11 | −3.48 | |
Majority | 23,963 | 53.77 | |||
Turnout | 44,563 | 75.09 | |||
Labour hold | Swing | +3.48 |
Party | Candidate | Votes | % | ±% | |
---|---|---|---|---|---|
Labour | Thomas Urwin | 29,699 | 68.44 | ||
Liberal | W Robson | 9,298 | 21.43 | New | |
Conservative | RC Ritchie | 4,399 | 10.14 | ||
Majority | 20,401 | 47.01 | |||
Turnout | 43,396 | 72.44 | |||
Labour hold | Swing |
Party | Candidate | Votes | % | ±% | |
---|---|---|---|---|---|
Labour | Thomas Urwin | 30,181 | 68.45 | ||
Conservative | Philip Straw | 9,105 | 20.65 | ||
Liberal | J Ellis | 4,479 | 10.16 | ||
Workers Revolutionary | D Temple | 326 | 0.74 | New | |
Majority | 21,076 | 47.80 | |||
Turnout | 44,091 | 72.89 | |||
Labour hold | Swing |
Notes
References