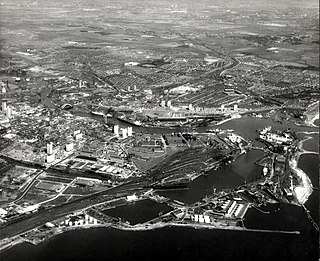
Sunderland City Council election, 2003

Last updated

Sunderland City Council election, 2003
Flag of England.svg
  2002 1 May 2003 2004  

One third of 75 seats on Sunderland City Council
38 seats needed for a majority

 First partySecond partyThird party
 
Party Labour Conservative Liberal Democrat
Seats before62111
Seats won2120
Seats after6391
Seat changeIncrease2.svg1Decrease2.svg2Steady2.svg0

 Fourth partyFifth party
 
Party Independent Liberal
Seats before01
Seats won11
Seats after11
Seat changeIncrease2.svg1Steady2.svg0

Majority party before election

Labour

Majority party after election

Labour

The 2003 Sunderland Council election took place on 1 May 2003 to elect members of Sunderland Metropolitan Borough Council in Tyne and Wear, England. One third of the council was up for election and the Labour party stayed in overall control of the council. [1]

City of Sunderland City and metropolitan borough in England

The City of Sunderland is a local government district of Tyne and Wear, in North East England, with the status of a city and metropolitan borough. It is named after its largest settlement, Sunderland, but covers a far larger area which includes the towns of Hetton-le-Hole, Houghton-le-Spring, and Washington, as well as a range of suburban villages.

Tyne and Wear County of England

Tyne and Wear ( ) is a metropolitan county in the North East region of England around the mouths of the rivers Tyne and Wear. It came into existence in 1974 after the passage of the Local Government Act 1972. It consists of the five metropolitan boroughs of South Tyneside, North Tyneside, City of Newcastle upon Tyne, Gateshead and City of Sunderland. It is bounded on the east by the North Sea, and has borders with Northumberland to the north and County Durham to the south.

England Country in north-west Europe, part of the United Kingdom

England is a country that is part of the United Kingdom. It shares land borders with Wales to the west and Scotland to the north-northwest. The Irish Sea lies west of England and the Celtic Sea lies to the southwest. England is separated from continental Europe by the North Sea to the east and the English Channel to the south. The country covers five-eighths of the island of Great Britain, which lies in the North Atlantic, and includes over 100 smaller islands, such as the Isles of Scilly and the Isle of Wight.

Contents

Campaign

25 seats were contested in the election by a total of 92 candidates, with the Labour party, Conservative party and British National Party contesting every seat. [2] With the British National Party contesting every seat the issue of asylum seekers was important in the election, with the British National Party saying that Sunderland had seen a "palpable invasion of asylum-seekers". [3] However Labour, who were defending 21 of the 25 seats, said that in the previous 2 years only 1,800 had been temporarily housed in the city of a population of 289,000. [3] During the campaign a number of prominent people from the North East including the Bishop of Durham Michael Turnbull and the chairman of Sunderland Football Club Bob Murray issued a statement calling on voters to reject the British National Party. [4]

Conservative Party (UK) Political party in the United Kingdom

The Conservative Party, officially the Conservative and Unionist Party, is a centre-right political party in the United Kingdom. Presently led by Theresa May, it has been the governing party since 2010. It presently has 314 Members of Parliament in the House of Commons, 249 members of the House of Lords, and 18 members of the European Parliament. It also has 31 Members of the Scottish Parliament, 12 members of the Welsh Assembly, eight members of the London Assembly and 9,008 local councillors. One of the major parties of UK politics, it has formed the government on 45 occasions, more than any other party.

The British National Party (BNP) is a far-right, fascist political party in the United Kingdom. It is headquartered in Wigton, Cumbria, and its current leader is Adam Walker. A minor party, it has no elected representatives at any level of UK government. Founded in 1982, the party reached its greatest level of success in the 2000s, when it had over fifty seats in local government, one seat on the London Assembly, and two Members of the European Parliament.

An asylum seeker is a person who flees their home country, enters another country and applies for asylum, i.e. the right to international protection, in this other country. An asylum seeker is a type of migrant and may be a refugee, a displaced person, but not an economic migrant. Migrants are not necessarily asylum seekers. A person becomes an asylum seeker by making a formal application for the right to remain in another country and keeps that status until the application has been concluded. The applicant becomes an "asylee" if their claim is accepted and asylum is granted. The relevant immigration authorities of the country of asylum determine whether the asylum seeker will be granted protection and become an officially recognised refugee (asylee) or whether asylum will be refused and asylum seeker becomes an illegal immigrant who has to leave the country and may even be deported. The asylum seeker may be recognised as a refugee and given refugee status if the person's circumstances fall into the definition of "refugee" according to the 1951 Refugee Convention or other refugee laws, such as the European Convention on Human Rights – if asylum is claimed within the European Union. However signatories to the refugee convention create their own policies for assessing the protection status of asylum seekers, and the proportion of asylum applicants who are rejected varies from country to country and year to year.

The terms asylum seeker and refugee are often confused: an asylum-seeker is someone who says he or she is a refugee, but whose claim has not yet been definitively evaluated. On average, about 1 million people seek asylum on an individual basis every year.

Labour defended their record pointing to an excellent rating in government league tables, having the second lowest council tax in the north east despite a 7.7% rise and to regeneration projects. [5] They targeted the Conservative wards of Hendon and St Peters, but the Conservatives attacked the management of the council for being bloated and said they could bring more efficiency. [5] Meanwhile, the Liberal Democrats contested 13 seats and said there needed to be more opposition councillors to challenge Labour. [5]

Hendon, Sunderland human settlement in the United Kingdom

Hendon is an eastern area of Sunderland in Tyne and Wear, North East England, the location of much heavy industry and Victorian terraces and high-rise residential tower blocks. The area is commonly referred to as the East End of Sunderland.

Liberal Democrats (UK) Political party in the United Kingdom

The Liberal Democrats are a liberal, centrist political party in the United Kingdom. They presently have 11 Members of Parliament in the House of Commons, 96 members of the House of Lords, and one member of the European Parliament. They also have five Members of the Scottish Parliament and a member each in the Welsh Assembly and London Assembly. The party reached the height of its influence in the early 2010s, forming a junior partner in a coalition government from 2010 to 2015. It is presently led by Vince Cable.

A Councillor is a member of a local government council.

The election in Sunderland saw a trial of all postal voting in an attempt to increase turnout. [6] This helped lead to turnout being over double that seen at the 2002 election at 46%. [7]

Postal voting voting, election, ballot papers, distributed to electors or returned by post, mail

Postal voting is voting in an election whereby ballot papers are distributed to electors or returned by post, in contrast to electors voting in person at a polling station or electronically via an electronic voting system. Historically, postal votes must be distributed and placed in return mail before the scheduled election day, it is sometimes referred to as a form of early voting. It can also be used as an absentee ballot. However, in recent times the model in the US has morphed, in municipalities that use postal voting exclusively, to be one of ballots being mailed out to voters, but the return method taking on alternatives of return by mail or dropping off the ballot in person via secure drop boxes and/or voting centers.

Voter turnout percentage of eligible voters who cast a ballot in an election

Voter turnout is the percentage of eligible voters who cast a ballot in an election. Eligibility varies by country, and the voting-eligible population should not be confused with the total adult population. Age and citizenship status are often among the criteria used to determine eligibility, but some countries further restrict eligibility based on sex, race, or religion.

Election result

The results saw Labour hold control of the council with 63 seats after gaining 2 seats from the Conservatives who were reduced to 9 seats. [8] [9] One of the 2 gains saw the former leader of council, Bryn Sidaway, win Hendon by 39 votes after a recount, regaining the seat that he had lost in the 1999 election. [9] However Labour did lose 1 seat in Eppleton to an independent Colin Wakefield who had stood to represent a Residents Against Toxic Site campaign. [9]

The British National Party failed to win any seats, but did win 13,652 votes, 13.75% of the total [7] and came second in 5 wards. [8] The failure of the British National Party was partly attributed to the increase in turnout due to the all-postal voting. [7]

Sunderland Local Election Result 2003 [10] [11] [12]
PartySeatsGainsLossesNet gain/lossSeats %Votes %Votes+/−
  Labour 2121Increase2.svg184.052.552,060Decrease2.svg4.4%
  Conservative 202Decrease2.svg28.022.322,089Decrease2.svg9.6%
  BNP 000Steady2.svg0013.813,652Increase2.svg10.7%
  Liberal Democrat 000Steady2.svg007.37,265Decrease2.svg0.6
  Independent 110Increase2.svg14.02.72,669Increase2.svg2.5%
  Liberal 100Steady2.svg001.41,408Decrease2.svg1.6
  National Front 000Steady2.svg000.173Increase2.svg0.1

This resulted in the following composition of the Council:

PartyPrevious councilNew council
Labour6263
Conservatives119
Liberal Democrats11
Liberal11
Independent01
Total7575
Working majority 49  51 

Ward by ward results

Castletown [10] [12]
PartyCandidateVotes%±
Labour Leslie Mann2,08764.5-21.7
BNP Ian Mcdonald75223.2+23.2
Conservative Gwennyth Gibson39612.2-1.6
Majority1,33541.3-31.2
Turnout 3,23543.1
Labour hold Swing
Central [10] [12]
PartyCandidateVotes%±
Labour Colin Anderson1,59449.0-10.3
BNP Christopher Lathan68621.1+21.1
Conservative Dorreen Storey48715.0-4.6
Liberal Democrat Jane Walters48715.0-6.1
Majority90827.9-10.4
Turnout 3,25442.3
Labour hold Swing
Colliery [10] [12]
PartyCandidateVotes%±
Labour Norman Dent1,72252.4-9.8
Conservative John Brown87826.7-11.1
BNP Ian Leadbitter68520.9+20.9
Majority84425.7+1.4
Turnout 3,28548.4
Labour hold Swing
Eppleton [10] [12]
PartyCandidateVotes%±
Independent Colin Wakefield1,83939.6+39.6
Labour Robert Heron1,78838.5-28.5
Conservative David Wilson46410.0-23.0
Liberal Democrat Philip Dowell3307.1+7.1
BNP James Davison2254.8+4.8
Majority511.1
Turnout 4,64648.9
Independent gain from Labour Swing
Fulwell [10] [12]
PartyCandidateVotes%±
Conservative John Walton2,50653.8-12.7
Labour Rosalind Copeland1,31328.2+6.5
BNP Joseph Dobbie4319.3+4.0
Liberal Democrat Amie Leung4068.7+2.2
Majority1,19325.6-19.2
Turnout 4,65656.8
Conservative hold Swing
Grindon [10] [12]
PartyCandidateVotes%±
Labour David Forbes1,88562.3-4.7
Conservative David Andrew62720.7-12.3
BNP Paul Humble51517.0+17.0
Majority1,25841.6+7.7
Turnout 3,02743.2
Labour hold Swing
Hendon [10] [12]
PartyCandidateVotes%±
Labour Brynley Sidaway1,71142.8-2.2
Conservative Paul Maddison1,67241.8+0.9
BNP David Guynan61915.5+1.5
Majority391.0-3.1
Turnout 4,00251.5
Labour gain from Conservative Swing
Hetton [10] [12]
PartyCandidateVotes%±
Labour Florence Anderson2,80772.9-2.2
Conservative Olwyn Bird62416.2-8.7
BNP Andrew Morris41910.9+10.9
Majority2,18356.7+6.6
Turnout 3,85043.9
Labour hold Swing
Houghton [10] [12]
PartyCandidateVotes%±
Labour Louise Farthing2,46170.1-10.2
Conservative Gordon Newton57116.3-3.4
BNP Ian Patterson48013.7+13.7
Majority1,89053.8-6.7
Turnout 3,51243.9
Labour hold Swing
Pallion [10] [12]
PartyCandidateVotes%±
Labour Robert Pells1,69538.3-6.1
Conservative Stephen Daughton1,58135.8-4.1
BNP David Martin55612.6+12.6
Liberal Democrat Sham Vedhara4109.3-1.8
Independent Ronald Smith1784.0-0.7
Majority1142.6-1.9
Turnout 4,42053.5
Labour gain from Conservative Swing
Ryhope [10] [12]
PartyCandidateVotes%±
Labour Aileen Handy2,65754.5-15.3
Liberal Democrat Martyn Herron79816.4+16.4
Conservative William Dunn73015.0-15.2
BNP Michael Matthews69114.2+14.2
Majority1,85938.1-1.5
Turnout 4,87645.9
Labour hold Swing
St Chad's [10] [12]
PartyCandidateVotes%±
Labour John Porthouse2,09050.2-8.0
Conservative Lee Martin1,22429.4-12.4
Liberal Democrat Elizabeth Foreman43710.5+10.5
BNP Carol Dobbie41510.0+10.0
Majority86620.8+4.4
Turnout 4,16651.9
Labour hold Swing
St Michael's [10] [12]
PartyCandidateVotes%±
Conservative Peter Wood2,72756.7-10.2
Labour David Errington1,55132.2-0.9
BNP Stephen Bilton53411.1+11.1
Majority1,17624.4-9.5
Turnout 4,81255.8
Conservative hold Swing
St Peter's [10] [12]
PartyCandidateVotes%±
Labour Christine Shattock1,48134.0-1.8
Conservative Lilian Walton1,36231.3-8.1
Liberal Democrat John Lennox84119.3-5.4
BNP Jason Dent67415.5+15.5
Majority1192.7
Turnout 4,35854.1
Labour hold Swing
Shiney Row [10] [12]
PartyCandidateVotes%±
Labour Anne Hall3,06060.8-11.7
Liberal Democrat Neil Grundy87817.4+17.4
Conservative John Calvert62112.3-15.2
BNP Sharon Leadbitter4749.4+9.4
Majority2,18243.4-1.7
Turnout 5,03345.2
Labour hold Swing
Silksworth [10] [12]
PartyCandidateVotes%±
Labour Patricia Smith2,76065.7-6.5
Conservative Patricia Francis64615.4-6.1
BNP Trevor Jenkins57513.7+7.4
Independent Georgina Kennedy2215.3+5.3
Majority2,11450.3-0.4
Turnout 4,20244.3
Labour hold Swing
South Hylton [10] [12]
PartyCandidateVotes%±
Labour Susan Watson1,92761.7-6.7
BNP Debra Hiles67421.6+21.6
Conservative Kathryn Chamberlin52016.7-14.9
Majority1,25340.1+3.3
Turnout 3,12143.0
Labour hold Swing
Southwick [10] [12]
PartyCandidateVotes%±
Labour Bryan Charlton1,51953.1-9.8
BNP Alan Brettwood51017.8-1.9
Independent Frederick Crone43115.1+15.1
Liberal Democrat Christine Griffin2177.6-3.7
Conservative Alice Mclaren1836.4+0.2
Majority1,00935.3-7.9
Turnout 2,86045.7
Labour hold Swing
Thorney Close [10] [12]
PartyCandidateVotes%±
Labour David Allan1,98363.7-3.4
BNP Joseph Dobbie68021.8+6.2
Conservative Paula Wilkinson45014.5-2.8
Majority1,30341.9-8.0
Turnout 3,11342.6
Labour hold Swing
Thornholme [10] [12]
PartyCandidateVotes%±
Liberal Winifred Lundgren1,40842.9-13.7
Labour Phillip Gibson91928.0-2.2
Conservative Marjorie Matthews49915.2+2.0
BNP Philip Clark45313.8+13.8
Majority48914.9-11.5
Turnout 3,27945.5
Liberal hold Swing
Town End Farm [10] [12]
PartyCandidateVotes%±
Labour Gowan Scott1,76059.4-1.7
BNP John Martin87829.7+1.7
Conservative Gillian Connor32310.9+0.0
Majority88229.8-3.3
Turnout 2,96145.1
Labour hold Swing
Washington East [10] [12]
PartyCandidateVotes%±
Labour Eric Timmins3,00361.0-1.1
Conservative Jacqueline Atkinson82216.7-6.1
Liberal Democrat Avril Kitching65013.2-1.9
BNP David Richardson3717.5+7.5
National Front Mark Farrell731.5+1.5
Majority2,18144.3+5.0
Turnout 4,91944.2
Labour hold Swing
Washington North [10] [12]
PartyCandidateVotes%±
Labour John Murray2,70374.0-5.5
Conservative Kathleen Irvine52814.5-6.0
BNP Ian Guilbert42211.6+11.6
Majority2,17559.5+0.5
Turnout 3,65342.2
Labour hold Swing
Washington South [10] [12]
PartyCandidateVotes%±
Labour Bryan Williams3,15252.4+2.6
Liberal Democrat Owen Dumpleton1,16919.4+1.9
Conservative Michael Dixon1,11218.5-14.2
BNP Gordon Pace5869.7+9.7
Majority1,98332.9+15.8
Turnout 6,01942.4
Labour hold Swing
Washington West [10] [12]
PartyCandidateVotes%±
Labour William Craddock2,43261.5-4.3
Liberal Democrat David Griffin64216.2-1.4
Conservative Justin Garrod53613.5-3.0
BNP Keith Byrne3478.8+8.8
Majority1,79045.2-3.0
Turnout 3,95742.8
Labour hold Swing

Related Research Articles

The 2008 Thurrock Council election took place on 1 May 2008 to elect members of Thurrock Council in Essex, England. One third of the council was up for election and the council stayed under no overall control.

The 2007 Thurrock Council election took place on 3 May 2007 to elect members of Thurrock Council in Essex, England. One third of the council was up for election and the Conservative party lost overall control of the council to no overall control.

The 2003 Gateshead Council election was held on 1 May 2003 to elect members of Gateshead Council in Tyne and Wear, England. One third of the council was up for election and the Labour party kept overall control of the council.

The 2003 Worthing Borough Council election took place on 1 May 2003 to elect members of Worthing Borough Council in West Sussex, England. One third of the council was up for election and the Liberal Democrats lost overall control of the council to no overall control. Overall turnout was 28.61%.

The 2004 Wakefield Metropolitan District Council election took place on 10 June 2004 to elect members of Wakefield Metropolitan District Council in West Yorkshire, England. The whole council was up for election with boundary changes since the last election in 2003. The Labour party stayed in overall control of the council.

The 2003 Worcester City Council election took place on 1 May 2003 to elect members of Worcester District Council in Worcestershire, England. One third of the council was up for election and the Conservative party gained overall control of the council from no overall control.

The 2003 South Tyneside Metropolitan Borough Council election took place on 1 May 2003 to elect members of South Tyneside Metropolitan Borough Council in Tyne and Wear, England. One third of the council was up for election and the Labour party kept overall control of the council.

2006 Rushmoor Borough Council election

The 2006 Rushmoor Council election took place on 4 May 2006 to elect members of Rushmoor Borough Council in Hampshire, England. One third of the council was up for election and the Conservative party stayed in overall control of the council.
2006 Swindon Borough Council election

The 2006 Swindon Borough Council election took place on 4 May 2006 to elect members of Swindon Unitary Council in Wiltshire, England. One third of the council was up for election and the Conservative party stayed in overall control of the council.

2004 Solihull Metropolitan Borough Council election

The 2004 Solihull Metropolitan Borough Council election took place on 10 June 2004 to elect members of Solihull Metropolitan Borough Council in the West Midlands, England. The whole council was up for election with boundary changes since the last election in 2003. The Conservative party stayed in overall control of the council.

2006 Solihull Metropolitan Borough Council election

The 2006 Solihull Metropolitan Borough Council election took place on 4 May 2006 to elect members of Solihull Metropolitan Borough Council in the West Midlands, England. One third of the council was up for election and the Conservative party stayed in overall control of the council.

2007 Solihull Metropolitan Borough Council election

The 2007 Solihull Metropolitan Borough Council election took place on 4 May 2007 to elect members of Solihull Metropolitan Borough Council in the West Midlands, England. One third of the council was up for election and the Conservative party lost overall control of the council to no overall control.

The 2002 Sunderland Council election took place on 2 May 2002 to elect members of Sunderland Metropolitan Borough Council in Tyne and Wear, England. One third of the council was up for election and the Labour party stayed in overall control of the council.

2004 Sunderland City Council election

The 2004 Sunderland City Council election took place on 10 June 2004 to elect members of Sunderland City Council Council in Tyne and Wear, England. The whole council was up for election following boundary changes since the last election in 2003. The Labour party stayed in overall control of the council.

2006 Sunderland City Council election

The 2006 Sunderland Council election took place on 4 May 2006 to elect members of Sunderland City Council in Tyne and Wear, England. One third of the Council was up for election and the Labour party stayed in overall control.
2007 Sunderland City Council election

The 2007 Sunderland Council election took place on 3 May 2007 to elect members of Sunderland Metropolitan Borough Council in Tyne and Wear, England. One third of the council was up for election and the Labour party stayed in overall control of the council.

2008 Sunderland City Council election

The 2008 Sunderland Council election took place on 1 May 2008 to elect members of Sunderland Metropolitan Borough Council in Tyne and Wear, England. One third of the council was up for election and the Labour party stayed in overall control of the council.

2010 Sunderland City Council election

The 2010 Sunderland Council election took place on 6 May 2010 to elect members of Sunderland Metropolitan Borough Council in Tyne and Wear, England. One third of the council was up for election and the Labour party stayed in overall control of the council. The election took place on the same day as the 2010 General Election.

The 2003 Sandwell Metropolitan Borough Council election took place on 1 May 2003 to elect members of Sandwell Metropolitan Borough Council in the West Midlands, England. One third of the council was up for election and the Labour party stayed in overall control of the council.

2011 Sunderland City Council election

The 2011 Sunderland Council election took place on 5 May 2011 to elect members of Sunderland Metropolitan Borough Council in Tyne and Wear, England. One third of the council was up for election and the Labour party stayed in overall control of the council.

References

  1. "Local elections". BBC News Online . Retrieved 2010-12-22.
  2. Redvers, Louise (2003-04-02). "BNP bid to seize Town Hall seats". Evening Chronicle. p. 10.
  3. 1 2 Norfolk, Andrew (2003-04-15). "BNP to make history at council elections". The Times. p. 16.
  4. Jennings, Lindsay (2003-04-18). "Bishop leads campaign to block BNP in North-East". The Northern Echo. p. 1.
  5. 1 2 3 Dargie, Alison (2003-04-19). "Labour set to harness optimism". The Journal. p. 28.
  6. Young, Peter (2003-04-17). "Armchair electorate put in the hotseat". Evening Chronicle. p. 18.
  7. 1 2 3 Norfolk, Andrew; S/herman, Jill (2003-05-02). "BNP surges in Burnley but stalls in Sunderland". The Times. p. 15.
  8. 1 2 Johnston, Philip; Stokes, Paul (2003-05-02). "BNP's gains will give it a first taste of power". The Daily Telegraph. p. 9.
  9. 1 2 3 "Sunderland". The Journal. 2003-05-02. p. 2.
  10. 1 2 3 4 5 6 7 8 9 10 11 12 13 14 15 16 17 18 19 20 21 22 23 24 25 26 "Postal Voting - 1st May 2003". Political Science Resources. Retrieved 2010-12-22.
  11. "Election results; English Councils; Local elections 2003". The Times. 2003-05-02. p. 16.
  12. 1 2 3 4 5 6 7 8 9 10 11 12 13 14 15 16 17 18 19 20 21 22 23 24 25 26 "Election results". The Journal. 2003-05-02. p. 44.
Preceded by
Sunderland City Council election, 2002
Sunderland City Council elections Succeeded by
Sunderland City Council election, 2004