
A timeline is a display of a list of events in chronological order. It is typically a graphic design showing a long bar labelled with dates paralleling it, and usually contemporaneous events.

A planetarium is a theatre built primarily for presenting educational and entertaining shows about astronomy and the night sky, or for training in celestial navigation.

A chart is a graphical representation for data visualization, in which "the data is represented by symbols, such as bars in a bar chart, lines in a line chart, or slices in a pie chart". A chart can represent tabular numeric data, functions or some kinds of quality structure and provides different info.

A spectrogram is a visual representation of the spectrum of frequencies of a signal as it varies with time. When applied to an audio signal, spectrograms are sometimes called sonographs, voiceprints, or voicegrams. When the data are represented in a 3D plot they may be called waterfall displays.

Depth perception is the ability to perceive distance to objects in the world using the visual system and visual perception. It is a major factor in perceiving the world in three dimensions. Depth perception happens primarily due to stereopsis and accommodation of the eye.
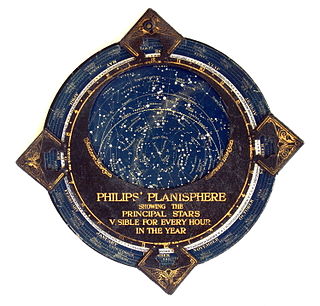
In astronomy, a planisphere is a star chart analog computing instrument in the form of two adjustable disks that rotate on a common pivot. It can be adjusted to display the visible stars for any time and date. It is an instrument to assist in learning how to recognize stars and constellations. The astrolabe, an instrument that has its origins in Hellenistic astronomy, is a predecessor of the modern planisphere. The term planisphere contrasts with armillary sphere, where the celestial sphere is represented by a three-dimensional framework of rings.
Graphics are visual images or designs on some surface, such as a wall, canvas, screen, paper, or stone, to inform, illustrate, or entertain. In contemporary usage, it includes a pictorial representation of data, as in design and manufacture, in typesetting and the graphic arts, and in educational and recreational software. Images that are generated by a computer are called computer graphics.

A bar chart or bar graph is a chart or graph that presents categorical data with rectangular bars with heights or lengths proportional to the values that they represent. The bars can be plotted vertically or horizontally. A vertical bar chart is sometimes called a column chart.

A scatter plot is a type of plot or mathematical diagram using Cartesian coordinates to display values for typically two variables for a set of data. If the points are coded (color/shape/size), one additional variable can be displayed. The data are displayed as a collection of points, each having the value of one variable determining the position on the horizontal axis and the value of the other variable determining the position on the vertical axis.
A small multiple is a series of similar graphs or charts using the same scale and axes, allowing them to be easily compared. It uses multiple views to show different partitions of a dataset. The term was popularized by Edward Tufte.
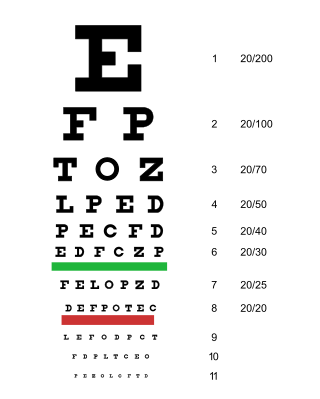
Visual acuity (VA) commonly refers to the clarity of vision, but technically rates a person's ability to recognize small details with precision. Visual acuity depends on optical and neural factors. Optical factors of the eye influence the sharpness of an image on its retina. Neural factors include the health and functioning of the retina, of the neural pathways to the brain, and of the interpretative faculty of the brain.

Visualization or visualisation is any technique for creating images, diagrams, or animations to communicate a message. Visualization through visual imagery has been an effective way to communicate both abstract and concrete ideas since the dawn of humanity. from history include cave paintings, Egyptian hieroglyphs, Greek geometry, and Leonardo da Vinci's revolutionary methods of technical drawing for engineering and scientific purposes.

A pie chart is a circular statistical graphic which is divided into slices to illustrate numerical proportion. In a pie chart, the arc length of each slice is proportional to the quantity it represents. While it is named for its resemblance to a pie which has been sliced, there are variations on the way it can be presented. The earliest known pie chart is generally credited to William Playfair's Statistical Breviary of 1801.

Infographics are graphic visual representations of information, data, or knowledge intended to present information quickly and clearly. They can improve cognition by utilizing graphics to enhance the human visual system's ability to see patterns and trends. Similar pursuits are information visualization, data visualization, statistical graphics, information design, or information architecture. Infographics have evolved in recent years to be for mass communication, and thus are designed with fewer assumptions about the readers' knowledge base than other types of visualizations. Isotypes are an early example of infographics conveying information quickly and easily to the masses.

In video gaming, the HUD or status bar is the method by which information is visually relayed to the player as part of a game's user interface. It takes its name from the head-up displays used in modern aircraft.

Data and information visualization is the practice of designing and creating easy-to-communicate and easy-to-understand graphic or visual representations of a large amount of complex quantitative and qualitative data and information with the help of static, dynamic or interactive visual items. Typically based on data and information collected from a certain domain of expertise, these visualizations are intended for a broader audience to help them visually explore and discover, quickly understand, interpret and gain important insights into otherwise difficult-to-identify structures, relationships, correlations, local and global patterns, trends, variations, constancy, clusters, outliers and unusual groupings within data. When intended for the general public to convey a concise version of known, specific information in a clear and engaging manner, it is typically called information graphics.
A thematic map is a type of map that portrays the geographic pattern of a particular subject matter (theme) in a geographic area. This usually involves the use of map symbols to visualize selected properties of geographic features that are not naturally visible, such as temperature, language, or population. In this, they contrast with general reference maps, which focus on the location of a diverse set of physical features, such as rivers, roads, and buildings. Alternative names have been suggested for this class, such as special-subject or special-purpose maps, statistical maps, or distribution maps, but these have generally fallen out of common usage. Thematic mapping is closely allied with the field of Geovisualization.

Contrast is the difference in luminance or colour that makes an object visible on a background of different luminance or color. The human visual system is more sensitive to contrast than to absolute luminance; we can perceive the world similarly regardless of the huge changes in illumination over the day or from place to place. The maximum contrast of an image is the contrast ratio or dynamic range. Images with a contrast ratio close to their medium's maximum possible contrast ratio experience a conservation of contrast, wherein any increase in contrast in some parts of the image must necessarily result in a decrease in contrast elsewhere. Brightening an image will increase contrast in dark areas but decrease contrast in bright areas, while darkening the image will have the opposite effect. Bleach bypass destroys contrast in both the darkest and brightest parts of an image while enhancing luminance contrast in areas of intermediate brightness.
A conoscopic interference pattern or interference figure is a pattern of birefringent colours crossed by dark bands, which can be produced using a geological petrographic microscope for the purposes of mineral identification and investigation of mineral optical and chemical properties. The figures are produced by optical interference when diverging light rays travel through an optically non-isotropic substance – that is, one in which the substance's refractive index varies in different directions within it. The figure can be thought of as a "map" of how the birefringence of a mineral would vary with viewing angle away from perpendicular to the slide, where the central colour is the birefringence seen looking straight down, and the colours further from the centre equivalent to viewing the mineral at ever increasing angles from perpendicular. The dark bands correspond to positions where optical extinction would be seen. In other words, the interference figure presents all possible birefringence colours for the mineral at once.

Jacques Barbeu-Dubourg was a French physician, botanist, writer, translator and publisher known for translating Benjamin Franklin's work into French and for inventing a gentlemen's umbrella fitted with a lightning conductor. He designed a method of histographic visualizations which he called the Carte chronographique.
