The Council elections held in Wolverhampton on Thursday 2 May 1991 were one third, and 20 of the 60 seats were up for election.
During the 1991 election the Merry Hill ward had two seats contested due to a vacancy arising.
Prior to the election the constitution of the Council was:
The Labour Party is a centre-left political party in the United Kingdom that has been described as an alliance of social democrats, democratic socialists and trade unionists. The party's platform emphasises greater state intervention, social justice and strengthening workers' rights.
The Conservative Party, officially the Conservative and Unionist Party, is a centre-right political party in the United Kingdom. The governing party since 2010, it is the largest in the House of Commons, with 313 Members of Parliament, and also has 249 members of the House of Lords, 18 members of the European Parliament, 31 Members of the Scottish Parliament, 12 members of the Welsh Assembly, eight members of the London Assembly and 8,916 local councillors.
The Liberal Democrats are a centrist, liberal political party in the United Kingdom. It is currently led by Vince Cable. It has 11 Members of Parliament in the House of Commons, 96 members of the House of Lords, one member of the European Parliament, five Members of the Scottish Parliament and one member in the Welsh Assembly and London Assembly. At the height of its influence, the party served as junior partners in a coalition government with the Conservative Party from 2010 to 2015.
Following the election the constitution of the Council was:
Party | Candidate | Votes | % | ± | |
---|---|---|---|---|---|
Labour | T H Turner | 1738 | |||
Liberal Democrat | Mrs A Ramsbottom | 616 | |||
Conservative | R Green | 413 | |||
Independent Conservative | J Davies | 260 | |||
Majority | 1122 | ||||
Party | Candidate | Votes | % | ± | |
---|---|---|---|---|---|
Labour | Miss M Benton | 2257 | |||
Conservative | S Mills | 1599 | |||
Liberal Democrat | Mrs L Gwinnett | 432 | |||
Majority | 658 | ||||
Party | Candidate | Votes | % | ± | |
---|---|---|---|---|---|
Labour | R Reynolds | 2477 | |||
Conservative | Mrs J Shore | 1221 | |||
Liberal Democrat | Mrs M O'Brien | 415 | |||
Majority | 1256 | ||||
Party | Candidate | Votes | % | ± | |
---|---|---|---|---|---|
Conservative | P J Turley | 2571 | |||
Labour | P Hamid | 1357 | |||
Liberal Democrat | A Whitehouse | 456 | |||
Majority | 1214 | ||||
Party | Candidate | Votes | % | ± | |
---|---|---|---|---|---|
Labour | F Docherty | 2049 | |||
Conservative | M Bailey | 863 | |||
Liberal Democrat | J R Steatham | 749 | |||
Majority | 1186 | ||||
Party | Candidate | Votes | % | ± | |
---|---|---|---|---|---|
Labour | Mrs J Jones | 2162 | |||
Conservative | Miss A J Green | 717 | |||
Liberal Democrat | I Kerr | 241 | |||
Majority | 1445 | ||||
Party | Candidate | Votes | % | ± | |
---|---|---|---|---|---|
Conservative | B Findlay | 2032 | |||
Labour | I Grainger | 1983 | |||
Liberal | A Bourke | 296 | |||
Liberal Democrat | S Birch | 240 | |||
Majority | 49 | ||||
Party | Candidate | Votes | % | ± | |
---|---|---|---|---|---|
Conservative | J P Mellor | 2501 | |||
Labour | Mrs J Rowley | 2353 | |||
Liberal Democrat | W Beard | 354 | |||
Majority | 148 | ||||
Party | Candidate | Votes | % | ± | |
---|---|---|---|---|---|
Labour | M Jaspal | 1469 | |||
Liberal | C Hallmark | 1160 | |||
Conservative | Mrs T Brindley | 833 | |||
Majority | 309 | ||||
Party | Candidate | Votes | % | ± | |
---|---|---|---|---|---|
Labour | P O'Neill | 2342 | |||
Conservative | A Lort | 862 | |||
Liberal Democrat | D Isles | 330 | |||
Majority | 1480 | ||||
Party | Candidate | Votes | % | ± | |
---|---|---|---|---|---|
Conservative | R Hart | 2612 | |||
Conservative | Mrs C V Mills | 2186 | |||
Labour | C F Matthews | 1327 | |||
Labour | S Smith | 1273 | |||
Liberal Democrat | J White | 576 | |||
Liberal Democrat | S Jones-Williams | 546 | |||
Party | Candidate | Votes | % | ± | |
---|---|---|---|---|---|
Conservative | N Patten | 2074 | |||
Labour | L Turner | 1837 | |||
Liberal Democrat | I Jenkins | 536 | |||
Majority | 237 | ||||
Party | Candidate | Votes | % | ± | |
---|---|---|---|---|---|
Conservative | Mrs M W Hodson | 2662 | |||
Labour | K Vernon | 1843 | |||
Liberal Democrat | B H Lewis | 659 | |||
Majority | 819 | ||||
Party | Candidate | Votes | % | ± | |
---|---|---|---|---|---|
Conservative | Paddy Bradley | 2966 | |||
Labour | P Bhutta | 942 | |||
Liberal Democrat | Mrs C Jones-Williams | 771 | |||
Majority | 2024 | ||||
Party | Candidate | Votes | % | ± | |
---|---|---|---|---|---|
Labour | R Lawrence | 2902 | |||
Conservative | M Norton | 728 | |||
Liberal Democrat | R Gray | 400 | |||
Majority | 2172 | ||||
Party | Candidate | Votes | % | ± | |
---|---|---|---|---|---|
Liberal Democrat | Mrs K M Morgan | 2402 | |||
Labour | Mrs B Johnson | 1889 | |||
Conservative | A Round | 689 | |||
Independent Conservative | E Shaw | 104 | |||
Majority | 513 | ||||
Party | Candidate | Votes | % | ± | |
---|---|---|---|---|---|
Conservative | J Davis | 2425 | |||
Liberal Democrat | L McLean | 1572 | |||
Labour | Mrs P Wesley | 829 | |||
Majority | 853 | ||||
Party | Candidate | Votes | % | ± | |
---|---|---|---|---|---|
Conservative | J Inglis | 3114 | |||
Labour | Mrs C M Siarkiewicz | 979 | |||
Liberal Democrat | Mrs T O'Brien | 496 | |||
Majority | 2135 | ||||
Party | Candidate | Votes | % | ± | |
---|---|---|---|---|---|
Labour | Mrs G Stafford-Good | 1998 | |||
Conservative | A Dawson | 1690 | |||
Liberal | M Pearson | 892 | |||
Majority | 308 | ||||
Party | Candidate | Votes | % | ± | |
---|---|---|---|---|---|
Conservative | T Brindley | 1843 | |||
Labour | R Garner | 1832 | |||
Liberal Democrat | P Richards | 432 | |||
Majority | 11 | ||||
Slough Borough Council is the local authority for the Borough of Slough, in the South East England Region of the United Kingdom.
Elections to the Borough Council in Slough, England, were held on 1 May 2008. This was the 123rd Slough general local authority election since Slough became a local government unit in 1863.
The Council elections held in Wolverhampton on Thursday 1 May 1986 were one third, and 20 of the 60 seats were up for election.
The Council elections held in Wolverhampton on Thursday 3 May 1990 were one third, and 20 of the 60 seats were up for election.
The Council elections held in Wolverhampton on Thursday 4 May 1995 were one third, and 20 of the 60 seats were up for election.
The 1999 Woking Council election took place on 6 May 1999 to elect members of Woking Borough Council in Surrey, England.
The 1998 Stroud Council election took place on 7 May 1998 to elect members of Stroud District Council in Gloucestershire, England. One third of the council was up for election and the council stayed under no overall control.
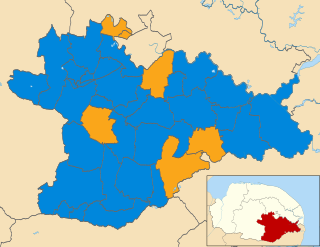
The elections to South Norfolk District Council were held on Thursday 5 May 2011 along with various other local elections around England, elections to the Scottish Parliament, National Assembly of Wales and Northern Ireland Assembly, and a referendum on whether to adopt the Alternative Vote electoral system for elections to the House of Commons. All 46 council seats were up for election. The previous council was controlled by the Conservatives, with the Liberal Democrats being the only opposition.
The Broxbourne Council election, 1991 was held to elect council members of the Broxbourne Borough Council, the local government authority of the borough of Broxbourne, Hertfordshire, England.
The seventh full elections for Guildford Borough Council took place on 4 May 1995. The results saw the Liberal Democrats win majority control of the council for the first time winning 23 of the 45 seats. The Conservatives won 13 seats. Labour retained 6 seats and 3 independents were elected.
The 2011 council elections in Guildford saw the Conservatives retain control over Guildford Borough Council with an increased majority of 20 seats. Full results for each ward can be found at Guildford Council election, full results, 2011.
The 2012 Adur District Council elections took place on 3 May 2012 to elect members of Adur District Council in West Sussex, England. Half of the council was up for election, and the Conservative Party remained in overall control of the council.
The 2011 Derbyshire Dales District Council election took place on 5 May 2011 to elect members of Derbyshire Dales District Council in Derbyshire, England. The whole council was up for election and the Conservative party stayed in overall control of the council.
The Leeds City Council elections were held on Thursday, 2 May 1991, with one third of the council and a vacancy in Horsforth to be elected.
The 1991 Bolton Metropolitan Borough Council election took place on 6 May 1991 to elect members of Bolton Metropolitan Borough Council in Greater Manchester, England. One third of the council was up for election and the Labour party kept overall control of the council.
The 2003 Colchester Borough Council election took place on 1 May 2003 to elect members of Colchester Borough Council in Essex, England. This was the same day as the other 2003 United Kingdom local elections. One third of the seats were up for election and the council stayed under no overall control.
The 2012 St Helens Metropolitan Borough Council election took place on 3 May 2012 to elect members of St Helens Metropolitan Borough Council in Merseyside, England. One third of the council was up for election and the Labour party stayed in overall control of the council.
The 2015 Basingstoke and Deane Borough Council election took place on 7 May 2015 to elect members of Basingstoke and Deane Borough Council in England. It was held on the same day as the 2015 general election as well as other local elections.
The 2014 West Oxfordshire District Council election took place on 22 May 2014 to elect members of West Oxfordshire District Council in Oxfordshire, England. One third of the council was up for election and the Conservative party stayed in overall control of the council.
The 2016 Sefton Metropolitan Borough Council election took place on 5 May 2016 to elect members of Sefton Metropolitan Borough Council in England. This was on the same day as other local elections. Sefton is split up into 22 wards, each electing 3 councillors, totalling up to 66 seats. Note, only 22 seats were up for election.